. 2016 Aug 4;536(7614):41-47.
doi: 10.1038/nature18642. Epub 2016 Jul 11.

The genetic architecture of type 2 diabetes

Christian Fuchsberger #  1   2   3 Jason Flannick #  4   5 Tanya M Teslovich #  1 Anubha Mahajan #  6 Vineeta Agarwala #  4   7 Kyle J Gaulton #  6 Clement Ma  1 Pierre Fontanillas  4 Loukas Moutsianas  6 Davis J McCarthy  6   8 Manuel A Rivas  6 John R B Perry  6   9   10   11 Xueling Sim  1 Thomas W Blackwell  1 Neil R Robertson  6   12 N William Rayner  6   12   13 Pablo Cingolani  14   15 Adam E Locke  1 Juan Fernandez Tajes  6 Heather M Highland  16 Josee Dupuis  17   18 Peter S Chines  19 Cecilia M Lindgren  4   6 Christopher Hartl  4 Anne U Jackson  1 Han Chen  17   20 Jeroen R Huyghe  1 Martijn van de Bunt  6   12 Richard D Pearson  6 Ashish Kumar  6   21 Martina Müller-Nurasyid  22   23   24   25 Niels Grarup  26 Heather M Stringham  1 Eric R Gamazon  27 Jaehoon Lee  28 Yuhui Chen  6 Robert A Scott  10 Jennifer E Below  29 Peng Chen  30 Jinyan Huang  31 Min Jin Go  32 Michael L Stitzel  33 Dorota Pasko  9 Stephen C J Parker  34 Tibor V Varga  35 Todd Green  4 Nicola L Beer  12 Aaron G Day-Williams  13 Teresa Ferreira  6 Tasha Fingerlin  36 Momoko Horikoshi  6   12 Cheng Hu  37 Iksoo Huh  28 Mohammad Kamran Ikram  38   39   40 Bong-Jo Kim  32 Yongkang Kim  28 Young Jin Kim  32 Min-Seok Kwon  41 Juyoung Lee  32 Selyeong Lee  28 Keng-Han Lin  1 Taylor J Maxwell  29 Yoshihiko Nagai  15   42   43 Xu Wang  30 Ryan P Welch  1 Joon Yoon  41 Weihua Zhang  44   45 Nir Barzilai  46 Benjamin F Voight  47   48 Bok-Ghee Han  32 Christopher P Jenkinson  49   50 Teemu Kuulasmaa  51 Johanna Kuusisto  51   52 Alisa Manning  4 Maggie C Y Ng  53   54 Nicholette D Palmer  53   54   55 Beverley Balkau  56 Alena Stančáková  51 Hanna E Abboud  49 Heiner Boeing  57 Vilmantas Giedraitis  58 Dorairaj Prabhakaran  59 Omri Gottesman  60 James Scott  61 Jason Carey  4 Phoenix Kwan  1 George Grant  4 Joshua D Smith  62 Benjamin M Neale  4   63   64 Shaun Purcell  4   64   65 Adam S Butterworth  66 Joanna M M Howson  66 Heung Man Lee  67 Yingchang Lu  60 Soo-Heon Kwak  68 Wei Zhao  69 John Danesh  13   66   70 Vincent K L Lam  67 Kyong Soo Park  68   71 Danish Saleheen  72   73 Wing Yee So  67 Claudia H T Tam  67 Uzma Afzal  44 David Aguilar  74 Rector Arya  75 Tin Aung  38   39   40 Edmund Chan  76 Carmen Navarro  77   78   79 Ching-Yu Cheng  30   38   39   40 Domenico Palli  80 Adolfo Correa  81 Joanne E Curran  82 Denis Rybin  17 Vidya S Farook  83 Sharon P Fowler  49 Barry I Freedman  84 Michael Griswold  85 Daniel Esten Hale  75 Pamela J Hicks  53   54   55 Chiea-Chuen Khor  30   38   39   86   87 Satish Kumar  82 Benjamin Lehne  44 Dorothée Thuillier  88 Wei Yen Lim  30 Jianjun Liu  30   87 Yvonne T van der Schouw  89 Marie Loh  44   90   91 Solomon K Musani  92 Sobha Puppala  83 William R Scott  44 Loïc Yengo  88 Sian-Tsung Tan  45   61 Herman A Taylor Jr  81 Farook Thameem  49 Gregory Wilson Sr  93 Tien Yin Wong  38   39   40 Pål Rasmus Njølstad  94   95 Jonathan C Levy  12 Massimo Mangino  11 Lori L Bonnycastle  19 Thomas Schwarzmayr  96 João Fadista  97 Gabriela L Surdulescu  11 Christian Herder  98   99 Christopher J Groves  12 Thomas Wieland  96 Jette Bork-Jensen  26 Ivan Brandslund  100   101 Cramer Christensen  102 Heikki A Koistinen  103   104   105   106 Alex S F Doney  107 Leena Kinnunen  103 Tõnu Esko  4   108   109   110 Andrew J Farmer  111 Liisa Hakaste  104   112   113 Dylan Hodgkiss  11 Jasmina Kravic  97 Valeriya Lyssenko  97 Mette Hollensted  26 Marit E Jørgensen  114 Torben Jørgensen  115   116   117 Claes Ladenvall  97 Johanne Marie Justesen  26 Annemari Käräjämäki  118   119 Jennifer Kriebel  99   120   121 Wolfgang Rathmann  122 Lars Lannfelt  58 Torsten Lauritzen  123 Narisu Narisu  19 Allan Linneberg  115   124   125 Olle Melander  126 Lili Milani  108 Matt Neville  12   127 Marju Orho-Melander  128 Lu Qi  129   130 Qibin Qi  129   131 Michael Roden  98   99   132 Olov Rolandsson  133 Amy Swift  19 Anders H Rosengren  97 Kathleen Stirrups  13 Andrew R Wood  9 Evelin Mihailov  108 Christine Blancher  134 Mauricio O Carneiro  4 Jared Maguire  4 Ryan Poplin  4 Khalid Shakir  4 Timothy Fennell  4 Mark DePristo  4 Martin Hrabé de Angelis  99   135   136 Panos Deloukas  137   138 Anette P Gjesing  26 Goo Jun  1   29 Peter Nilsson  139 Jacquelyn Murphy  4 Robert Onofrio  4 Barbara Thorand  99   120 Torben Hansen  26   140 Christa Meisinger  99   120 Frank B Hu  31   129 Bo Isomaa  112   141 Fredrik Karpe  12   127 Liming Liang  20   31 Annette Peters  25   99   120 Cornelia Huth  99   120 Stephen P O'Rahilly  142 Colin N A Palmer  143 Oluf Pedersen  26 Rainer Rauramaa  144 Jaakko Tuomilehto  103   145   146   147   148 Veikko Salomaa  148 Richard M Watanabe  149   150   151 Ann-Christine Syvänen  152 Richard N Bergman  153 Dwaipayan Bharadwaj  154 Erwin P Bottinger  60 Yoon Shin Cho  155 Giriraj R Chandak  156 Juliana C N Chan  67   157   158 Kee Seng Chia  30 Mark J Daly  63 Shah B Ebrahim  59 Claudia Langenberg  10 Paul Elliott  44   159 Kathleen A Jablonski  160 Donna M Lehman  49 Weiping Jia  37 Ronald C W Ma  67   157   158 Toni I Pollin  161 Manjinder Sandhu  13   66 Nikhil Tandon  162 Philippe Froguel  88   163 Inês Barroso  13   142 Yik Ying Teo  30   164   165 Eleftheria Zeggini  13 Ruth J F Loos  60 Kerrin S Small  11 Janina S Ried  22 Ralph A DeFronzo  49 Harald Grallert  99   120   121 Benjamin Glaser  166 Andres Metspalu  108 Nicholas J Wareham  10 Mark Walker  167 Eric Banks  4 Christian Gieger  22   120   121 Erik Ingelsson  6   168 Hae Kyung Im  27 Thomas Illig  121   169   170 Paul W Franks  35   129   133 Gemma Buck  134 Joseph Trakalo  134 David Buck  134 Inga Prokopenko  6   12   163 Reedik Mägi  108 Lars Lind  171 Yossi Farjoun  172 Katharine R Owen  12   127 Anna L Gloyn  6   12   127 Konstantin Strauch  22   24 Tiinamaija Tuomi  104   112   113   173 Jaspal Singh Kooner  45   61   174 Jong-Young Lee  32 Taesung Park  28   41 Peter Donnelly  6   8 Andrew D Morris  175   176 Andrew T Hattersley  177 Donald W Bowden  53   54   55 Francis S Collins  19 Gil Atzmon  46   178 John C Chambers  44   45   174 Timothy D Spector  11 Markku Laakso  51   52 Tim M Strom  96   179 Graeme I Bell  180 John Blangero  82 Ravindranath Duggirala  83 E Shyong Tai  30   76   181 Gilean McVean  6   182 Craig L Hanis  29 James G Wilson  183 Mark Seielstad  184   185 Timothy M Frayling  9 James B Meigs  186 Nancy J Cox  27 Rob Sladek  15   42   187 Eric S Lander  188 Stacey Gabriel  4 Noël P Burtt  4 Karen L Mohlke  189 Thomas Meitinger  96   179 Leif Groop  97   173 Goncalo Abecasis  1 Jose C Florez  4   64   190   191 Laura J Scott  1 Andrew P Morris  6   108   192 Hyun Min Kang  1 Michael Boehnke  1 David Altshuler  4   5   109   190   191   193 Mark I McCarthy  6   12   127
Affiliations

The genetic architecture of type 2 diabetes

Christian Fuchsberger et al. Nature. .

Abstract

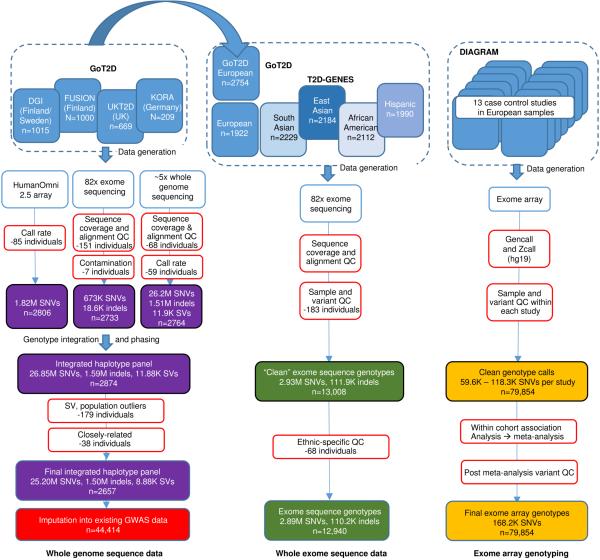
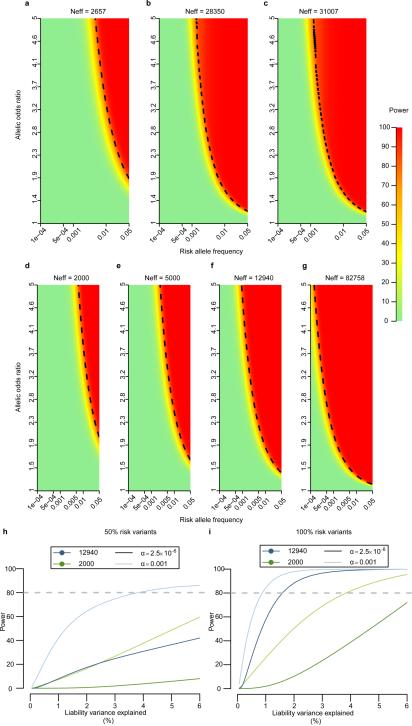
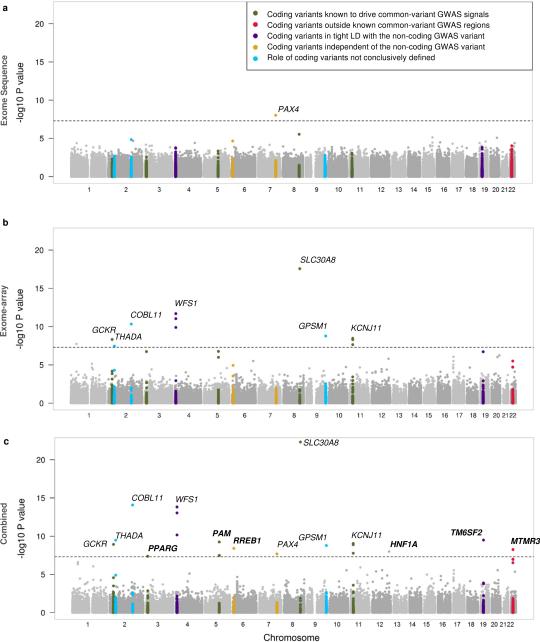
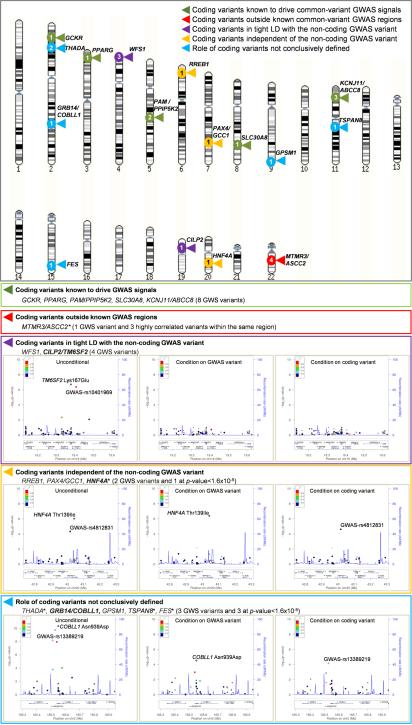
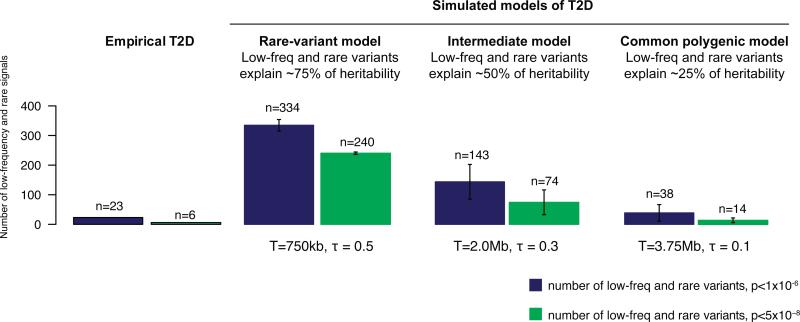
The genetic architecture of common traits, including the number, frequency, and effect sizes of inherited variants that contribute to individual risk, has been long debated. Genome-wide association studies have identified scores of common variants associated with type 2 diabetes, but in aggregate, these explain only a fraction of the heritability of this disease. Here, to test the hypothesis that lower-frequency variants explain much of the remainder, the GoT2D and T2D-GENES consortia performed whole-genome sequencing in 2,657 European individuals with and without diabetes, and exome sequencing in 12,940 individuals from five ancestry groups. To increase statistical power, we expanded the sample size via genotyping and imputation in a further 111,548 subjects. Variants associated with type 2 diabetes after sequencing were overwhelmingly common and most fell within regions previously identified by genome-wide association studies. Comprehensive enumeration of sequence variation is necessary to identify functional alleles that provide important clues to disease pathophysiology, but large-scale sequencing does not support the idea that lower-frequency variants have a major role in predisposition to type 2 diabetes.


Figures

Extended Data Figure 1
Extended Data Figure 1. Summary of samples and quality control procedures
This figure summarises data generation for whole genome sequencing (GoT2D), exome sequencing (GoT2D and T2D-GENES) and exome array genotyping (DIAGRAM). In addition, GoT2D whole genome sequence data was imputed into GWAS data from 44,414 subjects of European descent.
Extended Data Figure 4
Extended Data Figure 4. Power for single and aggregate variant association
a-g. Power to detect single-variant association (α=5×10⁻⁸) at varying minor allele frequency (x-axis) and allelic odds-ratio (y-axis) for seven effective sample size (Neff) scenarios relevant to the genomes (a-c) and exomes (dg) component of this project. a. variant observed in 2,657 samples (the effective size of the GoT2D integrated panel); b. variant observed in 28,350 samples (the effective size of the imputed data set); c. variant observed in the GoT2D integrated panel and the imputed data set (effective sample size 31,007); d. ancestry-specific variant in 2,000 samples (the size of each of the non-European exome sequence data sets); e. European specific variant in 5,000 samples (the combined size of the European exome sequence data sets); f. variant observed with shared frequency across all ancestry groups in 12,940 samples (the size of the combined exome sequence data set); and g. variant observed in the combined exome array and sequencing data set (effective sample size 82,758). h-i. Power for gene based test of association (SKAT-O) according to liability variance explained. In h, 50% of the variants contribute to disease risk while the remaining 50% have no effect on disease risk; in i., 100% of the variants contribute to disease risk. For each, sample sizes considered are 2,000 (ancestry-specific effects; green) and 12,940 (ancestry-shared effects; blue). Power is shown for two levels of significance (α=2.5×10⁻⁶ and α=0.001). From these simulation studies, it is clear that under the optimistic model, where effects are shared across all ethnicities (blue line) and all variants contribute, power is >60% for 1% variance explained and α=2.5×10⁻⁶. However, power declines rapidly if either criterion is relaxed.
Extended Data Figure 6
Extended Data Figure 6. Single variant analyses
Manhattan plot of single-variant analyses generated from a. exome sequence data in 6,504 cases and 6,436 controls of African American, East Asian, European, Hispanic, and South Asian ancestry; b. exome array genotypes in 28,305 cases and 51,549 controls of European ancestry; and c. combined meta-analysis of exome array and exome sequence samples. Coding variants are categorized according to their relationships to the previously reported lead variant from GWAS region. Loci achieving genome-wide significance only in the combined analysis are highlighted in bold. The HNF1A variant reaching genome-wide significance in the combined analysis is a synonymous variant (Thr515Thr). The dashed horizontal line in each panel designates the threshold for genome-wide significance (p<5×10⁻⁸).
Extended Data Figure 7
Extended Data Figure 7. Classification of coding variants according to their relationship to reported lead variants for each GWAS region
The ideogram shows the location of 25 coding variant associations at 16 loci described in the text. The number in each circle corresponds to the number of associated variants at each locus. Variants are grouped into five categories based on inferred relationship with the GWAS lead variant. For some of these categories, the figure includes representative regional association plots based on exome array meta-analysis data from 28,305 cases and 51,549 controls. The locus displayed for each category is designated in bold. The first plot in each panel shows the unconditional association results; middle plot the association results after conditioning on the non-coding GWAS SNP; and the last plot the results after conditioning on the most significantly associated coding variant. Each point represents a SNP in the exome array meta-analysis, plotted with their p-value (on a –log10 scale) as a function of the genomic position (hg19). In each panel, the lead coding variant is represented by the purple symbol. The color-coding of all other SNPs indicates LD with the lead SNP (estimated by European r2 from 1000 Genomes March 2012 reference panel: red r2≥0.8; gold 0.6≤r2<0.8; green 0.4≤r2<0.6; cyan 0.2≤r2<0.4; blue r2<0.2; grey r2unknown). Gene annotations are taken from the University of California Santa Cruz genome browser. GWS: genome-wide significance. *Seven variants, three at ASCC2, and one each at THADA, TSPAN8, FES and HNF4A did not achieve genome-wide significance themselves, but are included because they fall into genes and/or regions with other significant association signals (see text).
Extended Data Figure 9
Extended Data Figure 9. Exclusion of synthetic associations and construction of credible causal variant sets at T2D GWAS loci
Ten T2D GWAS loci were selected for synthetic association testing (p<0.001; Methods). a, The effect size observed at the GWAS index SNV (sequence data) before (navy blue) and after (light blue, grey) conditioning on candidate rare and low-frequency (MAF<5%) variants which could produce synthetic association. b, Example of synthetic association exclusion at the TCF7L2 locus. c, Credible sets for T2D GWAS loci where credible set consisted of <80 variants displaying the proportion of credible set variants present in the HapMap and 1000G catalogs.
Extended Data Figure 10
Genome enrichment analysis in GoT2D whole genome sequence data (n=2,657) a, Functional annotation categories were defined using transcription, chromatin state and transcription factor binding data from GENCODE, ENCODE and other studies. b, T2D association statistics for variants at each T2D locus were jointly modelled with functional annotation using fgwas. In the resulting model we identified enrichment of coding exons (CDS), transcription factor binding sites (TFBS), mature adipose active enhancers and promoters (hASC-t4 EnhA, TssA), pancreatic islet active and weak enhancers (HI EnhA, EnhWk), pre-adipose active and weak enhancers (hASC-t1 EnhA, EnhWk), embryonic stem cell active promoters (H1-hESC TssA) and 5’ UTR. Dots represent enrichment estimates and horizontal lines the 95% confidence intervals. c, At the CCND2 locus, three variants not present in HapMap2 have a combined 90% posterior probability of being causal (rs4238013, rs3217801, rs73040004). One of these variants, rs3217801, is a 2-bp indel that overlaps an islet enhancer element.
Extended Data Figure 11
Extended Data Figure 11. Low frequency variants in exome array data
Results from meta-analysis of 43,045 low-frequency and common coding variants on the exome array (assayed in 79,854 European subjects). a. Observed allelic ORs as a property of allele MAF. Variants missing in >8 cohorts or polymorphic in only one cohort were excluded. Colored lines represent contours for liability variance explained. Regions shaded grey denote ranges of OR and MAF consistent with 80% power (in this case, at α=5×10⁻⁷) to detect single-variant associations in this data set (given the observed range of missing data). Variants with a black collar are those highlighted by a bounding analysis as having a probability>0.8 of having LVE>0.1%; b. Distribution of each variant in the MAF/OR space was computed by assuming T2D prevalence of 8% and a beta and normal distribution for MAF and OR respectively. Probability is obtained by integrating the joint MAF-OR distributions over ranges of LVE; c. Single variant association, liability and bounding results for the known T2D GWAS variants on the exome array (Methods).
Figure 1
Figure 1. Ascertainment of variants and single-variant results
a, Sensitivity of low-coverage genome sequence data to detect SNVs in the deep exome sequence data, relative to other variant catalogs. Points represent results for a specific minor allele count. All results assume OR=1 for all variants, unless stated otherwise. Manhattan plots of single-variant association analyses for: b, sequence data alone (1,326 cases and 1,331 controls) and c, meta-analysis of sequence and imputed data (total of 14,297 cases and 32,774 controls).
Figure 2
Figure 2. Association between T2D and variants in genes for Mendelian forms of diabetes
a, p-values of aggregate association for variants from 6,504 T2D cases and 6,436 controls in three sets of Mendelian diabetes genes, for five variant “masks” (Methods). Dotted line: p=0.05. b, Estimated T2D odds ratio (OR) for carriers of variants in each gene-set and mask. Error bars: one standard error. c, Estimated ORs (bars, left axis) and p-values (dots, right axis) for carriers of variants in the PTV+NSstrict mask for each gene. Error bars: one standard error. Red: OR > 1; blue: OR < 1; dotted line: p=0.05.
Figure 3
Figure 3. Empirical T2D association results compared to results under different simulated disease models
Observed number of rare and low-frequency (MAF<5%) genetic association signals for T2D detected genome-wide after imputation compared to the numbers seen under three simulated disease models for T2D which were plausible given results (T2D recurrence risks, GWAS, linkage) prior to large-scale sequencing. Simulated models were defined by two parameters: disease target size T and degree of coupling τ between the causal effects of variants and the selective pressure against them. Simulated data were generated to match GoT2D imputation quality as a function of MAF (Methods).

Comment in

References

    1. Willemsen G, et al. The concordance and heritability of type 2 diabetes in 34,166 Twin Pairs From International Twin Registers: The Discordant Twin (DISCOTWIN) Consortium. Twin Res Hum Genet. 2015;18:762–71. - PubMed
    1. Morris AP, et al. Large-scale association analysis provides insights into the genetic architecture and pathophysiology of type 2 diabetes. Nat Genet. 2012;44:981–90. - PMC - PubMed
    1. Mahajan A, et al. Genome-wide trans-ancestry meta-analysis provides insight into the genetic architecture of type 2 diabetes susceptibility. Nat Genet. 2014;46:234–44. - PMC - PubMed
    1. Voight BF, et al. Twelve type 2 diabetes susceptibility loci identified through large-scale association analysis. Nat Genet. 2010;42:579–89. - PMC - PubMed
    1. Kooner JS, et al. Genome-wide association study in individuals of South Asian ancestry identifies six new type 2 diabetes susceptibility loci. Nat Genet. 2011;43:984–9. - PMC - PubMed

EXTENDED METHODS REFERENCES

    1. Guey LT, et al. Power in the phenotypic extremes: a simulation study of power in discovery and replication of rare variants. Genet Epidemiol. 2011;35:236–46. - PubMed
    1. Li H, Durbin R. Fast and accurate short read alignment with Burrows-Wheeler transform. Bioinformatics. 2009;25:1754–60. - PMC - PubMed
    1. DePristo MA, et al. A framework for variation discovery and genotyping using next-generation DNA sequencing data. Nat Genet. 2011;43:491–8. - PMC - PubMed
    1. McKenna A, et al. The Genome Analysis Toolkit: a MapReduce framework for analyzing next-generation DNA sequencing data. Genome Res. 2010;20:1297–303. - PMC - PubMed
    1. Jun G, et al. Detecting and estimating contamination of human DNA samples in sequencing and array-based genotype data. Am J Hum Genet. 2012;91:839–48. - PMC - PubMed

Publication types

Grants and funding