. 2016 Jul 11;11(7):e0159267.
doi: 10.1371/journal.pone.0159267. eCollection 2016.

Empirical Evidence of Study Design Biases in Randomized Trials: Systematic Review of Meta-Epidemiological Studies

Affiliations

Empirical Evidence of Study Design Biases in Randomized Trials: Systematic Review of Meta-Epidemiological Studies

Matthew J Page et al. PLoS One. .

Abstract

Objective: To synthesise evidence on the average bias and heterogeneity associated with reported methodological features of randomized trials.

Design: Systematic review of meta-epidemiological studies.

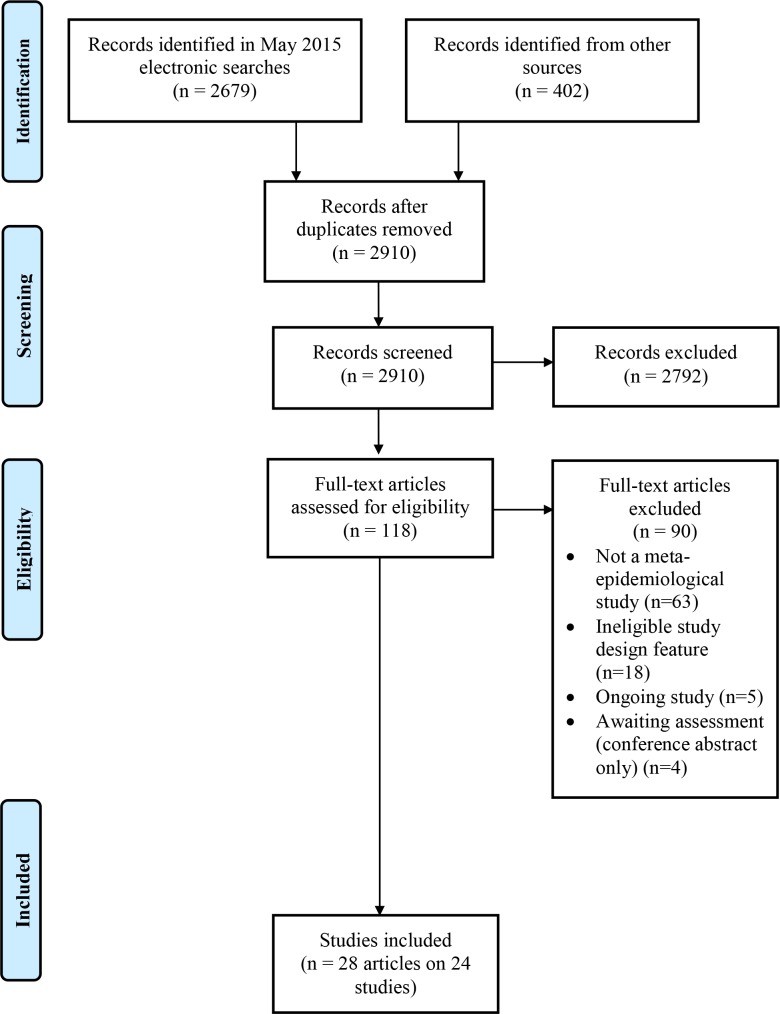
Methods: We retrieved eligible studies included in a recent AHRQ-EPC review on this topic (latest search September 2012), and searched Ovid MEDLINE and Ovid EMBASE for studies indexed from Jan 2012-May 2015. Data were extracted by one author and verified by another. We combined estimates of average bias (e.g. ratio of odds ratios (ROR) or difference in standardised mean differences (dSMD)) in meta-analyses using the random-effects model. Analyses were stratified by type of outcome ("mortality" versus "other objective" versus "subjective"). Direction of effect was standardised so that ROR < 1 and dSMD < 0 denotes a larger intervention effect estimate in trials with an inadequate or unclear (versus adequate) characteristic.

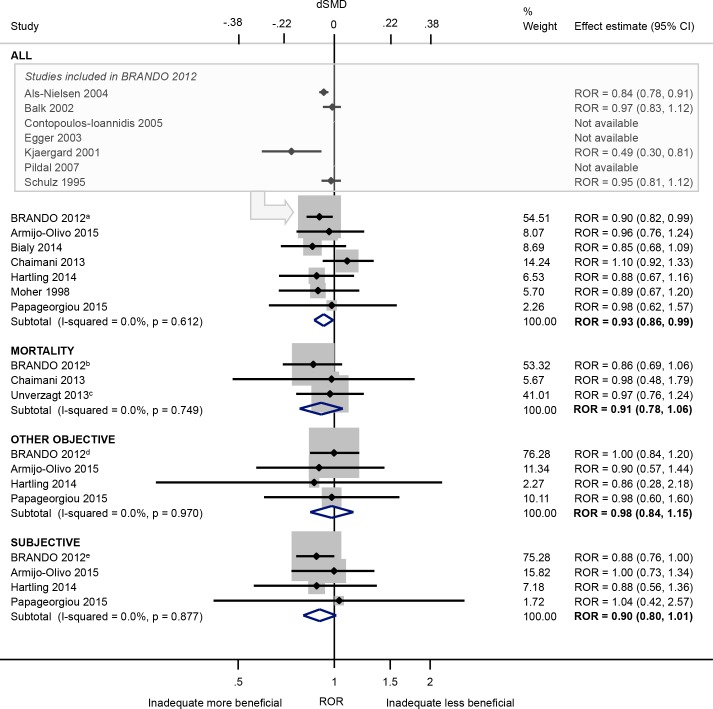
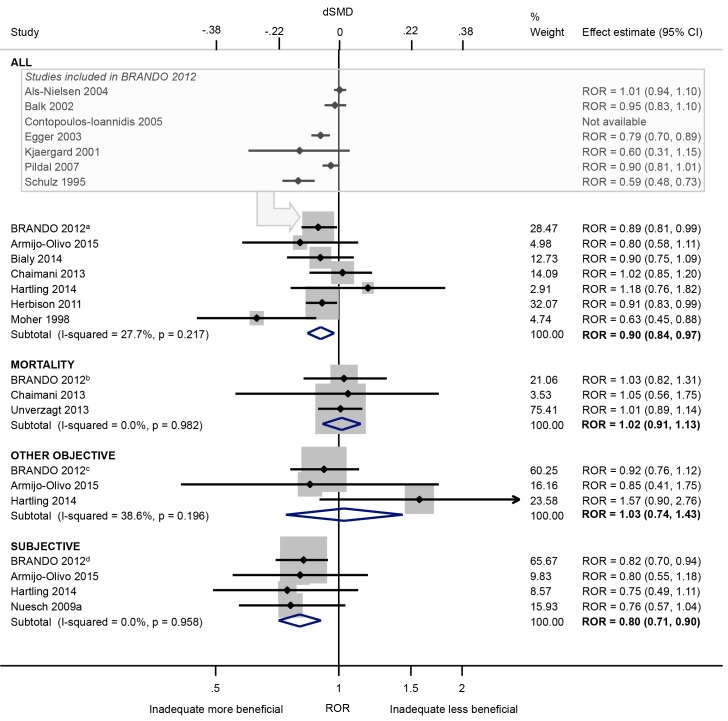
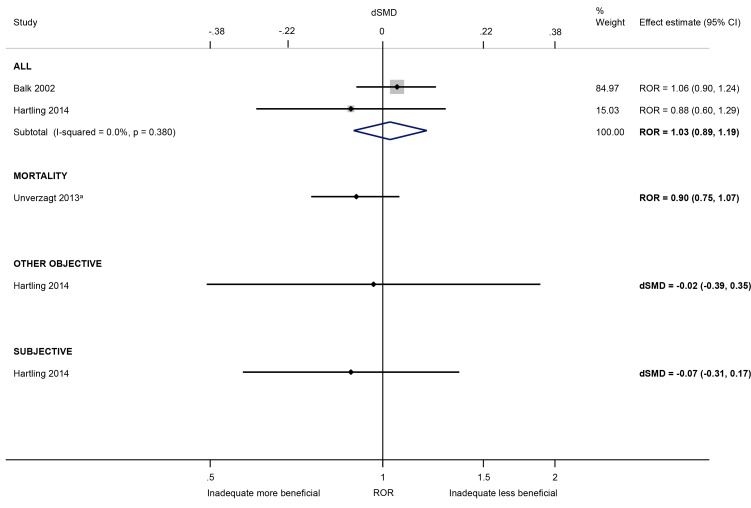
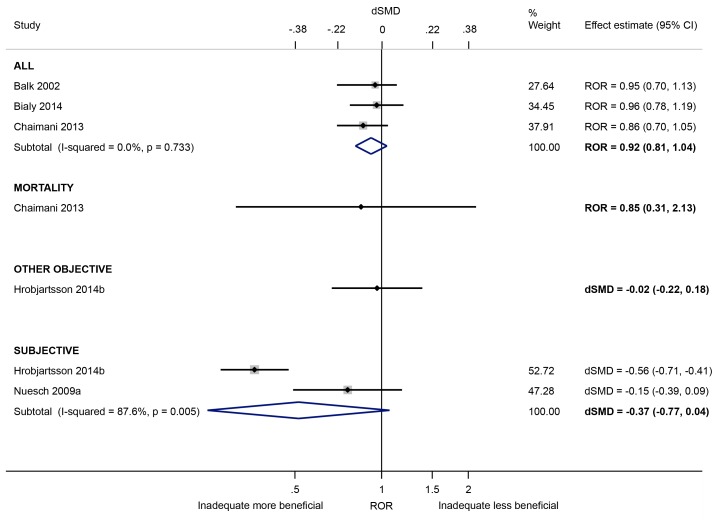
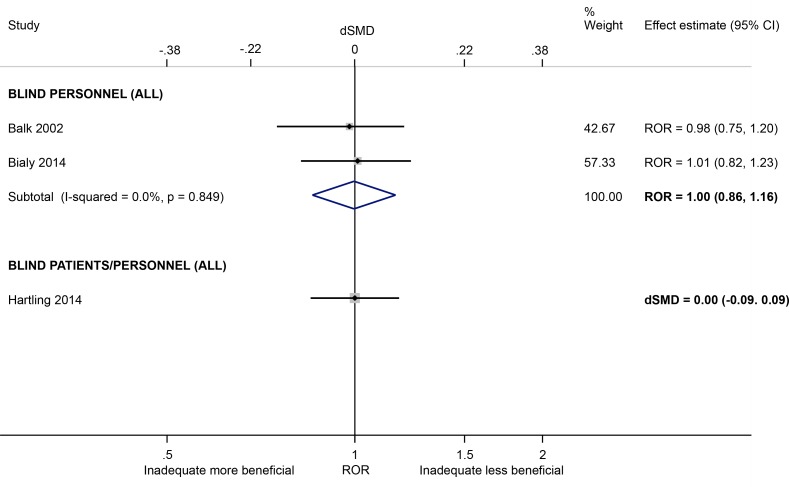
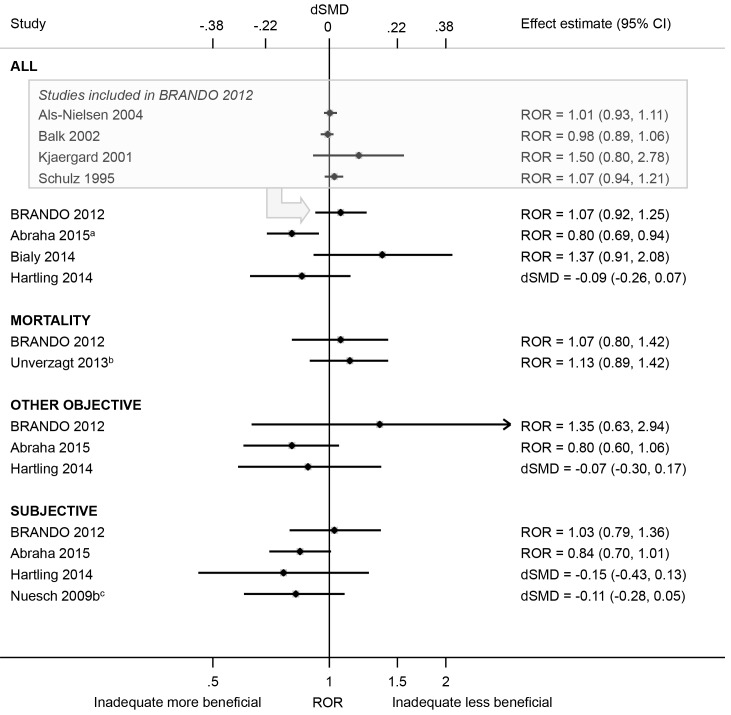
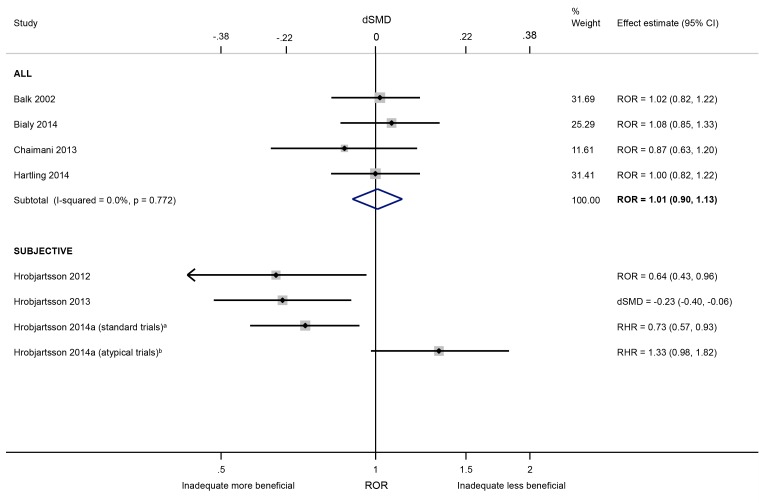
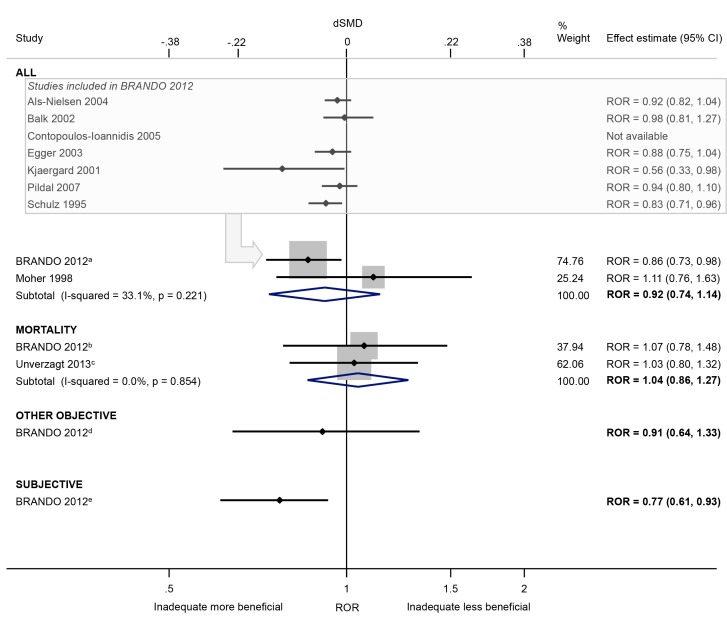
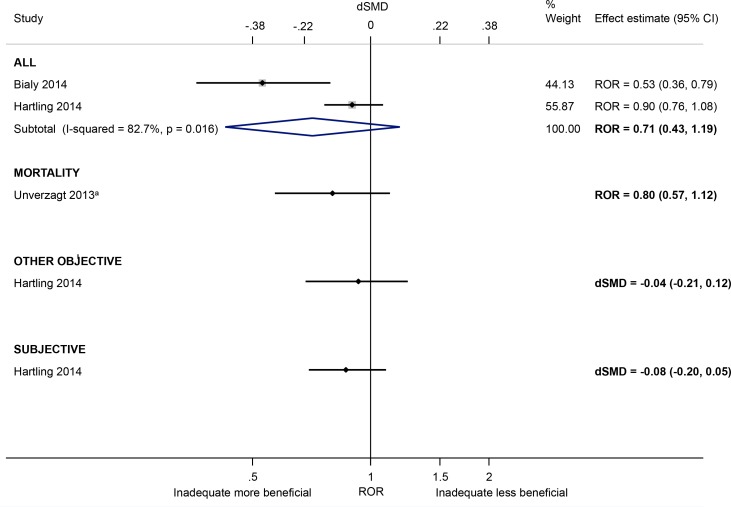
Results: We included 24 studies. The available evidence suggests that intervention effect estimates may be exaggerated in trials with inadequate/unclear (versus adequate) sequence generation (ROR 0.93, 95% CI 0.86 to 0.99; 7 studies) and allocation concealment (ROR 0.90, 95% CI 0.84 to 0.97; 7 studies). For these characteristics, the average bias appeared to be larger in trials of subjective outcomes compared with other objective outcomes. Also, intervention effects for subjective outcomes appear to be exaggerated in trials with lack of/unclear blinding of participants (versus blinding) (dSMD -0.37, 95% CI -0.77 to 0.04; 2 studies), lack of/unclear blinding of outcome assessors (ROR 0.64, 95% CI 0.43 to 0.96; 1 study) and lack of/unclear double blinding (ROR 0.77, 95% CI 0.61 to 0.93; 1 study). The influence of other characteristics (e.g. unblinded trial personnel, attrition) is unclear.

Conclusions: Certain characteristics of randomized trials may exaggerate intervention effect estimates. The average bias appears to be greatest in trials of subjective outcomes. More research on several characteristics, particularly attrition and selective reporting, is needed.


Conflict of interest statement

Competing Interests: JACS, AB and JS are authors of a study included in this review, but were not involved in the eligibility assessment or data extraction of these studies. This does not alter the authors' adherence to PLOS ONE policies on sharing data and materials. All other authors declare no competing interests.

Figures

Fig 1
Fig 1. Conceptual framework that underlies the Cochrane risk of bias tool for RCTs.
Letters A-E denote the sources of bias listed in Table 1.
Fig 2
Fig 2. Flow diagram of identification, screening, and inclusion of trials.
Fig 3
Fig 3. Random-effects meta-analysis of RORs associated with inadequate/unclear (versus adequate) sequence generation.
The boxed section displays the average bias estimates, where available, from the seven meta-epidemiological studies contributing to the BRANDO 2012a study (however only the BRANDO 2012a ROR was included in our meta-analysis). The BRANDO 2012a ROR is based on a multivariable analysis with adjustment for allocation concealment and double blinding [the corresponding univariable ROR is (95% CrI) 0.89 (0.82, 0.96)]. The BRANDO 2012b ROR is based on a multivariable analysis with adjustment for allocation concealment and double blinding [the corresponding univariable ROR (95% CrI) is 0.89 (0.75, 1.05)]. The Unverzagt 2013c ROR is based on a multivariable analysis with adjustment for allocation concealment, double blinding, attrition, selective outcome reporting, early stopping, pre-intervention, competing interests, baseline imbalance, switching interventions, sufficient follow-up, and single- versus multi-centre status [the corresponding univariable ROR (95% CI) is 0.98 (0.8, 1.21)]. The BRANDO 2012d ROR is based on a multivariable analysis with adjustment for allocation concealment and double blinding [the corresponding univariable ROR (95% CrI) is 0.99 (0.84, 1.16)]. The BRANDO 2012e ROR is based on a multivariable analysis with adjustment for allocation concealment and double blinding [the corresponding univariable ROR (95% CrI) is 0.83 (0.74, 0.94)].
Fig 4
Fig 4. Random-effects meta-analysis of RORs associated with inadequate/unclear (versus adequate) allocation concealment.
The boxed section displays the average bias estimates, where available, from the seven meta-epidemiological studies contributing to the BRANDO 2012a study (however only the BRANDO 2012a ROR was included in our meta-analysis). The BRANDO 2012a ROR is based on a multivariable analysis with adjustment for sequence generation and double blinding [the corresponding univariable ROR (95% CrI) is 0.93 (0.87, 0.99)]. The BRANDO 2012b ROR is based on a multivariable analysis with adjustment for sequence generation and double blinding [the corresponding univariable ROR (95% CrI) is 0.98 (0.88, 1.10)]. The BRANDO 2012c ROR is based on a multivariable analysis with adjustment for sequence generation and double blinding [the corresponding univariable ROR (95% CrI) is 0.97 (0.85, 1.10)]. The BRANDO 2012d ROR is based on a multivariable analysis with adjustment for sequence generation and double blinding [the corresponding univariable ROR (95% CrI) is 0.85 (0.75, 0.95)].
Fig 5
Fig 5. Random-effects meta-analysis of RORs and dSMDs associated with presence (versus absence) of baseline imbalance.
The Unverzagt 2013a ROR is based on a multivariable analysis with adjustment for sequence generation, allocation concealment, double blinding, attrition, selective outcome reporting, early stopping, pre-intervention, competing interests, switching interventions, sufficient follow-up, and single- versus multi-centre status [the corresponding univariable ROR (95% CI) is 0.92 (0.80, 1.06)].
Fig 6
Fig 6. Random-effects meta-analysis of RORs and dSMDs associated with lack of/unclear blinding of participants (versus blinding of participants).
Fig 7
Fig 7. Random-effects meta-analysis of RORs and dSMDs associated with lack of/unclear blinding of personnel or participants/personnel (versus blinding of either party).
Fig 8
Fig 8. Estimated RORs and dSMDs associated with any (versus no or minimal) attrition.
The boxed section displays the average bias estimates, where available, from the four meta-epidemiological studies contributing to the BRANDO 2012 study. The Abraha 2015a ROR is based on a multivariable analysis with adjustment for use of placebo comparison, sample size, type of centre, items of risk of bias, post-randomisation exclusions, funding, and publication bias [the corresponding univariable ROR (95% CI) is 0.83 (0.71, 0.97)]. The Unverzagt 2013b ROR is based on a multivariable analysis with adjustment for sequence generation, allocation concealment, double blinding, selective outcome reporting, early stopping, pre-intervention, competing interests, baseline imbalance, switching interventions, sufficient follow-up, and single- versus multi-centre status [the corresponding univariable ROR (95% CI) is 1.19 (0.98, 1.45)]. The Nuesch 2009bc dSMD is based on a multivariable analysis with adjustment for allocation concealment [the corresponding multivariable dSMD (95% CI) with adjustment for blinding of participants is -0.15 (-0.30, 0.00), and the corresponding univariable dSMD (95% CI) is -0.13 (-0.29, 0.04)].
Fig 9
Fig 9. Random-effects meta-analysis of RORs and dSMDs associated with lack of/unclear blinding of outcome assessors (versus blinding of outcome assessors).
RHR = Ratio of hazard ratios. Hróbjartsson 2014aa “standard trials” comprise those comparing experimental interventions with standard control interventions, such as placebo, no-treatment, usual care or active control. Hróbjartsson 2014ab “atypical trials” comprise those comparing an oral experimental administration of a drug with the intravenous control administration of the same drug for cytomegalovirus retinitis.
Fig 10
Fig 10. Random-effects meta-analysis of RORs associated with lack of/unclear double blinding (versus double blinding).
The boxed section displays the average bias estimates, where available, from the seven meta-epidemiological studies contributing to the BRANDO 2012a study (however only the BRANDO 2012a ROR was included in our meta-analysis). The BRANDO 2012a ROR is based on a multivariable analysis with adjustment for sequence generation and allocation concealment [the corresponding univariable ROR (95% CrI) is 0.87 (0.79, 0.96)]. The BRANDO 2012b ROR is based on a multivariable analysis with adjustment for sequence generation and allocation concealment [the corresponding univariable ROR (95% CrI) is 0.92 (0.80, 1.04)]. The Unverzagt 2013c ROR is based on a multivariable analysis with adjustment for sequence generation, allocation concealment, attrition, selective outcome reporting, early stopping, pre-intervention, competing interests, baseline imbalance, switching interventions, sufficient follow-up, and single- versus multi-centre status [the corresponding univariable ROR (95% CI) is 0.84 (0.69, 1.02)]. The BRANDO 2012d ROR is based on a multivariable analysis with adjustment for sequence generation and allocation concealment [the corresponding univariable ROR (95% CrI) is 0.93 (0.74, 1.18)]. The BRANDO 2012e ROR is based on a multivariable analysis with adjustment for sequence generation and allocation concealment [the corresponding univariable ROR (95% CrI) is 0.78 (0.65, 0.92)].
Fig 11
Fig 11. Random-effects meta-analysis of RORs and dSMDs associated with high/unclear (versus low) risk of bias due to selective reporting.
The Unverzagt 2013a ROR is based on a multivariable analysis with adjustment for sequence generation, allocation concealment, double blinding, attrition, early stopping, pre-intervention, competing interests, baseline imbalance, switching interventions, sufficient follow-up, and single- versus multi-centre status [the corresponding univariable ROR (95% CI) is 0.73 (0.54, 0.98)].

References

    1. Guyatt G, Cairns J, Churchill D, Cook D, Haynes B, Hirsh J, et al. Evidence-based medicine: A new approach to teaching the practice of medicine. JAMA. 1992;268(17):2420–5. - PubMed
    1. NHMRC. How to use the evidence: assessment and application of scientific evidence Canberra, Australia: National Health and Medical Research Council; 2000.
    1. OCEBM Levels of Evidence Working Group. "The Oxford 2011 Levels of Evidence". Oxford Centre for Evidence-Based Medicine; Available: http://www.cebm.net/index.aspx?o=5653.
    1. Higgins JPT, Altman DG, Sterne JAC. Chapter 8: Assessing risk of bias in included studies In: Higgins JPT, Green S, editors. Cochrane Handbook for Systematic Reviews of Interventions Version 5.1.0 [updated March 2011]. The Cochrane Collaboration, 2011. Available: www.cochrane-handbook.org.
    1. Schulz KF, Chalmers I, Hayes RJ, Altman DG. Empirical evidence of bias. Dimensions of methodological quality associated with estimates of treatment effects in controlled trials. JAMA. 1995;273(5):408–12. - PubMed

Publication types

LinkOut - more resources