. 2016 Aug;23(8):744-51.
doi: 10.1038/nsmb.3262. Epub 2016 Jul 11.

Lipids modulate the conformational dynamics of a secondary multidrug transporter

Affiliations

Lipids modulate the conformational dynamics of a secondary multidrug transporter

Chloé Martens et al. Nat Struct Mol Biol. 2016 Aug.

Abstract

Direct interactions with lipids have emerged as key determinants of the folding, structure and function of membrane proteins, but an understanding of how lipids modulate protein dynamics is still lacking. Here, we systematically explored the effects of lipids on the conformational dynamics of the proton-powered multidrug transporter LmrP from Lactococcus lactis, using the pattern of distances between spin-label pairs previously shown to report on alternating access of the protein. We uncovered, at the molecular level, how the lipid headgroups shape the conformational-energy landscape of the transporter. The model emerging from our data suggests a direct interaction between lipid headgroups and a conserved motif of charged residues that control the conformational equilibrium through an interplay of electrostatic interactions within the protein. Together, our data lay the foundation for a comprehensive model of secondary multidrug transport in lipid bilayers.


Figures

Figure 1
Figure 1. Ligand-dependent conformational changes of LmrP in nanodiscs
(a,b) DEER distance distributions for spin labeled cysteine pairs between the N- and C-lobes located on the extracellular (a) and cytoplasmic (b) ends of TM helices, obtained at pH8 (black), pH6 (red) and pH8 + 1mM Hoechst 33342 (blue). Distributions were normalized: r indicates interspin distance; P(r) indicates the distance probability, asterisks denote peaks resulting from partial aggregation observed in some samples upon concentration (see Methods). The closing or opening upon ligand binding is indicated by colored arrows (red: proton binding, blue: Hoechst 33342 binding) with targeted helices in orange. Left: LmrP homology model with cysteine pairs highlighted in red, connected by a line, with TM numbers indicated on top - view from the extracellular (a) or cytoplasmic (b) side. The N-lobe is colored blue and the C-lobe is colored grey. Source data for graphs are available online.
Figure 2
Figure 2. The lipid environment favors the inward-open conformation
DEER distance distributions of the 160R1-310R1 and the 137R1-349R1 pairs, used as extracellular (left) and cytoplasmic (right) reporters, respectively. Top: mutants reconstituted in E.coli polar lipids nanodiscs, at pH values ranging from pH5 to pH8.5 in 0.5 unit increments. Bottom: mutants in detergent micelles, at pH values ranging from pH4.5 to pH8 in 0.5 unit increments. Source data for graphs are available online.
Figure 3
Figure 3. The lipid environment increases the pK of LmrP conformational transition
The fraction of the inward-open component(s) of the distance distributions for the extracellular reporter (160R1-310R1, left) and cytoplasmic reporter (137R1-349R1, right), as determined by global analysis of the raw data, is plotted as a function of pH and fitted with a sigmoidal dose-response curve. The top and bottom panels represent the pH-dependence of the distance distribution in nanodiscs and detergent micelles, respectively. Source data for graphs are available online.
Figure 4
Figure 4. Disruption of the charge-relay network favors the inward-open conformation in nanodiscs
(a) Crystal structure of the LmrP homolog YajR in the outward-open conformation. The charge-relay network of conserved residues is highlighted. TM2 and TM11 are displayed in orange. The cytoplasmic domain of YajR was removed for clarity. (b,c) Single mutations D68N, R72K and D128N combined with extracellular (b) (160R1-310R1) and cytoplasmic (c) (137R1-349R1) reporters. DEER measurements carried out at pH6 (red), pH8 (black), and pH8 + Hoechst 33342 (blue) in the absence (dashed line) and presence (solid line) of each mutation. (d) ΔG° of the conformational transition for the extracellular reporter (160R1-310R1, left) and cytoplasmic reporter (137R1-349R1, right), as a function of the environment (blue: E.coli polar lipids nanodiscs - white: β-DDM detergent). See methods for calculation of ΔG° and associated errors. The error bars are obtained by propagating the fit errors for the amplitude of the individual components of the distance distributions. Source data for graphs are available online.
Figure 5
Figure 5. Differences in the fatty acid chain length and structure cause minor changes of the conformational equilibrium
DEER distance distributions of the 160R1-310R1 and the 137R1-349R1 pairs, used as extracellular (left) and cytoplasmic (right) distance reporters, respectively. Distance distributions at pH8 (black), pH6 (red), pH8 + Hoechst 33342 (blue) in (a) E.coli polar lipid extract, (b) combination of PE, PG and CL extracts of E.coli, and (c) combination of synthetic DOPE, DOPG and CL. Source data for graphs are available online.
Figure 6
Figure 6. Incremental methylation of phosphatidylethanolamine headgroup stabilizes the outward-open conformation
(a,b) ΔG° of the transition as a function of the pH and the lipid composition. (a) extracellular distance reporter 160R1-310R1. (b) cytoplasmic distance reporter 137R1-349R1. In order of decreasing ΔG° values: DOPE-DOPG-CL (grey)> DOPE(Me)2-DOPG-CL (blue) > DOPC-DOPG-CL (orange). See methods for calculation of ΔG° and associated errors. The error bars are obtained by propagating the fit errors for the amplitude of the individual components of the distance distributions. Source data for graphs are available online.
Figure 7
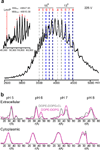
Figure 7. Cardiolipin binds to LmrP with high-affinity and highlights conformational decoupling between the two sides of the transporter
(a) Positive mode nano-ESI MS. Although a charge state distribution from 11+ to 17+ is observed, only the 13+ and 15+ peaks are indicated for clarity by dotted lines representing the theoretical m/z values, with red numbers corresponding to the number of cardiolipin molecules bound. The inset shows the deconvoluted mass spectrum with up to eight CL bound. The red dotted line indicates the mass of free LmrP. (b) distance distributions of the extracellular 160R1-310R1 (top panels) and cytoplasmic 137R1-349R1 (bottom panels) reporters reconstituted in nanodisc with (grey) and without (pink) 10% CL. Source data for graphs are available online.

References

    1. Singer SJ, Nicolson GL. The fluid mosaic model of the structure of cell membranes. Science. 1972;175:720–731. - PubMed
    1. Heijne G. The distribution of positively charged residues in bacterial inner membrane proteins correlates with the trans-membrane topology. EMBO J. 1986;5:3021–3027. - PMC - PubMed
    1. Cantor RS. The influence of membrane lateral pressures on simple geometric models of protein conformational equilibria. Chem Phys Lipids. 1999;101:45–56. - PubMed
    1. Powl AM, East JM, Lee AG. Anionic phospholipids affect the rate and extent of flux through the mechanosensitive channel of large conductance MscL. Biochemistry. 2008;47:4317–4328. - PMC - PubMed
    1. Phillips R, Ursell T, Wiggins P, Sens P. Emerging roles for lipids in shaping membrane-protein function. Nature. 2009;459:379–385. - PMC - PubMed

References for Online Methods

    1. Yin Y, He X, Szewczyk P, Nguyen T, Chang G. Structure of the multidrug transporter EmrD from Escherichia coli. Science. 2006;312:741–744. - PMC - PubMed
    1. Guan L, Mirza O, Verner G, Iwata S, Kaback HR. Structural determination of wild-type lactose permease. Proc Natl Acad Sci U S A. 2007;104:15294–15298. - PMC - PubMed
    1. Dang S, et al. Structure of a fucose transporter in an outward-open conformation. Nature. 2010;467:734–738. - PubMed
    1. Thompson JD, Higgins DG, Gibson TJ. CLUSTAL W: improving the sensitivity of progressive multiple sequence alignment through sequence weighting, position-specific gap penalties and weight matrix choice. Nucleic Acids Res. 1994;22:4673–4680. - PMC - PubMed
    1. Webb B, Sali A. Comparative Protein Structure Modeling Using MODELLER. Curr Protoc Bioinformatics. 2014;47:561–556. - PubMed