. 2016 Jul 11;12(7):e1005732.
doi: 10.1371/journal.ppat.1005732. eCollection 2016 Jul.

Genetic Architecture of Group A Streptococcal Necrotizing Soft Tissue Infections in the Mouse

Affiliations

Genetic Architecture of Group A Streptococcal Necrotizing Soft Tissue Infections in the Mouse

Karthickeyan Chella Krishnan et al. PLoS Pathog. .

Abstract

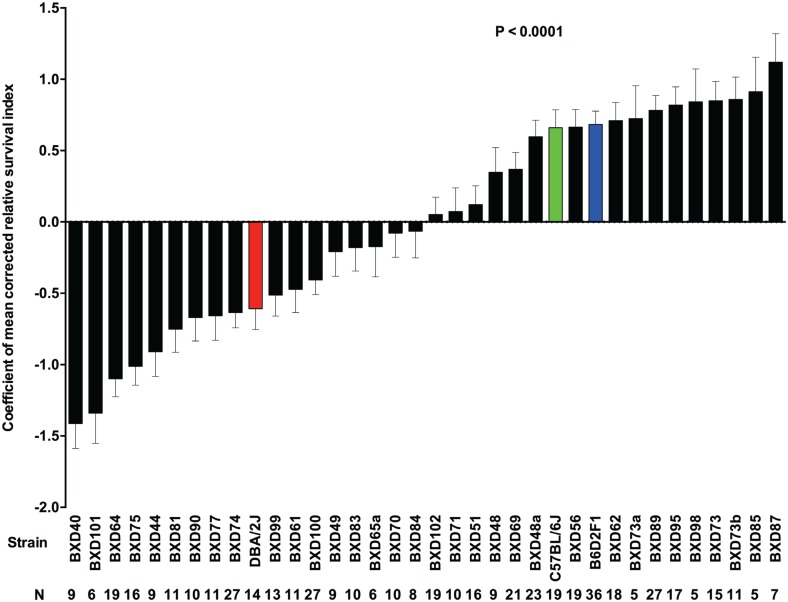
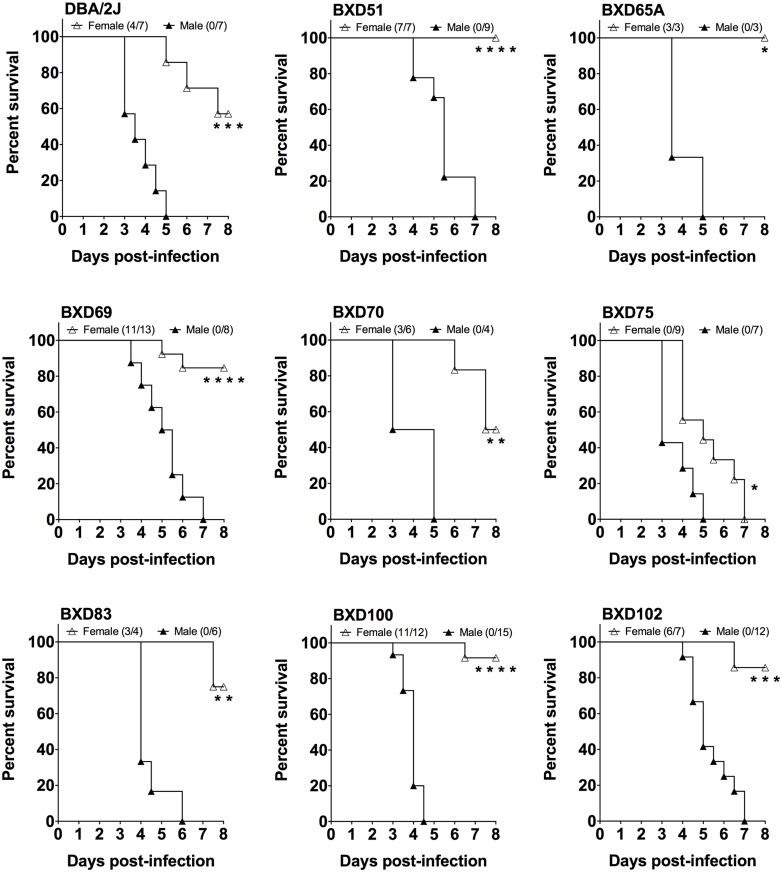
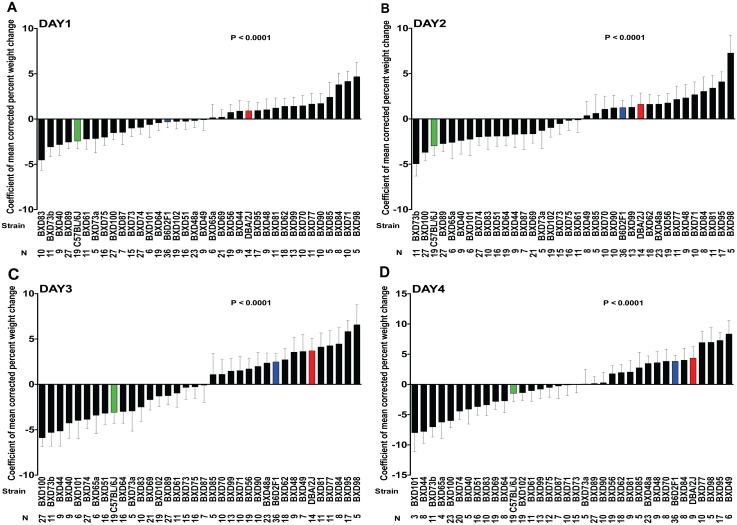
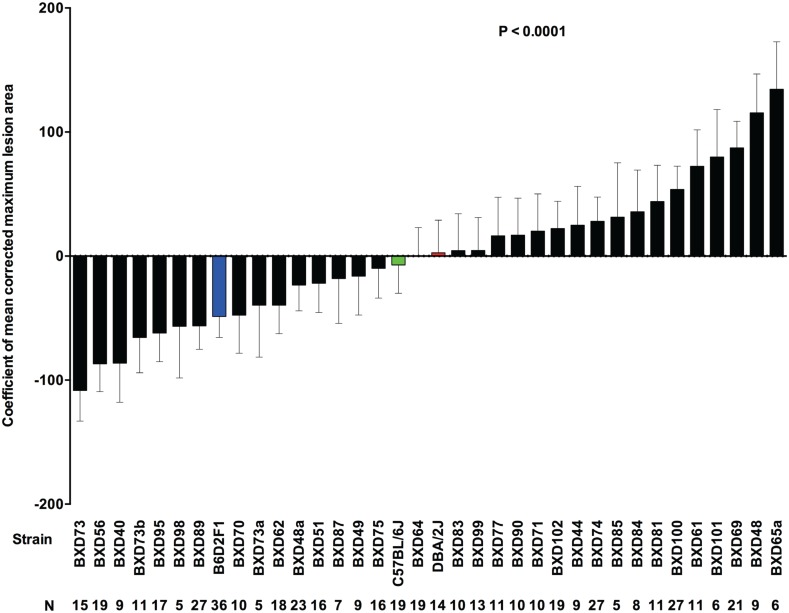
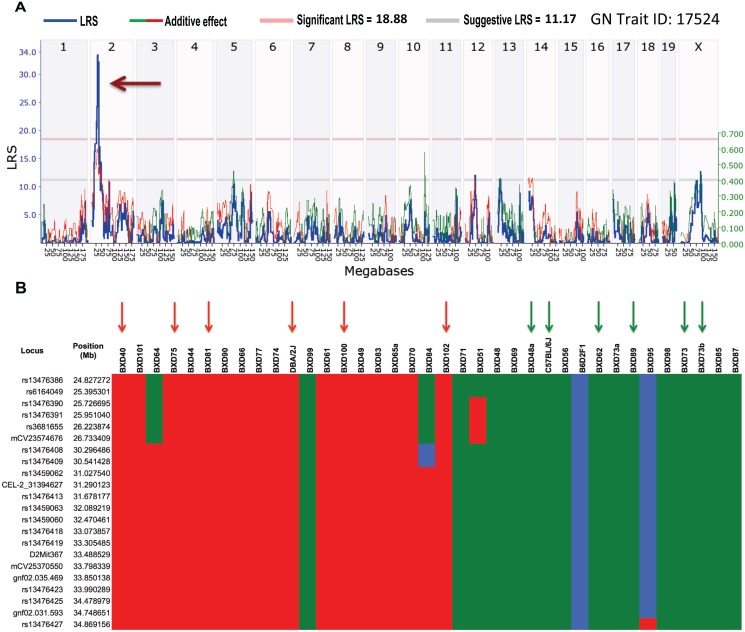
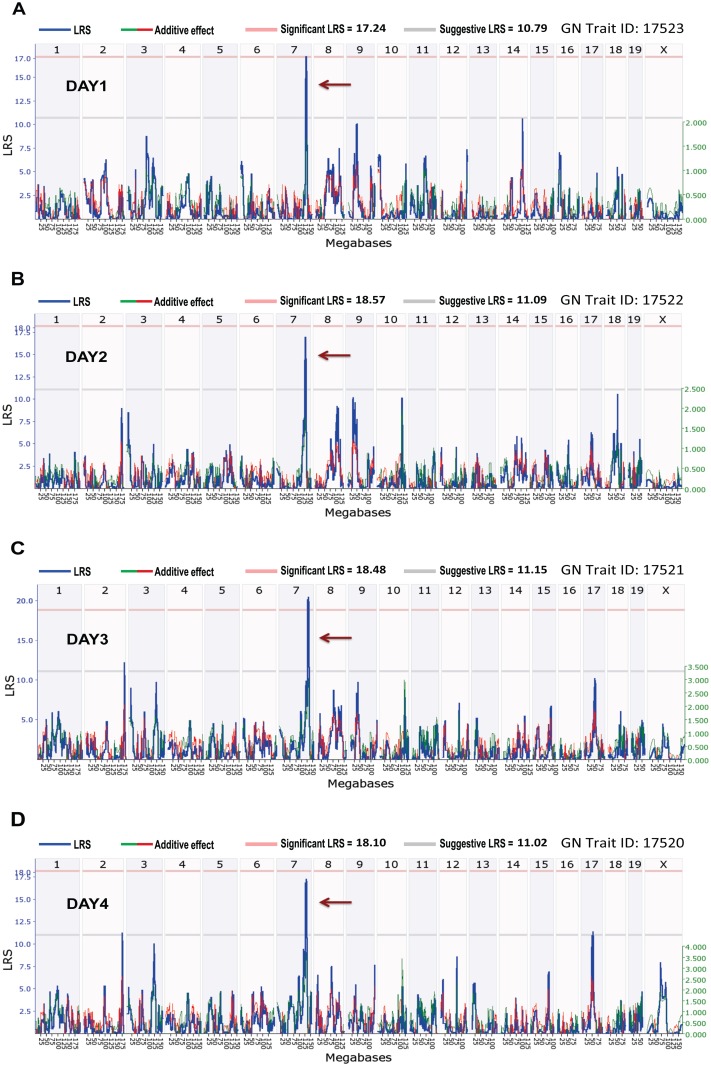
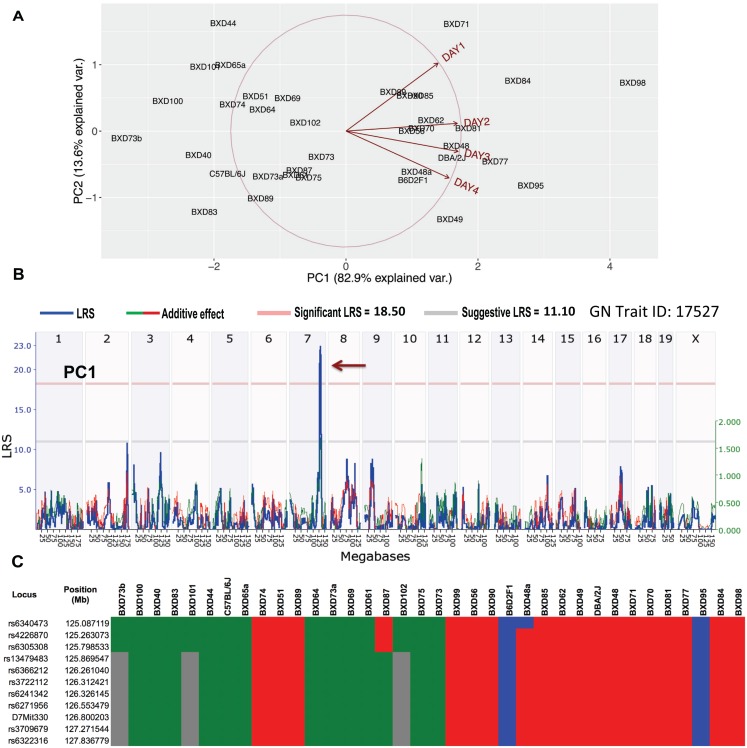
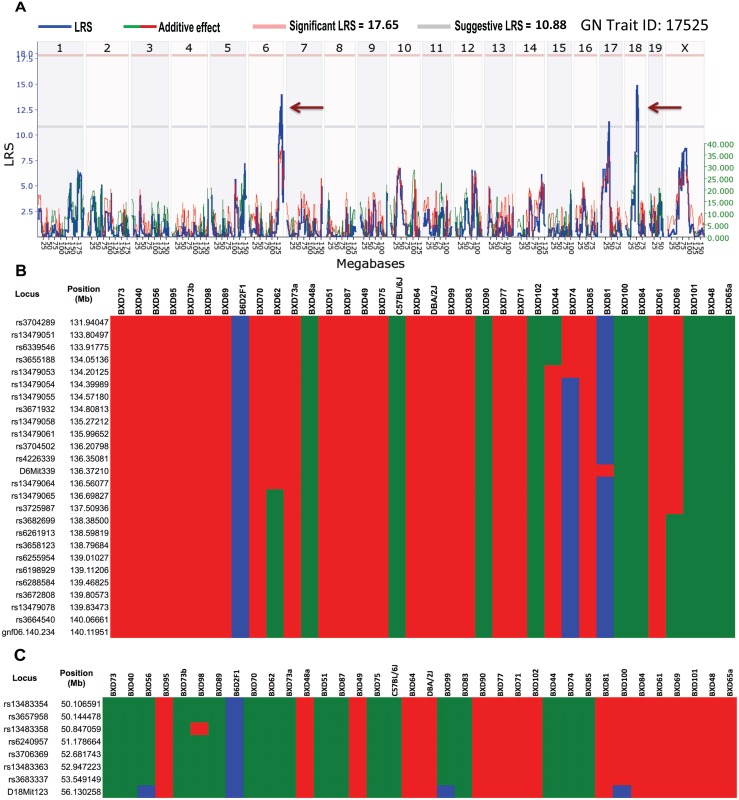
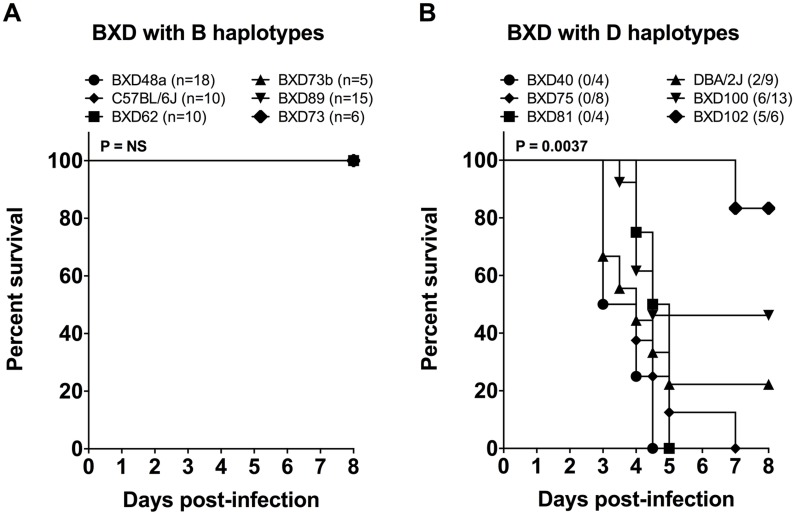
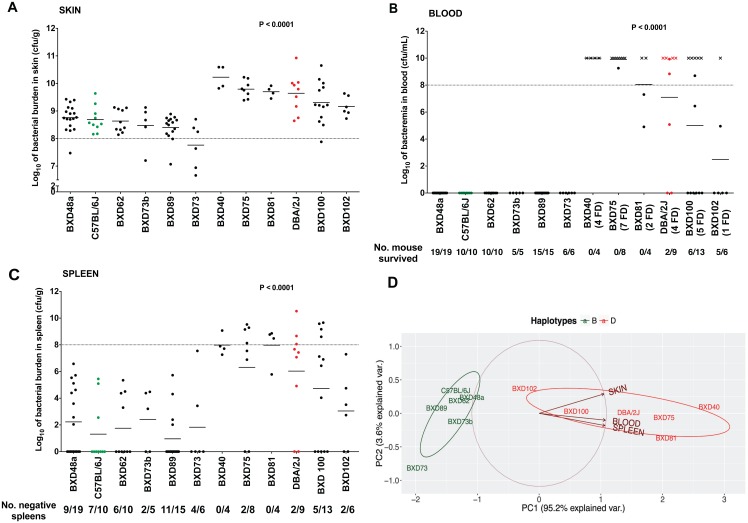
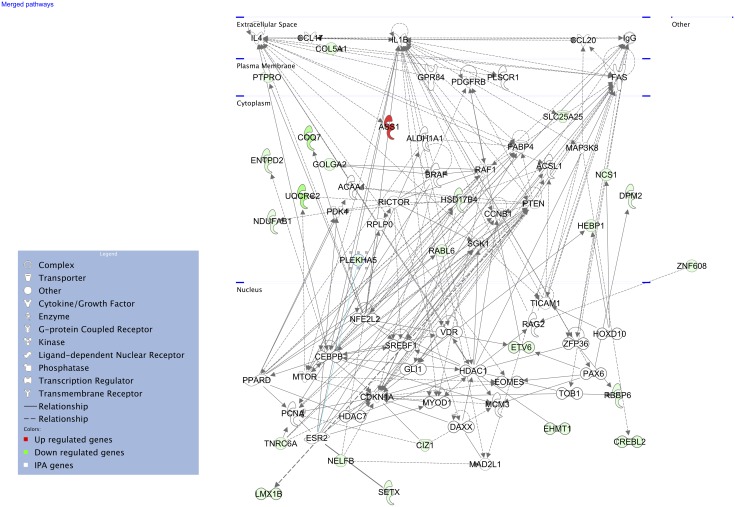
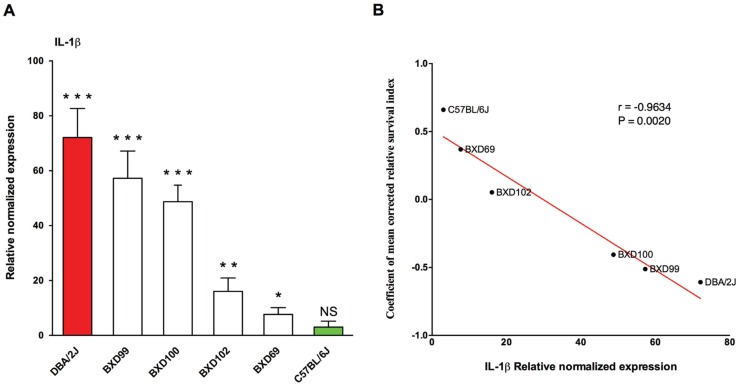
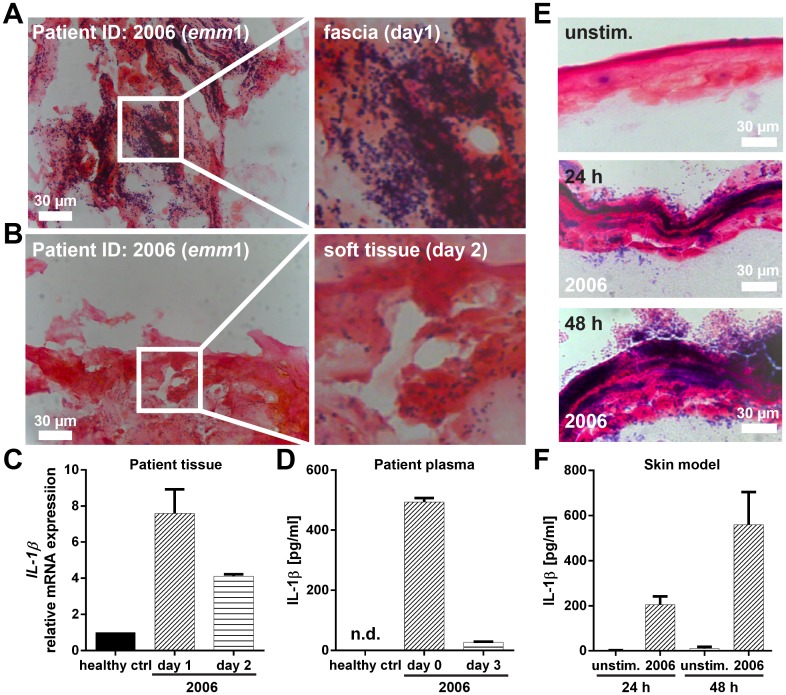
Host genetic variations play an important role in several pathogenic diseases, and we have previously provided strong evidences that these genetic variations contribute significantly to differences in susceptibility and clinical outcomes of invasive Group A Streptococcus (GAS) infections, including sepsis and necrotizing soft tissue infections (NSTIs). Our initial studies with conventional mouse strains revealed that host genetic variations and sex differences play an important role in orchestrating the severity, susceptibility and outcomes of NSTIs. To understand the complex genetic architecture of NSTIs, we utilized an unbiased, forward systems genetics approach in an advanced recombinant inbred (ARI) panel of mouse strains (BXD). Through this approach, we uncovered interactions between host genetics, and other non-genetic cofactors including sex, age and body weight in determining susceptibility to NSTIs. We mapped three NSTIs-associated phenotypic traits (i.e., survival, percent weight change, and lesion size) to underlying host genetic variations by using the WebQTL tool, and identified four NSTIs-associated quantitative genetic loci (QTL) for survival on mouse chromosome (Chr) 2, for weight change on Chr 7, and for lesion size on Chr 6 and 18 respectively. These QTL harbor several polymorphic genes. Identification of multiple QTL highlighted the complexity of the host-pathogen interactions involved in NSTI pathogenesis. We then analyzed and rank-ordered host candidate genes in these QTL by using the QTLminer tool and then developed a list of 375 candidate genes on the basis of annotation data and biological relevance to NSTIs. Further differential expression analyses revealed 125 genes to be significantly differentially regulated in susceptible strains compared to their uninfected controls. Several of these genes are involved in innate immunity, inflammatory response, cell growth, development and proliferation, and apoptosis. Additional network analyses using ingenuity pathway analysis (IPA) of these 125 genes revealed interleukin-1 beta network as key network involved in modulating the differential susceptibility to GAS NSTIs.


Conflict of interest statement

The authors have declared that no competing interests exist.

Figures

Fig 1
Fig 1. Differences in survival responses between BXD mice with GAS NSTIs.
Survival within the 33 BXD (black bars), B6 (green bar), D2 (red bar) and their F1 (blue bar) strains is expressed as mean values of corrected relative survival indices. Data are rank-ordered with positive indices indicating increased survival and negative indices indicating decreased survival. Error bars indicate SEM. P values were calculated by GLM analysis using OLS ANOVA.
Fig 2
Fig 2. Sex-based differences in survival of D2 and BXD mice with GAS NSTIs.
Survival curves for the male and female mice of D2 and other BXD strains, subcutaneously infected with an equal dose of GAS bacteria, are shown. Data presented are percent survival (n ≥ 3 for each sex). P values were calculated by log-rank (Mantel-Cox) tests. *P < 0.05, **P < 0.01, ***P < 0.001, ****P < 0.0001.
Fig 3
Fig 3. Differences in weight change between BXD mice during the first four days of GAS NSTIs.
Percent weight changes on (A) Day 1, (B) Day 2, (C) Day 3, and (D) Day 4 percent weight change results across 33 BXD (black bars), B6 (green bar), D2 (red bar) and their F1 (blue bar) strains are expressed as mean values of corrected percent weight change. Data are rank-ordered with negative values indicating maximum weight loss and positive values indicating minimal weight loss. Error bars indicate SEM. P values were calculated by GLM analysis using OLS ANOVA.
Fig 4
Fig 4. Differences in lesion size among BXD mice with GAS NSTIs.
Lesion sizes in 33 BXD (black bars), B6 (green bar), D2 (red bar) and their F1 (blue bar) strains are expressed as mean values of corrected maximum lesion area. Data are rank-ordered with positive values indicating increased lesion sizes and negative values indicating reduced lesion size. Error bars indicate SEM. P values were calculated by GLM analysis using OLS ANOVA.
Fig 5
Fig 5. QTL mapping and haplotype analysis for survival against GAS NSTIs.
(A) Genome-wide interval mapping of survival data (expressed as cRSI across BXD and parental strains) reveal a significant QTL on mouse Chr 2 (brown arrow). Red and gray horizontal lines indicate significant and suggestive LRS thresholds, respectively. (B) Haplotype analysis of the QTL region between 24.5 and 35 Mb on mouse Chr 2 is shown. BXD strains were rank-ordered on the basis of their cRSI values from susceptible to more resistant. Red and green bars (within each loci/position) indicate D and B alleles, respectively, whereas blue bars indicate heterozygous alleles. BXD cohorts harboring either D (red arrows) or B (green arrows) haplotypes within the QTL region and their parental strains selected for in silico validation analyses are indicated.
Fig 6
Fig 6. QTL mapping for weight change kinetics during the first four days of GAS NSTIs.
Genome-wide interval mapping for percent weight change on (A) Day 1, (B) Day 2, (C) Day 3, and (4) Day 4 revealed a consistent QTL on mouse Chr 7 (brown arrow). Red and gray horizontal lines indicate significant and suggestive LRS thresholds, respectively.
Fig 7
Fig 7. Principal component analysis, QTL mapping, and haplotype analysis for weight change kinetics during the first four days of GAS NSTIs.
(A) PCA ggbiplot display the first two principal components (PC1 and PC2) of four non-independent percent weight change measurements. As shown, PC1 explains most of the variances between the four data. (B) Genome-wide interval mapping for PC1 revealed a significant QTL on mouse Chr 7 (brown arrow). Red and gray horizontal lines indicate significant and suggestive LRS thresholds, respectively. (C) Results of the haplotype analysis of the QTL region between 125 and 131 Mb on mouse Chr 7 are shown. BXD strains were rank-ordered on the basis of their PC1 values from maximum weight loss to minimum. Red and green bars (within each loci/position) indicate D and B alleles, respectively, whereas blue and gray bars indicate heterozygous and unknown alleles, respectively.
Fig 8
Fig 8. QTL mapping and haplotype analysis for maximum lesion size associated with GAS NSTIs.
(A) Genome-wide interval mapping for lesion size revealed two suggestive QTLs on mouse Chr 6 and 18 (brown arrows). Red and gray horizontal lines indicate significant and suggestive LRS thresholds, respectively. Results of the haplotype analysis of the QTL region (B) between 131.6 and 141.8 Mb on mouse Chr 6 and (C) between 49.5 and 56.3 Mb on Chr 18 are shown. BXD strains are rank-ordered on the basis of lesion sizes (from larger to smaller lesions). Red and green bars (within each loci/position) indicate D and B alleles, respectively, and blue bars indicate heterozygous alleles.
Fig 9
Fig 9. Differences in survival between BXD mice with NSTIs harboring either B or D haplotypes within their survival QTL regions.
Survival curves for the selected BXD cohorts harboring either (A) B haplotypes or (B) D haplotypes within their survival QTL regions on mouse Chr 2 and survival curves for their parental strains are shown. Results are percent survival (n ≥ 4 for each group). P values were calculated by log-rank (Mantel-Cox) tests.
Fig 10
Fig 10. Differences in bacterial loads and dissemination between BXD mice harboring either B or D haplotypes within their survival QTL regions.
Shown are the bacterial loads in (A) skin, (B) blood, and (C) spleen collected during the seven-day infection timeline, from surviving and dead mice of BXD strains harboring either a B (left) or D (right) haplotypes within their survival QTL regions. Similar data from their parental strains (B6 –green and D2 –red) are also shown. BXD mice are rank-ordered, within their groups, based on their bacterial counts. Each mouse is represented by a symbol with the horizontal bar representing the mean, and the horizontal dotted line indicating the inoculum given. Bacteremia counts for dead mice (cross symbols) for which blood collections were missed were assigned an arbitrary value of 1010 CFU/mL (a value near the maximum bacteremia count). Data presented are log-transformed bacterial loads (n ≥ 4 for each strain). P values were calculated by one-way ANOVA. (D) The PCA ggbiplot displays the first two principal components (PC1 and PC2) of three non-independent bacterial measurements. BXD strains harboring D and B haplotypes are indicated by red and green, respectively. The BXD strains are grouped together on the basis of their haplotypes.
Fig 11
Fig 11. Functional gene network modulating GAS NSTIs.
Graphical representation of molecular interactions between significantly up regulated (red) or down regulated (green) genes within the QTL in the susceptible BXD strains, highlighting the central role of interleukin-1 beta (IL-1β) as a key regulator in modulating GAS NSTIs. Genes are represented as nodes, and the biological relationship between two nodes is represented as line, solid lines represent direct interactions and dashed lines represent indirect interactions. All the gene names are listed in S8 Table. The networks were generated through the use of QIAGEN’s Ingenuity Pathway Analysis (IPA, QIAGEN Redwood City, http://www.qiagen.com/ingenuity).
Fig 12
Fig 12. Expression of IL-1β in different BXD strains.
(A) Shown are the relative normalized IL-1β mRNA expression at the infected site of parental strains (B6 –green and D2 –red) as well as representative BXD strains (BXD 69, 99, 100 and 102), selected based on their cRSI (survival index), compared to their respective uninfected controls. The data represent mean values ± SD (n = 3 for each strain). P values were calculated through student’s t-test. *P < 0.05, **P < 0.01, ***P < 0.001, NS—non significant. (B) Correlation of cRSI (survival index) with IL-1β mRNA expression. Regression line is shown in red. r, represents pearson correlation coefficient; P, represents P value.
Fig 13
Fig 13. Expression of IL-1β in patient tissue and skin tissue models.
Identification of bacteria in patient biopsies was visualized by conventional Gram staining. Representative images of tissue sections from patient 2006 at (A) day 1 and (B) day 2 are shown. (C) Relative IL-1β mRNA expression at the local site of infection. Mean values ± SD from biopsies of two healthy volunteers and two technical replica of the patient biopsy at indicated days are shown. (D) IL-1β in plasma samples collected from patient 2006 and three healthy volunteers are shown. Mean values ± SD from two technical replica of patient 2006 on indicated days are shown. (E) Representative images of Gram stained skin tissue models 24 and 48 hours after infection. (F) Detection of IL-1β levels in skin model culture supernatants at indicated time points. The data represent mean values ± SD from three independent experiments (n = 3).

Similar articles

Cited by

References

    1. Segre JA. Epidermal barrier formation and recovery in skin disorders. J Clin Invest. 2006;116(5):1150–8. - PMC - PubMed
    1. Aziz RK, Kotb M. Rise and persistence of global M1T1 clone of Streptococcus pyogenes. Emerg Infect Dis. 2008;14(10):1511–7. 10.3201/eid1410.071660 - DOI - PMC - PubMed
    1. Cole JN, Barnett TC, Nizet V, Walker MJ. Molecular insight into invasive group A streptococcal disease. Nat Rev Microbiol. 2011;9(10):724–36. 10.1038/nrmicro2648 - DOI - PubMed
    1. Cunningham MW. Pathogenesis of group A streptococcal infections. Clin Microbiol Rev. 2000;13(3):470–511. - PMC - PubMed
    1. Demers B, Simor AE, Vellend H, Schlievert PM, Byrne S, Jamieson F, et al. Severe invasive group A streptococcal infections in Ontario, Canada: 1987–1991. Clin Infect Dis. 1993;16(6):792–800; discussion 1–2. - PubMed

Publication types