Meta-Analysis
. 2016 Aug;48(8):940-946.
doi: 10.1038/ng.3603. Epub 2016 Jul 11.

Genome-wide association meta-analysis in Chinese and European individuals identifies ten new loci associated with systemic lupus erythematosus

Affiliations
Meta-Analysis

Genome-wide association meta-analysis in Chinese and European individuals identifies ten new loci associated with systemic lupus erythematosus

David L Morris et al. Nat Genet. 2016 Aug.

Abstract

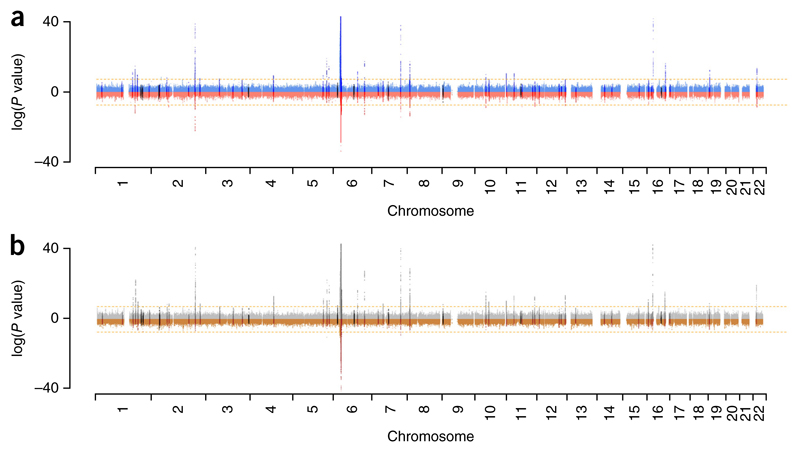
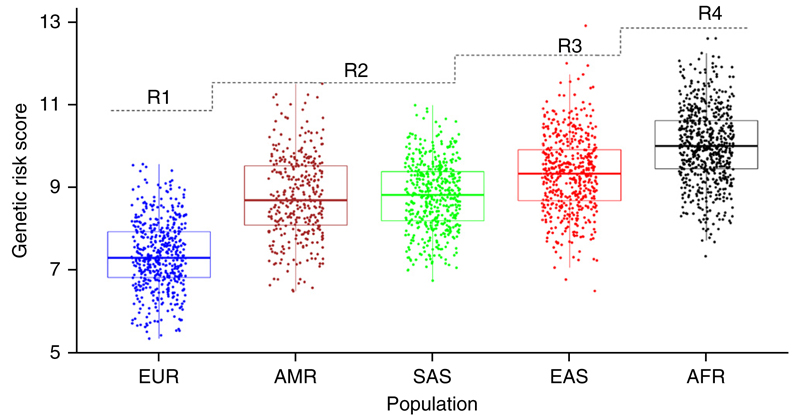
Systemic lupus erythematosus (SLE; OMIM 152700) is a genetically complex autoimmune disease. Genome-wide association studies (GWASs) have identified more than 50 loci as robustly associated with the disease in single ancestries, but genome-wide transancestral studies have not been conducted. We combined three GWAS data sets from Chinese (1,659 cases and 3,398 controls) and European (4,036 cases and 6,959 controls) populations. A meta-analysis of these studies showed that over half of the published SLE genetic associations are present in both populations. A replication study in Chinese (3,043 cases and 5,074 controls) and European (2,643 cases and 9,032 controls) subjects found ten previously unreported SLE loci. Our study provides further evidence that the majority of genetic risk polymorphisms for SLE are contained within the same regions across both populations. Furthermore, a comparison of risk allele frequencies and genetic risk scores suggested that the increased prevalence of SLE in non-Europeans (including Asians) has a genetic basis.

Trial registration: ClinicalTrials.gov NCT00413361.


Conflict of interest statement

Competing Financial Interests

The authors declare no competing financial interests.

Figures

Figure 1
Figure 1
Comparison of Manhattan plots for the European and Chinese SLE GWASs. (a) Manhattan plot of results from the European (4,036 cases and 6,959 controls) and Chinese (meta-analysis of two Chinese GWASs comprising 1,659 cases and 3,398 controls) association studies. −log10 P values for European subjects are shown in blue, and log10 P values for Chinese subjects are shown in red. The ten novel loci identified as SLE associated by this study are shown in black. (b) −log10 P values for a meta-analysis (using inverse-variance weighting) of European and Chinese GWASs (gray) compared with log10 P values for a test of heterogeneity (using Cochran’s Q statistic) between the European and Chinese GWASs (brown). The 52 loci with published evidence of SLE association are highlighted in dark gray (meta-analysis P values) and dark brown (heterogeneity test); the 10 novel loci identified as SLE associated by this study (after replication) are highlighted in black. The orange dashed lines in both panels indicate the accepted threshold for genome-wide statistical significance, P = 5 × 10⁻⁸.
Figure 2
Figure 2
Fine-mapping examples for STAT4, IRF7 and ELF1. The upper plots are LocusZoom plots showing association significance (−log10(P value)) and local LD (r2; color-coded). Circular points represent SNPs contained within the credibility sets, and square points represent SNPs not contained in the sets. The lower plots display the minor allele frequencies for all the SNPs in the intersection of the European (EUR) and Chinese (CHN) credibility sets. The minor allele frequency is plotted in red. The SNPs with the highest posterior probability within the intersection of the confidence intervals are highlighted by blue (highest posterior probability in the EUR data), red (highest posterior probability in the CHN data) and black (highest posterior probability in the CHN–EUR meta-data) asterisks. The credibility set coverage (99% for STAT4, 90% for IRF7 and ELF1) was chosen as the maximum coverage that included a maximum of 30 SNPs.
Figure 3
Figure 3
3D enrichment plots depicting epigenetic modifications of ±50 bp overlapping all SNPs in the credibility sets for the 11 newly identified associated SNPs. The SNPs are shown as individual tracks on the x-axis with the SNP used in the replication study (*) and the SNP that showed the best evidence for colocalization with the most prominent epigenetic mark (#). Other SNP identities are listed in supplementary Table 6. The z-axis represents the log10 P value against the null hypothesis that peak intensity arises from the control distribution. The z-axis is truncated at a lower level (P < 10−4). For each novel associated locus, results are shown for RNA expression (RNA-seq), accessibility to DNase, histone modification by acetylation (H3K27ac, H3K9ac) and histone modification by methylation (H3K27me3, H3K9me3) over 27 immune cells. The data from the blood cell types are consistently ordered on the y-axis according to the annotation in the lower right of the figure: categories 1–9, innate-response immune cells; categories 10–24, adaptive-response immune cells (categories 10 and 11, B cells; categories 12–24, T cells); categories 25–27, cell lines.
Figure 4
Figure 4
Box plots of GRS across the five major population groups. These are standard box plots showing medians, interquartile ranges and whiskers indicating 1.5 times the interquartile range (Tukey box plots). EUR, European, N = 498; AMR, Amerindian, N = 347; SAS, South Asian, N = 487; EAS, East Asian, N = 503; AFR, African, N = 657; from the 1KG phase 3 release. The dashed line represents the increase in prevalence with the rank order (R1 represents the lowest prevalence, and R4 the highest).

References

    1. Lawrence JS, Martins CL, Drake GL. A family survey of lupus-erythematosus. 1. Heritability. J Rheumatol. 1987;14:913–921. - PubMed
    1. Danchenko N, Satia J, Anthony M. Epidemiology of systemic lupus erythematosus: a comparison of worldwide disease burden. Lupus. 2006;15:308–318. - PubMed
    1. Bentham J, et al. Genetic association analyses implicate aberrant regulation of innate and adaptive immunity genes in the pathogenesis of systemic lupus erythematosus. Nat Genet. 2015;47:1457–1464. - PMC - PubMed
    1. Han JW, et al. Genome-wide association study in a Chinese Han population identifies nine new susceptibility loci for systemic lupus erythematosus. Nat Genet. 2009;41:1234–1237. - PubMed
    1. Yang W, et al. Genome-wide association study in Asian populations identifies variants in ETS1 and WDFY4 associated with systemic lupus erythematosus. PLoS Genet. 2010;6:e1000841. - PMC - PubMed

Publication types

MeSH terms

Associated data