Comparative Study
. 2016 Sep;17(9):1118-27.
doi: 10.1038/ni.3492. Epub 2016 Jul 11.

Tumor-induced stromal reprogramming drives lymph node transformation

Affiliations
Comparative Study

Tumor-induced stromal reprogramming drives lymph node transformation

Angela Riedel et al. Nat Immunol. 2016 Sep.

Abstract

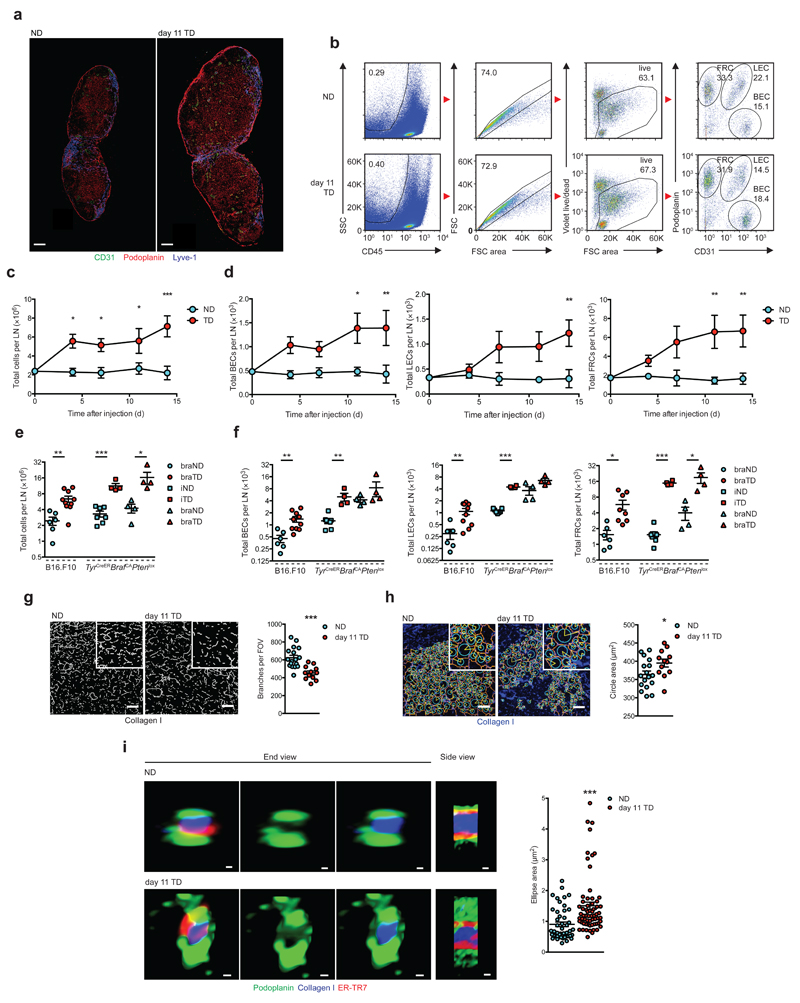
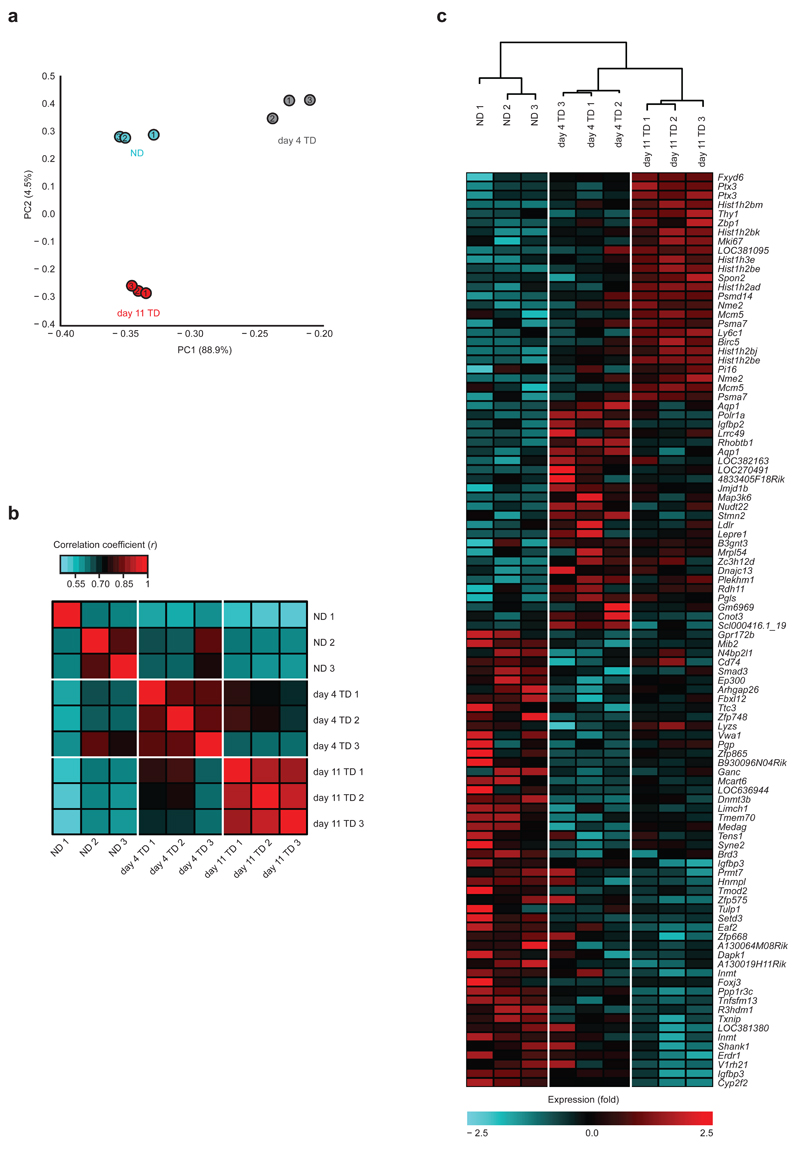
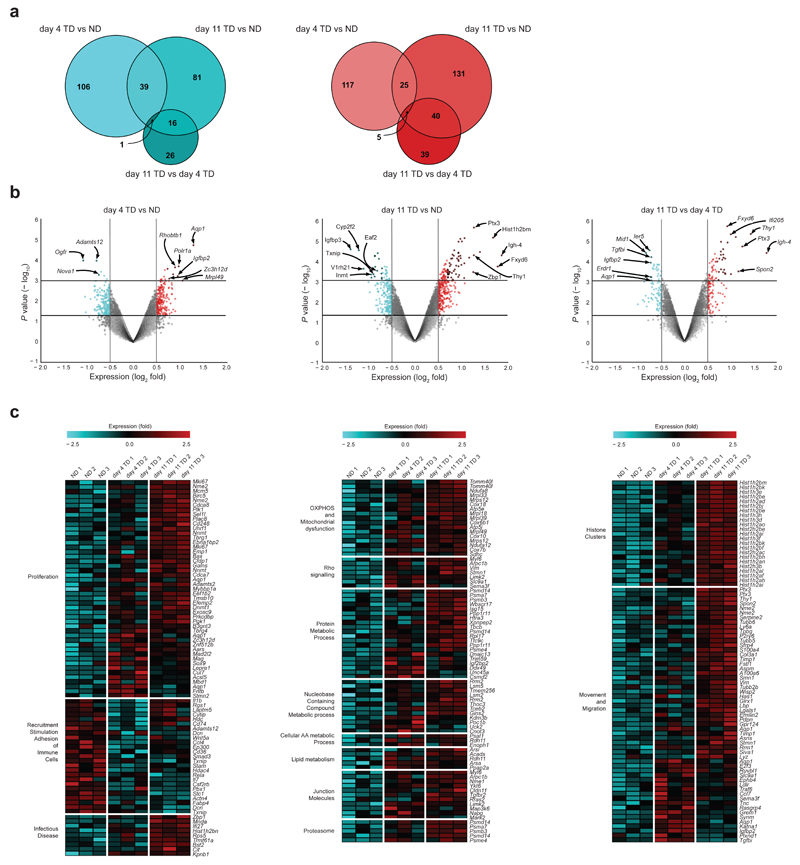
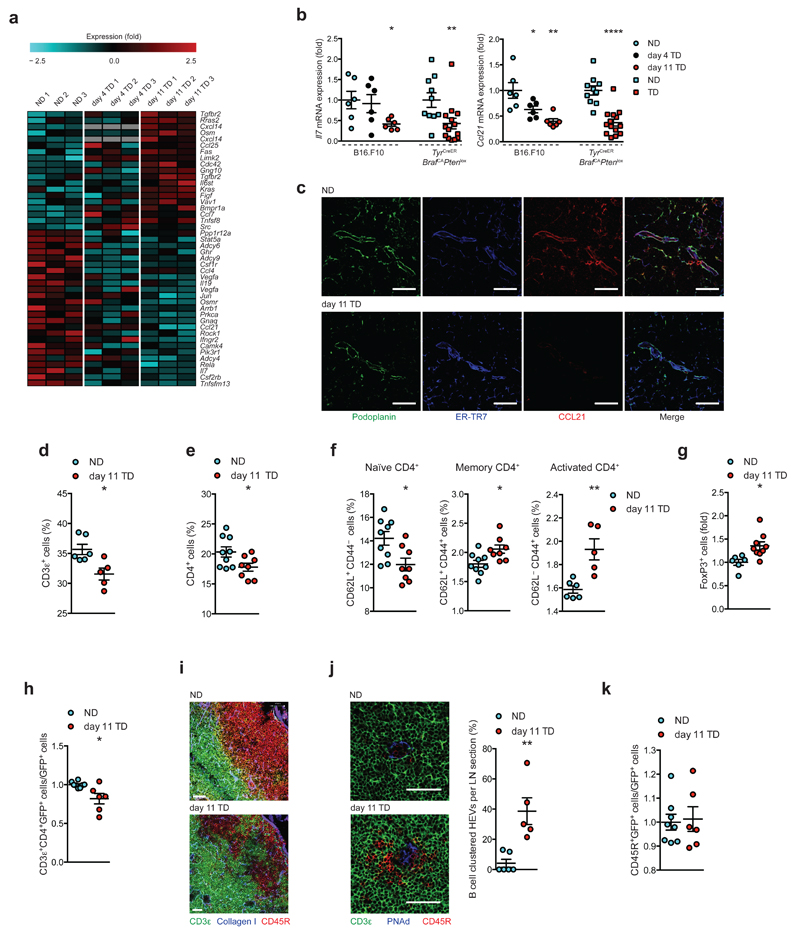
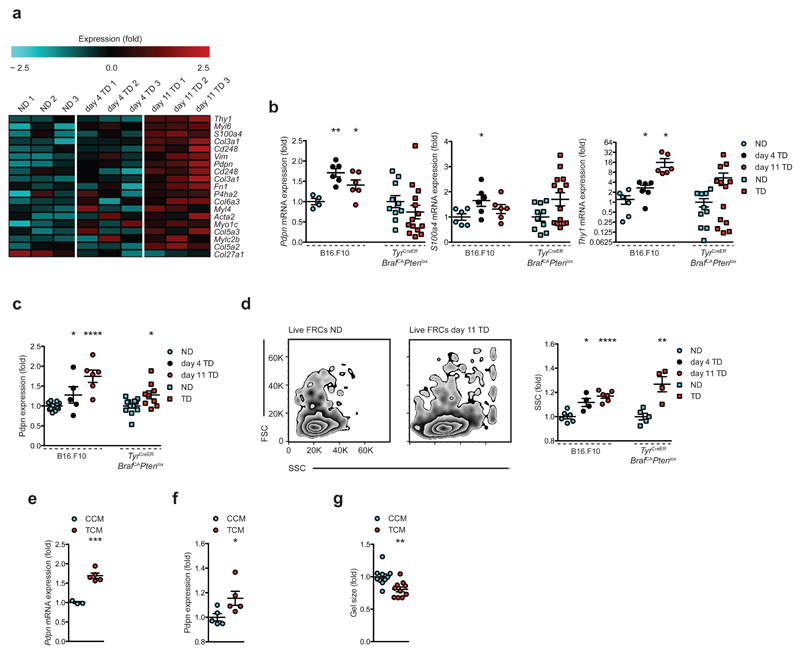
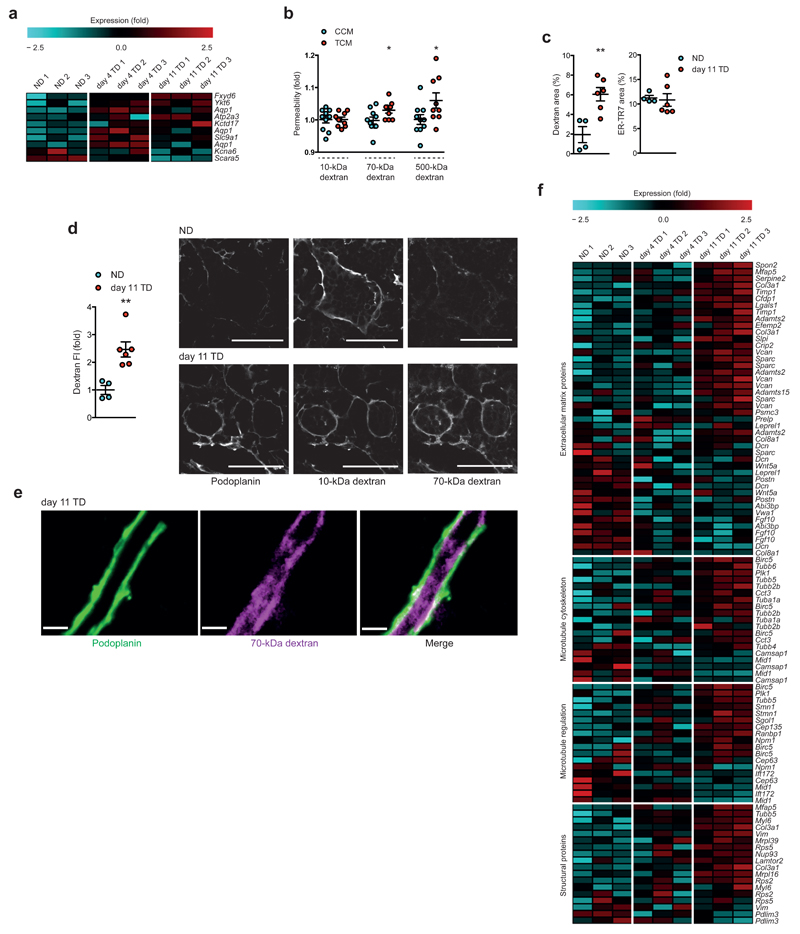
Lymph node (LN) stromal cells, particularly fibroblastic reticular cells (FRCs), provide critical structural support and regulate immunity, tolerance and the transport properties of LNs. For many tumors, metastasis to the LNs is predictive of poor prognosis. However, the stromal contribution to the evolving microenvironment of tumor-draining LNs (TDLNs) remains poorly understood. Here we found that FRCs specifically of TDLNs proliferated in response to tumor-derived cues and that the network they formed was remodeled. Comparative transcriptional analysis of FRCs from non-draining LNs and TDLNs demonstrated reprogramming of key pathways, including matrix remodeling, chemokine and/or cytokine signaling, and immunological functions such as the recruitment, migration and activation of leukocytes. In particular, downregulation of the expression of FRC-derived chemokine CCL21 and cytokine IL-7 were accompanied by altered composition and aberrant localization of immune-cell populations. Our data indicate that following exposure to tumor-derived factors, the stroma of TDLNs adapts on multiple levels to exhibit features typically associated with immunosuppression.


Conflict of interest statement

The authors declare no competing financial interest.

Figures

Figure 1
Figure 1
LN expansion and FRC remodeling. (a) Confocal images of stromal populations in NDLNs and day 11 TDLNs. b) Flow cytometry gating strategy in NDLNs (top) and day 11 TDLNs (bottom). Stromal subtypes are gated on CD45-, live, singlets (numbers in box indicate percent of parent). Right panel; numbers in outlined areas denote percent of Podoplanin+CD31- FRCs (top left), Podoplanin+CD31+ LECs (top right) and Podoplanin-CD31+ BECs (bottom right). (c,d) Flow cytometry measurement of total LN cells (c), BECs, LECs, and FRCs (d). Total LN cells (e) and stromal cells (f) from B16.F10 (circles), TyrCreERBrafCAPtenlox brachial LNs (braLNs, squares) and inguinal LNs (iLNs, triangles). (g) Skeleton analysis, (h) Gap analysis of collagen I networks. (i) Confocal Airyscans of conduit end and side views (left) and quantification (right). Scale bars (a) 200 μm, (g,h) 50 μm, (i) 0.256 μm (NDLN side), 0.441 (NDLN end), 0.363 μm (TDLN side), 0.549 μm (TDLN end). Each symbol represents an individual LN (e,f); field of view (g,h); conduit cross section (i). Small horizontal lines indicate mean ± s.e.m. *P <0.05, **P <0.01 and ***P <0.001 (two-way ANOVA (c,d) or two-tailed unpaired t-test (e-i)). Data are representative of two independent experiments with n=3 NDLNs and n=5 TDLNs in C57BL/6 female mice (c,d; mean and s.e.m.), for B16.F10, n=6 NDLNs and n=10 TDLNs in female C57BL/6 mice and for TyrCreERBrafCAPtenlox mice n=7 iNDLNs, n=4 iTDLNs n=4 braNDLNs and n=4 braTDLNs (equal male:female ratio, e,f); or three independent experiments in female C57BL/6 mice, n=6 NDLNs and n=4 TDLNs (g,h) with 3 FOV analyzed/LN, or n=3 NDLNs and n=4 TDLNs (i) with 5 conduits/LN and 3 measurements/conduit.
Figure 2
Figure 2
Statistical analysis of microarray results. (a) Principle Component Analysis of NDLNs, day 4 TDLNs, and day 11 TDLNs. (b) Heat map of coefficients of correlation for most significantly deregulated genes. Red indicates the highest correlation. (c) Hierarchical clustering analysis of all samples with heat map of the top deregulated gene probes. All analyses were performed on genes applying a cutoff of a change in expression of 1.5-fold and a P value <0.05. Each symbol (a) or column (b,c) represent transcriptomes of FRCs from pooled from 2 brachial LNs per mouse. Data are representative of one experiment with n=3 C57BL/6 female mice per group.
Figure 3
Figure 3
Identification of specific genes and pathways deregulated in TDLN FRCs. (a) Venn diagrams displaying overlap between significantly downregulated and upregulated genes in NDLNs, day 4 TDLNs, and day 11 TDLNs. (b) Volcano plots of significantly deregulated genes for day 4 TDLNs vs. NDLNs (left), day 11 TDLNs vs. NDLNs (middle), and day 11 TDLNs vs. day 4 TDLNs (right) applying a cutoff of a change in expression of 1.5-fold. Downregulated genes (blue), upregulated genes (red). (c) Heatmaps of key pathways involving top deregulated genes compared between day 4 TDLNs vs. NDLNs and day 11 TDLNs vs. NDLNs. Functional groups were assigned with GSEA and IPA. Horizontal lines indicate P <0.05 or P <0.01 (b). Each data point represents transcriptomes of FRCs of 2 brachial LNs, pooled per female mouse.
Figure 4
Figure 4
Perturbation in chemokine/cytokine signaling alters immune cell composition and localization. (a) Heatmap of cytokine and chemokine signaling genes. (b) qRT-PCR validation of Il7 and Ccl21 expression in independent samples from B16.F10 (circles) and TyrCreERBrafCAPtenlox (squares). (c) Confocal images of NDLNs (top) and day 11 TDLNs (bottom) stained for Podoplanin (green), ER-TR7 (blue) and CCL21 (red). (d) Flow cytometric quantification of T cells (CD45+CD3ε+) as percentage of singlets (B16.F10). (e) Quantification of CD4+ T cells (CD45+CD3ε+CD4+), (f) naïve CD62L+CD44-, memory CD62L+CD44+, activated CD62L-CD44+, and (g) regulatory T cells (CD45+CD3ε+CD4+Foxp3+). (h) LN homing assay: flow cytometry quantification of homed CD4+GFP+ splenocytes in C57BL/6 recipients. (i) Confocal images of B cell follicles in NDLNs and day 11 TDLNs stained for CD3ε (green), CD45R (red) and collagen I (blue). (j) Confocal images of NDLNs and day 11 TDLNs stained for CD3ε (green) CD45R (red) and PNAd (blue; left), and quantification of clustering (right). (k) LN homed B cells: flow cytometry quantification of homed CD45R+GFP+ splenocytes. Scales bars (c and j) 50 μm, (i) 51 μm (NDLNs), 38 μm (TDLNs). Each symbol represents an individual LN (b,d,e-g,h-k). Small horizontal lines indicate mean ± s.e.m. *P <0.05, **P <0.01 and ****P <0.0001 (one-way ANOVA (b, B16.F10) or two-tailed unpaired t-test (b,d-h,j,k,)). Data represent one experiment in technical duplicates, n=3 per condition in C57BL/6 female mice for B16.F10, and n=5 NDLNs (3 female, 2 male) or n=7 TDLNs (4 female, 3 male) for TyrCreERBrafCAPtenlox (b); or two independent experiments in C57BL/6 female mice.n=6 NDLNs and n=5 TDLNs (d), n=9 NDLNs and n=8 TDLNs (e), n=9 NDLNs and n=8 TDLNs (naïve and memory), n=6 NDLNs and n=6 TDLNs (activated) (f), n=6 NDLNs and n=9 TDLNs (g), n=8 NDLNs and n=6 TDLNs (h,k), n=6 NDLNs and n=5 TDLNs (j).
Figure 5
Figure 5
FRCs in TDLNs are more activated. (a) Heatmap of genes related to fibroblast activation. (b) qRT-PCR validation of Pdpn, S100a4 and Thy1 in independent FRC samples from B16.F10 (circles) and TyrCreERBrafCAPtenlox (squares). (c) Flow cytometric analysis of podoplanin expression from B16.F10 and TyrCreERBrafCAPtenlox. (d) Flow cytometry scatter profiles of live FRCs from NDLNs vs. day 11 TDLNs (left), quantification of geometric mean of side scatter (right). (e) mRNA and (f) protein expression of podoplanin and (g) collagen gel contractile activity of FRCs treated with control conditioned medium (CCM) or tumor conditioned medium (TCM) in vitro. Each symbol represents an individual LN (b-d) or biological replicate (e-g). Small horizontal lines indicate mean ± s.e.m. *P <0.05, **P <0.01, ***P <0.001 and ****P <0.0001 (one-way ANOVA with Tukeys post-hoc (b-d B16.F10) or two-tailed unpaired t-test (b-g)). Data represent one experiment in technical duplicates, n=3 per condition in C57BL/6 female mice for B16.F10, and n=5 NDLNs (3 female, 2 male) or n=7 TDLNs (4 female, 3 male) for TyrCreERBrafCAPtenlox (b); or two independent experiments in C57BL/6 female mice n=14 NDLNs, n=5 day 4 and n=6 day 11 TDLNs for B16.F10, and n=12 NDLNs (6 female, 6 male) and n=9 TDLNs (5 female, 4 male) for TyrCreERBrafCAPtenlox (c), n=6 NDLNs, n=4 day 4 and n=6 day 11 TDLNs for B16.F10, and n=5 NDLNs (3 female, 2 male) and n=4 TDLNs (2 female, 2 male) for TyrCreERBrafCAPtenlox (d); or three independent experiments n=3 CCM, n=5 TCM(e), n=5 each (f), n=10 each (g).
Figure 6
Figure 6
Modified transporter repertoires within TDLN FRCs translate to altered solute transport throughout the conduit system. (a) Heatmap of genes related to ion/solute conduction or membrane permeability. (b) In vitro measurement of relative permeability of 10, 70 and 500-kDa dextran transport through CCM- or TCM-treated FRC monolayers. (c) Quantification of 70-kDa dextran (left) and ER-TR7 (right) area fraction/cortical area in NDLNs and day 11 TDLNs. (d) Quantification of 70-kDa dextran as relative fluorescence intensity/area (FI; left) and confocal image of 10-kDa, 70-kDa and podoplanin in NDLNs and day 11 TDLNs. Each channel is gray scaled. (e) High-power confocal image of dextran-filled conduit from a day 11 TDLN. (f) Network analysis of top deregulated genes for day 11 TDLNs. Top networks are shown as heat maps of the genes for each time point. Scale bars (d) 50 μm (e) 3.4 μm. Each symbol represents an individual replicate (b) or LN (c,d). Small horizontal lines indicate mean ± s.e.m. *P <0.05, **P <0.01 (two-tailed unpaired t-test (b-d). Data are representative of two independent experiments performed in quintuplicate (b); or one experiment, n=4 NDLNs and n=6 TDLNs in C57BL/6 female mice (c,d).

Comment in

  • Lymph node stroma join the cancer support network.
    Fletcher AL, Heng TS. Fletcher AL, et al. Cell Death Differ. 2016 Dec;23(12):1899-1901. doi: 10.1038/cdd.2016.103. Epub 2016 Sep 30. Cell Death Differ. 2016. PMID: 27689877 Free PMC article. No abstract available.

Similar articles

Cited by

References

    1. Bajenoff M, et al. Stromal cell networks regulate lymphocyte entry, migration, and territoriality in lymph nodes. Immunity. 2006;25:989–1001. - PMC - PubMed
    1. Link A, et al. Fibroblastic reticular cells in lymph nodes regulate the homeostasis of naive T cells. Nature immunology. 2007;8:1255–1265. - PubMed
    1. Schumann K, et al. Immobilized chemokine fields and soluble chemokine gradients cooperatively shape migration patterns of dendritic cells. Immunity. 2010;32:703–713. - PubMed
    1. Roozendaal R, Mebius RE, Kraal G. The conduit system of the lymph node. International immunology. 2008;20:1483–1487. - PubMed
    1. Gretz JE, Norbury CC, Anderson AO, Proudfoot AE, Shaw S. Lymph-borne chemokines and other low molecular weight molecules reach high endothelial venules via specialized conduits while a functional barrier limits access to the lymphocyte microenvironments in lymph node cortex. J Exp Med. 2000;192:1425–1440. - PMC - PubMed

Publication types

MeSH terms