. 2016 Jul 11;12(7):e1004977.
doi: 10.1371/journal.pcbi.1004977. eCollection 2016 Jul.

Machine Learning Meta-analysis of Large Metagenomic Datasets: Tools and Biological Insights

Affiliations

Machine Learning Meta-analysis of Large Metagenomic Datasets: Tools and Biological Insights

Edoardo Pasolli et al. PLoS Comput Biol. .

Abstract

Shotgun metagenomic analysis of the human associated microbiome provides a rich set of microbial features for prediction and biomarker discovery in the context of human diseases and health conditions. However, the use of such high-resolution microbial features presents new challenges, and validated computational tools for learning tasks are lacking. Moreover, classification rules have scarcely been validated in independent studies, posing questions about the generality and generalization of disease-predictive models across cohorts. In this paper, we comprehensively assess approaches to metagenomics-based prediction tasks and for quantitative assessment of the strength of potential microbiome-phenotype associations. We develop a computational framework for prediction tasks using quantitative microbiome profiles, including species-level relative abundances and presence of strain-specific markers. A comprehensive meta-analysis, with particular emphasis on generalization across cohorts, was performed in a collection of 2424 publicly available metagenomic samples from eight large-scale studies. Cross-validation revealed good disease-prediction capabilities, which were in general improved by feature selection and use of strain-specific markers instead of species-level taxonomic abundance. In cross-study analysis, models transferred between studies were in some cases less accurate than models tested by within-study cross-validation. Interestingly, the addition of healthy (control) samples from other studies to training sets improved disease prediction capabilities. Some microbial species (most notably Streptococcus anginosus) seem to characterize general dysbiotic states of the microbiome rather than connections with a specific disease. Our results in modelling features of the "healthy" microbiome can be considered a first step toward defining general microbial dysbiosis. The software framework, microbiome profiles, and metadata for thousands of samples are publicly available at http://segatalab.cibio.unitn.it/tools/metaml.


Conflict of interest statement

The authors have declared that no competing interests exist.

Figures

Fig 1
Fig 1. Validation strategies implemented in the developed framework.
(a) Main strategies include cross-validation on single studies and cross-validation across multiple studies. (b) Additional strategies when multiple stages are available from the same study.
Fig 2
Fig 2. Cross-validation analysis for disease discrimination on six different datasets.
Species abundance was used as microbiome feature. (a) Prediction performance metrics for different diseases versus healthy controls. The margin of errors are reported in parenthesis. In bold we report the best value for each dataset. (b) Average ROC curves (over folds) with confidence intervals for random forests (RF) and support vector machines (SVM).
Fig 3
Fig 3. Prediction performances (assessed using AUC) for disease discrimination in different cross-validation studies.
Species abundance and marker presence are the microbiome features used by the classifiers. The best value for each dataset and feature type (i.e., species abundance or marker presence) are in bold, and the overall best values for each dataset are circled. RF and SVM are applied on the entire set of features whereas RF-FS:Emb incorporates a feature selection step (see Methods). Margins of error are reported in parenthesis.
Fig 4
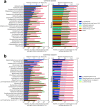
Fig 4
Most important discriminating species (left) and markers (right) identified by RF for disease discrimination in the (a) cirrhosis and (b) colorectal cancer cross-validation studies. In the left panels, for each species reported on the vertical axis, the top bar (in blue) corresponds to the feature relative importance (with standard deviation reported with error bars) and the two bottom bars refer to the average relative abundance for healthy (in green) and diseased (in red) samples. In the right panels, for each marker the top bar is coloured according to the corresponding species and the two bottom bars refer to the average marker presence.
Fig 5
Fig 5. Cross-stage analysis of disease discrimination in the cirrhosis dataset, which was generated in two independent stages (discovery and validation).
The “All” columns and rows show results when all samples are combined. When the training (TR) and test (TS) stages coincide, the analysis was done in cross-validation (with the margin of error reported in parenthesis). In the other cases, the model was generated on TR and then applied to TS. In bold we report the best value for each scenario and feature type (i.e., species abundance or marker presence), and circled are the overall best value for each scenario.
Fig 6
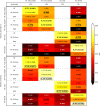
Fig 6. AUC by cross-stage and cross-study analysis for T2D discrimination in the T2D and WT2D datasets.
When the training (TR) and test (TS) sets coincide, the analysis was done in cross-validation (with the margin of error reported in parenthesis). In the other cases, the model was generated on TR and then applied to TS. In bold we report the best value for each setting and feature type (i.e., species abundance or marker presence), and circled are the overall best value for each scenario.
Fig 7
Fig 7
Cross-study analysis in multiple gut datasets for (a) T2D discrimination and (b) disease discrimination (independently from the type of disease). For (a), we included all the healthy (controls) and diabetes (cases) samples, whereas samples labelled as other diseases were not considered. For (b), we instead included all the samples where samples with one of the considered diseases were put together in the same "diseases" class. The * denotes cross-validation results (with the margin of error reported in parenthesis). In the other cases, the model was generated on all the datasets other than the dataset considered for testing, a “leave-one-dataset-out” cross-study validation [51]. For the testing datasets with only healthy samples, prediction accuracy was evaluated in terms of overall accuracy (OA). In bold we report the best value for each scenario and feature type (i.e., species abundance or marker presence), and circled are the absolute best value for each scenario.

References

    1. Human Microbiome Project Consortium. Structure, function and diversity of the healthy human microbiome. Nature 2012;486(7402):207–214. 10.1038/nature11234 - DOI - PMC - PubMed
    1. Cho I, Blaser MJ. The human microbiome: at the interface of health and disease. Nature Rev Genet. 2012;13(4):260–270. 10.1038/nrg3182 - DOI - PMC - PubMed
    1. Gevers D, Knight R, Petrosino JF, Huang K, McGuire AL, Birren BW, et al. The human microbiome project: a community resource for the healthy human microbiome. PLoS Biol. 2012;10(8):e1001377 10.1371/journal.pbio.1001377 - DOI - PMC - PubMed
    1. Manichanh C, Rigottier-Gois L, Bonnaud E, Gloux K, Pelletier E, Frangeul L, et al. Reduced diversity of faecal microbiota in Crohn’s disease revealed by a metagenomic approach. Gut 2006;55(2):205–211. - PMC - PubMed
    1. Frank DN, Amand ALS, Feldman RA, Boedeker EC, Harpaz N, Pace NR. Molecular-phylogenetic characterization of microbial community imbalances in human inflammatory bowel diseases. PNAS 2007;104(34):13780–13785. - PMC - PubMed

Publication types