

United States Health Care Reform: Progress to Date and Next Steps
- PMID: 27400401
- PMCID: PMC5069435
- DOI: 10.1001/jama.2016.9797
United States Health Care Reform: Progress to Date and Next Steps
Abstract
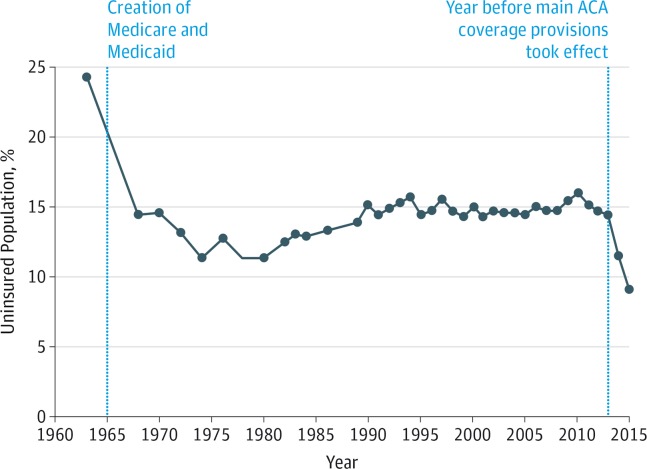
Importance: The Affordable Care Act is the most important health care legislation enacted in the United States since the creation of Medicare and Medicaid in 1965. The law implemented comprehensive reforms designed to improve the accessibility, affordability, and quality of health care.
Objectives: To review the factors influencing the decision to pursue health reform, summarize evidence on the effects of the law to date, recommend actions that could improve the health care system, and identify general lessons for public policy from the Affordable Care Act.
Evidence: Analysis of publicly available data, data obtained from government agencies, and published research findings. The period examined extends from 1963 to early 2016.
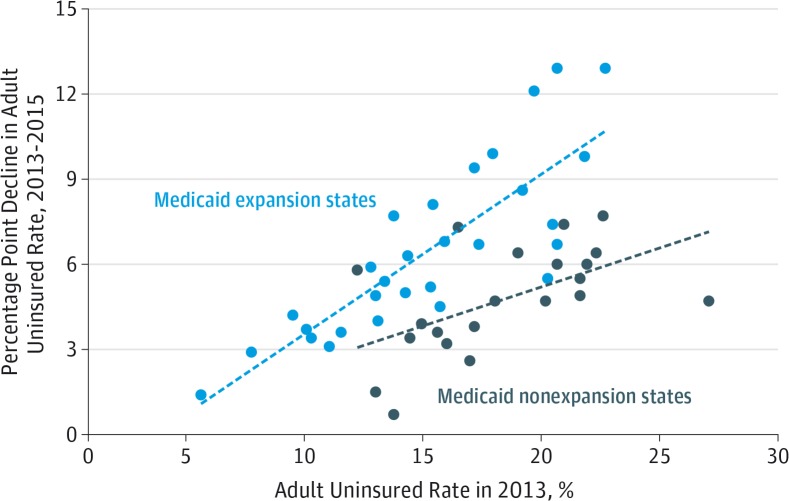
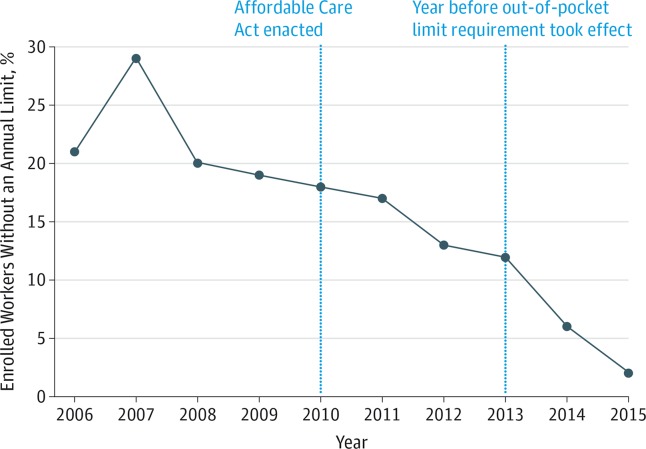
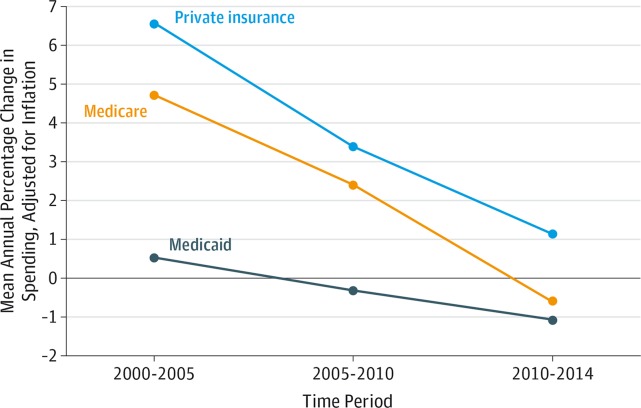
Findings: The Affordable Care Act has made significant progress toward solving long-standing challenges facing the US health care system related to access, affordability, and quality of care. Since the Affordable Care Act became law, the uninsured rate has declined by 43%, from 16.0% in 2010 to 9.1% in 2015, primarily because of the law's reforms. Research has documented accompanying improvements in access to care (for example, an estimated reduction in the share of nonelderly adults unable to afford care of 5.5 percentage points), financial security (for example, an estimated reduction in debts sent to collection of $600-$1000 per person gaining Medicaid coverage), and health (for example, an estimated reduction in the share of nonelderly adults reporting fair or poor health of 3.4 percentage points). The law has also begun the process of transforming health care payment systems, with an estimated 30% of traditional Medicare payments now flowing through alternative payment models like bundled payments or accountable care organizations. These and related reforms have contributed to a sustained period of slow growth in per-enrollee health care spending and improvements in health care quality. Despite this progress, major opportunities to improve the health care system remain.
Conclusions and relevance: Policy makers should build on progress made by the Affordable Care Act by continuing to implement the Health Insurance Marketplaces and delivery system reform, increasing federal financial assistance for Marketplace enrollees, introducing a public plan option in areas lacking individual market competition, and taking actions to reduce prescription drug costs. Although partisanship and special interest opposition remain, experience with the Affordable Care Act demonstrates that positive change is achievable on some of the nation's most complex challenges.
Conflict of interest statement
Disclosures: The author has completed and submitted the ICMJE Form for Disclosure of Potential Conflicts of Interest. The author’s public financial disclosure report for calendar year 2015 may be viewed at https://www.whitehouse.gov/sites/whitehouse.gov/files/documents/oge_278_cy_2015_obama_051616.pdf.
Figures
Comment in
-
US Health Care Reform: Cost Containment and Improvement in Quality.JAMA. 2016 Aug 2;316(5):493-5. doi: 10.1001/jama.2016.9876. JAMA. 2016. PMID: 27400156 No abstract available.
-
The Future of the Affordable Care Act: Reassessment and Revision.JAMA. 2016 Aug 2;316(5):495-7. doi: 10.1001/jama.2016.9881. JAMA. 2016. PMID: 27400269 No abstract available.
-
The Past and Future of the Affordable Care Act.JAMA. 2016 Aug 2;316(5):497-9. doi: 10.1001/jama.2016.10158. JAMA. 2016. PMID: 27400390 No abstract available.
-
Vital Directions for US Health Care: Big Ideas on Small Signposts With Mixed Signals.JAMA. 2016 Oct 25;316(16):1682-1684. doi: 10.1001/jama.2016.12415. JAMA. 2016. PMID: 27668361 No abstract available.
-
Health Care Reform in the United States.JAMA. 2016 Nov 8;316(18):1923-1924. doi: 10.1001/jama.2016.15237. JAMA. 2016. PMID: 27825005 No abstract available.
References
-
- Centers for Medicare & Medicaid Services National Health Expenditure Data: NHE tables. https://www.cms.gov/Research-Statistics-Data-and-Systems/Statistics-Tren.... Published December 3, 2015. Accessed June 14, 2016.
-
- Anderson GF, Frogner BK. Health spending in OECD countries: obtaining value per dollar. Health Aff (Millwood) 2008;27(6):1718–1727. - PubMed
-
- Fisher ES, Wennberg DE, Stukel TA, Gottlieb DJ, Lucas FL, Pinder EL. The implications of regional variations in Medicare spending: part 1: the content, quality, and accessibility of care. Ann Intern Med. 2003;138(4):273–287. - PubMed
-
- Fisher ES, Wennberg DE, Stukel TA, Gottlieb DJ, Lucas FL, Pinder EL. The implications of regional variations in Medicare spending: part 2: health outcomes and satisfaction with care. Ann Intern Med. 2003;138(4):288–298. - PubMed
-
- McGlynn EA, Asch SM, Adams J, et al. The quality of health care delivered to adults in the United States. N Engl J Med. 2003;348(26):2635–2645. - PubMed
Publication types
MeSH terms
LinkOut - more resources
Full Text Sources
Other Literature Sources
Medical
