

Multiplexed cancer biomarker detection using chip-integrated silicon photonic sensor arrays
- PMID: 27400767
- PMCID: PMC5070463
- DOI: 10.1039/c6an01076h
Multiplexed cancer biomarker detection using chip-integrated silicon photonic sensor arrays
Abstract
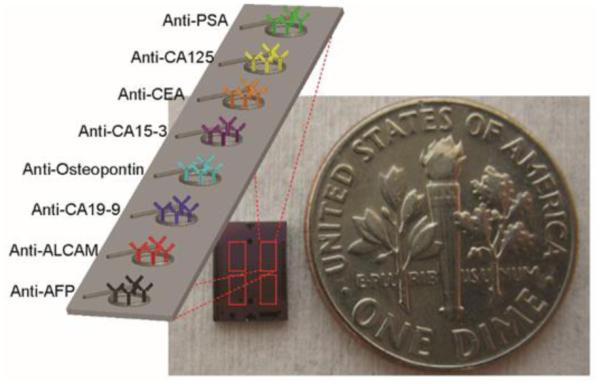
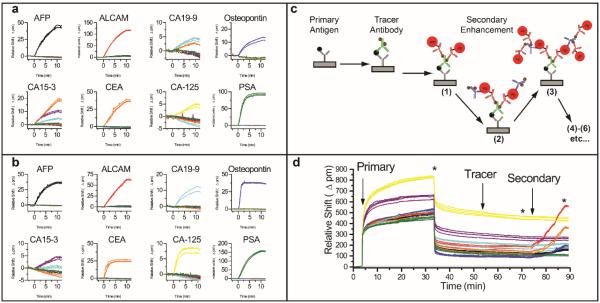
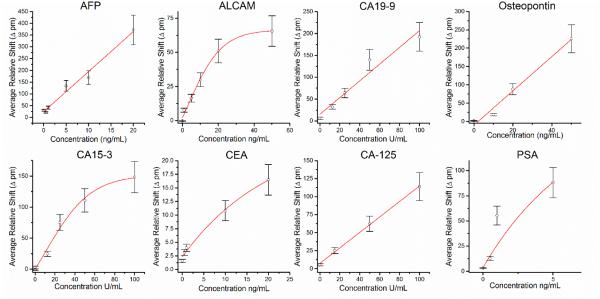
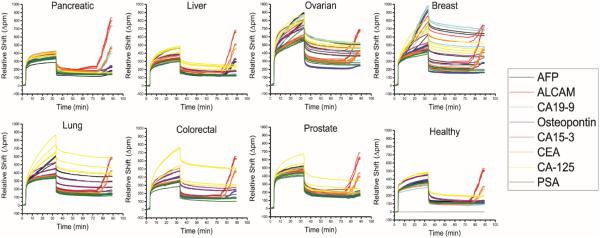
The analysis of disease-specific biomarker panels holds promise for the early detection of a range of diseases, including cancer. Blood-based biomarkers, in particular, are attractive targets for minimally-invasive disease diagnosis. Specifically, a panel of organ-specific biomarkers could find utility as a general disease surveillance tool enabling earlier detection or prognostic monitoring. Using arrays of chip-integrated silicon photonic sensors, we describe the simultaneous detection of eight cancer biomarkers in serum in a relatively rapid (1 hour) and fully automated antibody-based sandwich assay. Biomarkers were chosen for their applicability to a range of organ-specific cancers, including disease of the pancreas, liver, ovary, breast, lung, colorectum, and prostate. Importantly, we demonstrate that selected patient samples reveal biomarker "fingerprints" that may be useful for a personalized cancer diagnosis. More generally, we show that the silicon photonic technology is capable of measuring multiplexed panels of protein biomarkers that may have broad utility in clinical diagnostics.
Figures

Similar articles
-
Development and validation of an immunosensor for monocyte chemotactic protein 1 using a silicon photonic microring resonator biosensing platform.Clin Biochem. 2016 Jan;49(1-2):121-6. doi: 10.1016/j.clinbiochem.2015.09.001. Epub 2015 Sep 10. Clin Biochem. 2016. PMID: 26365696 Free PMC article.
-
Photonic crystal enhanced fluorescence for early breast cancer biomarker detection.J Biophotonics. 2012 Aug;5(8-9):617-28. doi: 10.1002/jbio.201200037. Epub 2012 Jun 27. J Biophotonics. 2012. PMID: 22736539 Free PMC article. Review.
-
Multiplexed detection of lung cancer biomarkers in patients serum with CMOS-compatible silicon nanowire arrays.Biosens Bioelectron. 2017 May 15;91:482-488. doi: 10.1016/j.bios.2016.12.072. Epub 2017 Jan 3. Biosens Bioelectron. 2017. PMID: 28073028
-
Sensitive detection of protein and miRNA cancer biomarkers using silicon-based photonic crystals and a resonance coupling laser scanning platform.Lab Chip. 2013 Oct 21;13(20):4053-64. doi: 10.1039/c3lc50579k. Epub 2013 Aug 20. Lab Chip. 2013. PMID: 23963502 Free PMC article.
-
Bioassay of saliva proteins: The best alternative for conventional methods in non-invasive diagnosis of cancer.Int J Biol Macromol. 2019 Mar 1;124:1246-1255. doi: 10.1016/j.ijbiomac.2018.11.277. Epub 2018 Dec 1. Int J Biol Macromol. 2019. PMID: 30513307 Review.
Cited by
-
Biofunctionalization of Multiplexed Silicon Photonic Biosensors.Biosensors (Basel). 2022 Dec 29;13(1):53. doi: 10.3390/bios13010053. Biosensors (Basel). 2022. PMID: 36671887 Free PMC article. Review.
-
Towards Multiplexed and Multimodal Biosensor Platforms in Real-Time Monitoring of Metabolic Disorders.Sensors (Basel). 2022 Jul 12;22(14):5200. doi: 10.3390/s22145200. Sensors (Basel). 2022. PMID: 35890880 Free PMC article. Review.
-
The Biomedical Applications of Biomolecule Integrated Biosensors for Cell Monitoring.Int J Mol Sci. 2024 Jun 7;25(12):6336. doi: 10.3390/ijms25126336. Int J Mol Sci. 2024. PMID: 38928042 Free PMC article. Review.
-
Microfluidic-Chip-Integrated Biosensors for Lung Disease Models.Biosensors (Basel). 2021 Nov 15;11(11):456. doi: 10.3390/bios11110456. Biosensors (Basel). 2021. PMID: 34821672 Free PMC article. Review.
-
A Label-Free Optical Biosensor Based on an Array of Microring Resonators for the Detection of Human Serum Albumin.Sensors (Basel). 2024 Jan 21;24(2):677. doi: 10.3390/s24020677. Sensors (Basel). 2024. PMID: 38276369 Free PMC article.
References
-
- Etzioni R, Urban N, Ramsey S, McIntosh M, Schwartz S, Reid B, Radich J, Anderson G, Hartwell L. Nature Reviews Cancer. 2003;3:243. - PubMed
-
- Petricoin EF, Ardekani AM, Hitt BA, Levine PJ, Fusaro VA, Steinberg SM, Mills GB, Simone C, Fishman DA, Kohn EC, Liotta LA. Lancet. 2002;359:572–577. - PubMed
-
- Sawyers CL. Nature. 2008;452:548–552. - PubMed
MeSH terms
Substances
Grants and funding
LinkOut - more resources
Full Text Sources
Other Literature Sources