

Genome-Wide Identification of Regulatory Sequences Undergoing Accelerated Evolution in the Human Genome
- PMID: 27401230
- PMCID: PMC5026254
- DOI: 10.1093/molbev/msw128
Genome-Wide Identification of Regulatory Sequences Undergoing Accelerated Evolution in the Human Genome
Abstract
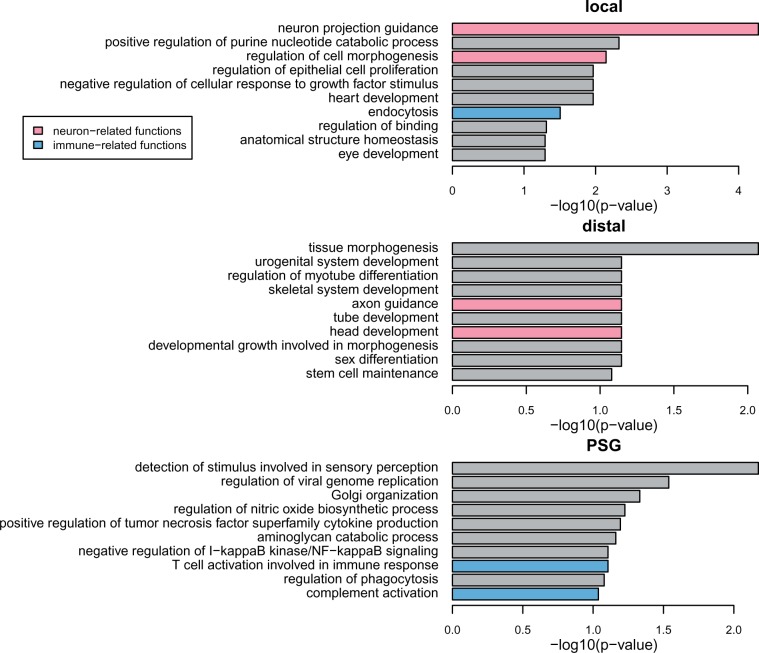
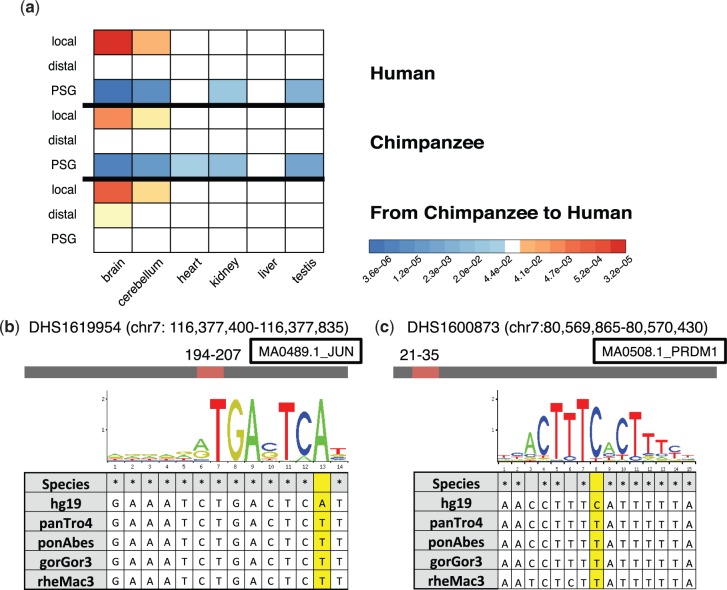
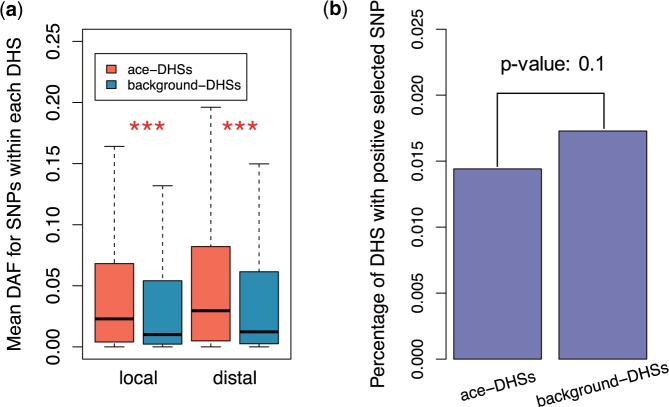
Accelerated evolution of regulatory sequence can alter the expression pattern of target genes, and cause phenotypic changes. In this study, we used DNase I hypersensitive sites (DHSs) to annotate putative regulatory sequences in the human genome, and conducted a genome-wide analysis of the effects of accelerated evolution on regulatory sequences. Working under the assumption that local ancient repeat elements of DHSs are under neutral evolution, we discovered that ∼0.44% of DHSs are under accelerated evolution (ace-DHSs). We found that ace-DHSs tend to be more active than background DHSs, and are strongly associated with epigenetic marks of active transcription. The target genes of ace-DHSs are significantly enriched in neuron-related functions, and their expression levels are positively selected in the human brain. Thus, these lines of evidences strongly suggest that accelerated evolution on regulatory sequences plays important role in the evolution of human-specific phenotypes.
Keywords: DHS; accelerated evolution; regulatory sequence..
© The Author 2016. Published by Oxford University Press on behalf of the Society for Molecular Biology and Evolution.
Figures
Similar articles
-
Genome-scale identification of Caenorhabditis elegans regulatory elements by tiling-array mapping of DNase I hypersensitive sites.BMC Genomics. 2009 Feb 25;10:92. doi: 10.1186/1471-2164-10-92. BMC Genomics. 2009. PMID: 19243610 Free PMC article.
-
Genome-wide mapping of DNase I hypersensitive sites revealed differential chromatin accessibility and regulatory DNA elements under drought stress in rice cultivars.Plant J. 2024 Aug;119(4):2063-2079. doi: 10.1111/tpj.16864. Epub 2024 Jun 10. Plant J. 2024. PMID: 38859561
-
The accessible chromatin landscape of the human genome.Nature. 2012 Sep 6;489(7414):75-82. doi: 10.1038/nature11232. Nature. 2012. PMID: 22955617 Free PMC article.
-
Advances of DNase-seq for mapping active gene regulatory elements across the genome in animals.Gene. 2018 Aug 15;667:83-94. doi: 10.1016/j.gene.2018.05.033. Epub 2018 May 14. Gene. 2018. PMID: 29772251 Review.
-
Open chromatin in plant genomes.Cytogenet Genome Res. 2014;143(1-3):18-27. doi: 10.1159/000362827. Epub 2014 Jun 6. Cytogenet Genome Res. 2014. PMID: 24923879 Review.
Cited by
-
Differences between human and chimpanzee genomes and their implications in gene expression, protein functions and biochemical properties of the two species.BMC Genomics. 2020 Sep 10;21(Suppl 7):535. doi: 10.1186/s12864-020-06962-8. BMC Genomics. 2020. PMID: 32912141 Free PMC article. Review.
-
Enhancer Function and Evolutionary Roles of Human Accelerated Regions.Annu Rev Genet. 2022 Nov 30;56:423-439. doi: 10.1146/annurev-genet-071819-103933. Epub 2022 Sep 7. Annu Rev Genet. 2022. PMID: 36070559 Free PMC article. Review.
-
Unveiling the gene regulatory landscape in diseases through the identification of DNase I-hypersensitive sites.Biomed Rep. 2019 Sep;11(3):87-97. doi: 10.3892/br.2019.1233. Epub 2019 Jul 31. Biomed Rep. 2019. PMID: 31423302 Free PMC article.
-
Identifying branch-specific positive selection throughout the regulatory genome using an appropriate proxy neutral.BMC Genomics. 2020 May 13;21(1):359. doi: 10.1186/s12864-020-6752-4. BMC Genomics. 2020. PMID: 32404186 Free PMC article.
-
Contribution of transposable elements and distal enhancers to evolution of human-specific features of interphase chromatin architecture in embryonic stem cells.Chromosome Res. 2018 Mar;26(1-2):61-84. doi: 10.1007/s10577-018-9571-6. Epub 2018 Jan 15. Chromosome Res. 2018. PMID: 29335803
References
-
- Barski A, Cuddapah S, Cui K, Roh TY, Schones DE, Wang Z, Wei G, Chepelev I, Zhao K. 2007. High-resolution profiling of histone methylations in the human genome. Cell 129:823–837. - PubMed
-
- Benjamini Y, Hochberg Y. 1995. Controlling the false discovery rate: a practical and powerful approach to multiple testing. J R Stat Soc B. 57(1):289–300.
Publication types
MeSH terms
Substances
Grants and funding
LinkOut - more resources
Full Text Sources
Other Literature Sources
Molecular Biology Databases
Miscellaneous
