. 2016 Oct;33(10):2576-92.
doi: 10.1093/molbev/msw129. Epub 2016 Jul 8.

Whole-Genome Sequencing of Native Sheep Provides Insights into Rapid Adaptations to Extreme Environments

Affiliations

Whole-Genome Sequencing of Native Sheep Provides Insights into Rapid Adaptations to Extreme Environments

Ji Yang et al. Mol Biol Evol. 2016 Oct.

Abstract

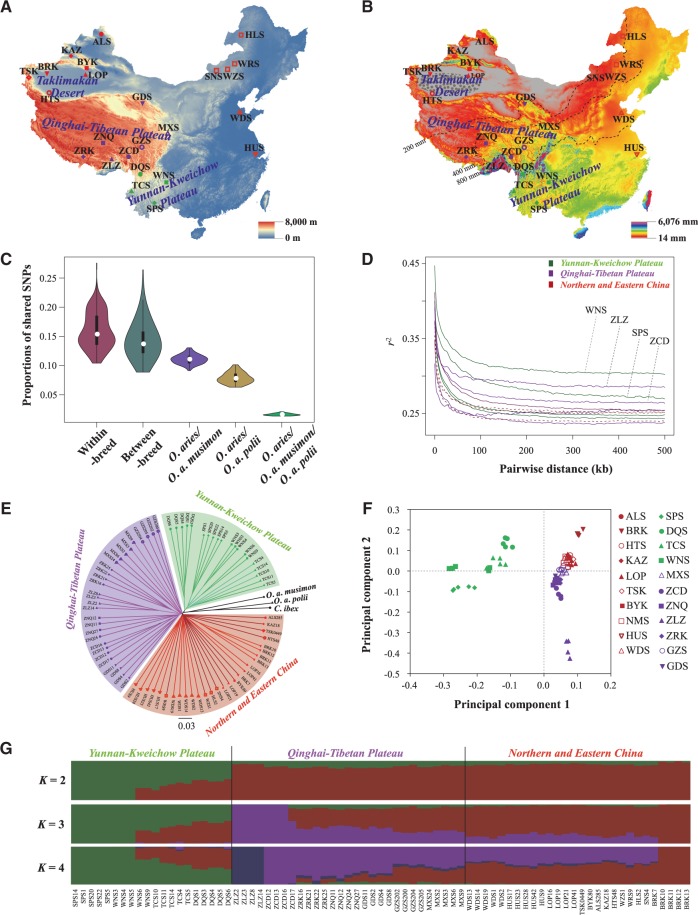
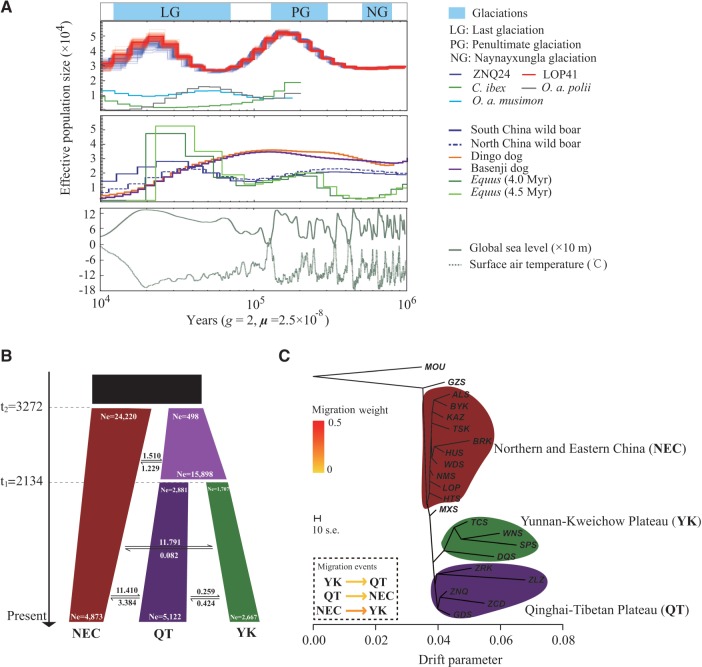
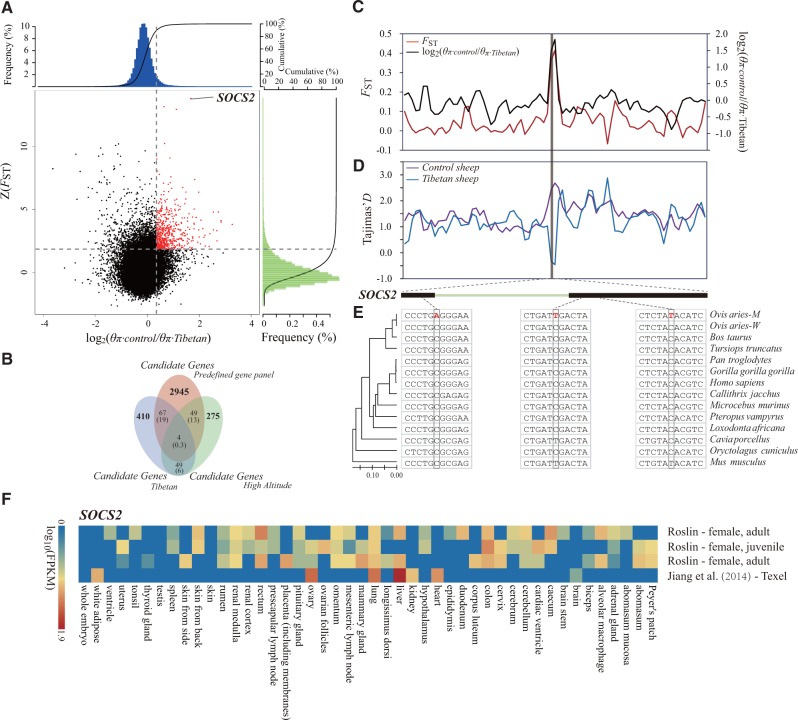
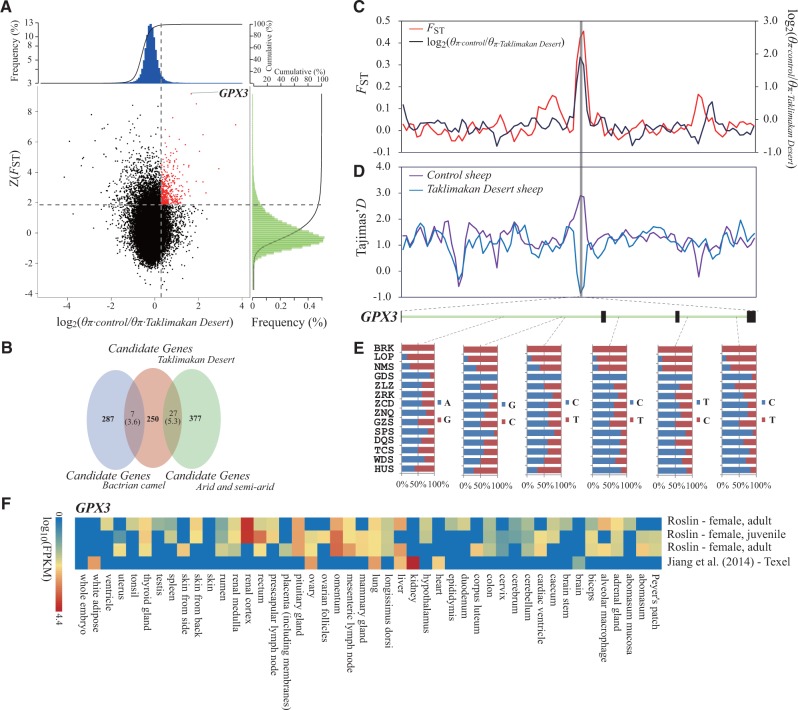
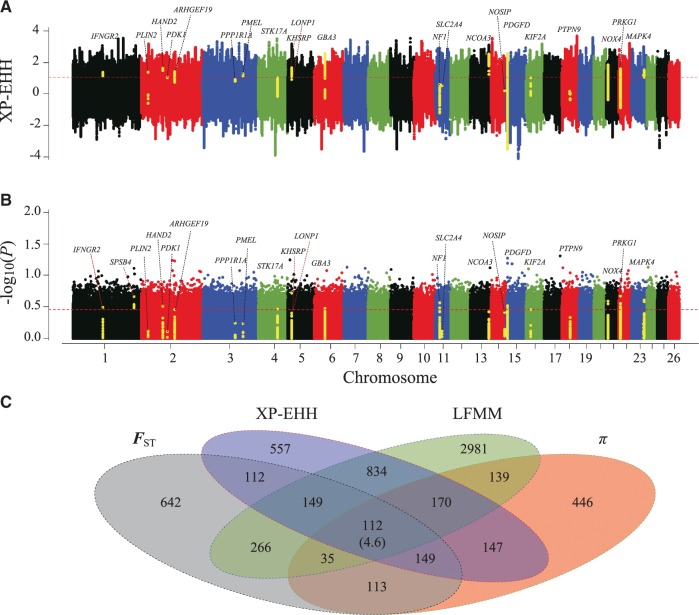
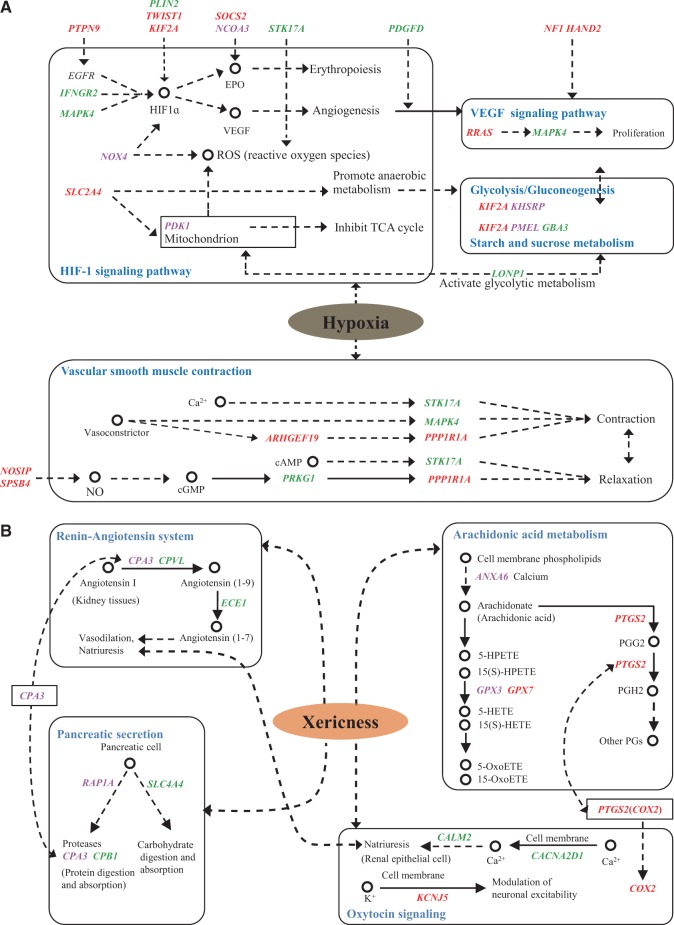
Global climate change has a significant effect on extreme environments and a profound influence on species survival. However, little is known of the genome-wide pattern of livestock adaptations to extreme environments over a short time frame following domestication. Sheep (Ovis aries) have become well adapted to a diverse range of agroecological zones, including certain extreme environments (e.g., plateaus and deserts), during their post-domestication (approximately 8-9 kya) migration and differentiation. Here, we generated whole-genome sequences from 77 native sheep, with an average effective sequencing depth of ∼5× for 75 samples and ∼42× for 2 samples. Comparative genomic analyses among sheep in contrasting environments, that is, plateau (>4,000 m above sea level) versus lowland (<100 m), high-altitude region (>1500 m) versus low-altitude region (<1300 m), desert (<10 mm average annual precipitation) versus highly humid region (>600 mm), and arid zone (<400 mm) versus humid zone (>400 mm), detected a novel set of candidate genes as well as pathways and GO categories that are putatively associated with hypoxia responses at high altitudes and water reabsorption in arid environments. In addition, candidate genes and GO terms functionally related to energy metabolism and body size variations were identified. This study offers novel insights into rapid genomic adaptations to extreme environments in sheep and other animals, and provides a valuable resource for future research on livestock breeding in response to climate change.

Keywords: Ovis aries; climate change.; extreme environment; rapid adaptation; whole-genome sequencing.


Figures

Fig. 1
Fig. 1
Geographic distribution and population genetics analyses of 21 native sheep breeds. (A) Sampling sites in this study. A total of 77 Chinese sheep representing 21 native breeds were included. The elevation (m) of the study area is also visualized. (B) Geographic variation of the annual mean precipitation (mm). Precipitation data during the 21 years from 1981 to 2001 were retrieved from the Abdus Salam International Center for Theoretical Physics, Italy (ICTP, https://www.ictp.it, last accessed January 5, 2015). The 200, 400, and 800 mm average annual precipitation lines are also visualized. (C) Diagram of the average shared SNPs between O. aries individuals as well as between O. aries individuals and the individuals of the three wild species (O. a. musimon, O. a. polii, and C. ibex). (D) Decay of linkage disequilibrium (LD) in the Chinese native sheep breeds, with one line per breed. (E) NJ tree constructed using p-distances between individuals. The three wild species are used as outgroups. (F) Principal components 1 and 2 for the 77 native sheep. (G) Population genetic structure of the 77 native sheep inferred from the program FRAPPE v1.1. The length of each colored segment represents the proportion of the individual genome inferred from ancestral populations (K = 2–4). See supplementary table S1, Supplementary Material online for the abbreviations of the breeds and individuals.
Fig. 2
Fig. 2
Demographic history of the sheep population. (A) PSMC analysis results for the representative individuals sequenced at a high read coverage (∼42×) exhibit inferred variations in Ne over the last 106 years. The Ne of mouflon, argali, ibex, dog, horse, and wild boar are also rescaled. The glaciation periods, atmospheric surface air temperature (°C) and global relative sea level data over the last 106 years are included. (B) ∂ai analysis showing the demographic history of Chinese native sheep from ∼4,000 years ago to the present. Two population divergences occurred at 3,272 (t1) and 2,134 (t2) years ago. The average number of migrants per year between groups is shown between the black arrows. (C) Phylogenetic network of the inferred relationships among the 21 native breeds with three inter-group migration edges. The colored regions in the phylogenetic tree represent three inferred genetic groups. Arrows indicate migration events, and a spectrum of heat colors indicate the migration weights of the migration events. The scale bar shows 10× the average standard error of the entries in the sample covariance matrix. NEC, Northern and Eastern Chinese breeds; QT, Qinghai–Tibetan breeds; YK, Yunnan–Kweichow breeds. For the abbreviations of the breeds, see supplementary table S1, Supplementary Material online.
Fig. 3
Fig. 3
Genomic regions with strong selective signals in Tibetan sheep. (A) Distribution of log2(θπ ratios) and Z(FST) values calculated in 100-kb sliding windows with 50-kb increments between Tibetan group (including breeds ZNQ, ZCD, and ZRK from the plateau environment) and control group (including breeds HUS and WDS from East China). The data points in red (corresponding to the top 5% of the empirical log2(θπ ratios) ratio distribution with values >0.35 and the top 5% of the empirical Z(FST) distribution with values >1.83) are genomic regions under selection in Tibetan sheep. (B) Comparison between the overlap of candidate genes and the overlap expected by chance. Numbers in the intersection regions are the observed overlapping genes among the candidate genes in Tibetan sheep, sheep breeds from the high-altitude regions and the predefined gene panel (i.e., the previously published candidate genes in other mammalian species under the high-altitude environment, including human, dog, wolf, yak, pig, and Tibetan antelope). Numbers in parentheses show the number of genes expected by chance. The total numbers of genes for the sheep and the gene panel involved in the test are 18,013 and 65,029, respectively. (C) log2(θπ ratios) and FST values around the SOCS2 locus. The black and red lines represent the log2(θπ ratios) and FST values, respectively. (D) Tajima’s D values around the SOCS2 locus. The blue and purple lines represent the Tibetan sheep and control sheep, respectively. (E) Evolutionary analysis of the SOCS2 gene. The inter-species NJ tree is derived from the 12 vertebrate orthologous sequences, and the mutations are marked in red. O. aries M., namely O. arise mutant, represents Tibetan sheep in which the mutations were observed. O. aries W., namely O. aries wild, refers to other sheep breeds in which the nucleotides were conserved. (F) Gene expression of SOCS2 in different sheep tissues is based on four different experiments deposited in the EBI Gene Expression Atlas database. The FPKM (fragments per kilobase of transcript per million mapped reads) value is used to measure the expression level.
Fig. 4
Fig. 4
Genomic regions with strong selective signals in sheep breeds from the Taklimakan Desert region. (A) Distribution of log2(θπ ratios) and Z(FST) values calculated in 100-kb sliding windows with 50-kb increments between Taklimakan Desert group (including breeds LOP and BRK from the desert environment) and control group (including breeds HUS and WDS from East China). The data points in red (corresponding to the top 5% of empirical log2(θπ ratios) ratio distribution with values >0.28 and the top 5% of empirical Z(FST) distribution with values >1.86) are genomic regions under selection in the sheep breeds from the Taklimakan Desert region. (B) Comparison between the overlap of candidate genes and the overlap expected by chance. Numbers in the intersection regions are the observed overlapping genes among the candidate genes in sheep breeds from the Taklimakan Desert region, sheep breeds from the arid regions and the predefined gene panel (i.e., the previously published candidate genes in other mammalian species under the arid environment, including Bactrian camel). Numbers in parentheses show the number of genes expected by chance. The total numbers of genes for sheep and Bactrian camel involved in the test are 18,013 and 20,251, respectively. (C) log2(θπ ratios) and FST values around the GPX3 locus. The black and red lines represent log2(θπ ratios) and FST values, respectively. (D) Tajima’s D values around the GPX3 locus. The blue and purple lines represent the Taklimakan Desert sheep and control sheep, respectively. (E) Allele frequencies of six SNPs within the GPX3 gene across Chinese native sheep breeds. The desert breeds include BRK and LOP, whereas the non-desert breeds comprise all other breeds. (F) Gene expression of GPX3 in different sheep tissues is based on four different experiments deposited in the EBI Gene Expression Atlas database. The FPKM (fragments per kilobase of transcript per million mapped reads) value is used to measure the expression level. For the abbreviations of the breeds, see supplementary table S1, Supplementary Material online.
Fig. 5
Fig. 5
Analysis of the signatures of positive selection in the genome of Tibetan sheep. Genomic landscape of the (A) XP-EHH values and (B) P-values in the LFMM analysis in the genome of Tibetan sheep. The genes visualized in (A) and (B) are the candidate genes from the signaling pathways of Tibetan sheep in fig. 7A. (C) Number of candidate genes identified in Tibetan sheep by the four methods listed in each of the Venn diagram components. Numbers in parentheses show the number of genes expected by chance.
Fig. 6
Fig. 6
Analysis of the signatures of positive selection in the genome of sheep breeds from the Taklimakan Desert region. Genomic landscape of the (A) XP-EHH values and (B) P-values in the LFMM analysis in the genome of Taklimakan Desert sheep. The genes visualized in (A) and (B) are the candidate genes from the signaling pathways of Taklimakan Desert sheep in fig. 7B. (C) Number of candidate genes identified in Taklimakan Desert sheep by the four methods listed in each of the Venn diagram components. Numbers in parentheses show the number of genes expected by chance.
Fig. 7
Fig. 7
Schematic mechanisms of signaling pathways for genetic adaptations to extreme environments in sheep. (A) Functionally important pathways and associated candidate genes for the genetic adaptations of Tibetan sheep to the plateau environment. (B) Functionally important pathways and associated candidate genes for the genetic adaptations of sheep breeds from the Taklimakan Desert region to the desert environment. The names of the KEGG pathways are shown in blue. The candidate genes positively selected in the two methods of FST and θπ ratio tests are shown in red, in the three methods of FST, θπ ratio, and XP-EHH tests or FST, θπ ratio, and LFMM tests are shown in green, and in all of the four selection tests are shown in purple. Dotted arrows indicate an indirect effect.

References

    1. Alkan C, Coe BP, Eichler EE. 2011. Genome structural variation discovery and genotyping. Nat Rev Genet. 12:363–376. - PMC - PubMed
    1. Barrett JC, Fry B, Maller J, Daly MJ. 2005. Haploview: analysis and visualization of LD and haplotype maps. Bioinformatics 21:263–265. - PubMed
    1. Breyer MD, Breyer RM. 2000. Prostaglandin receptors: their role in regulating renal function. Curr Opin Nephrol Hypertens. 9:23–29. - PubMed
    1. Brown ME, Funk CC. 2008. Food security under climate change. Science 319:580–581. - PubMed
    1. Carroll MA, Balazy M, Margiotta P, Huang DD, Falck JR, McGiff JC. 1996. Cytochrome P-450-dependent HETEs: profile of biological activity and stimulation by vasoactive peptides. Am J Physiol. 271:R863–R869. - PubMed

Publication types