. 2017 Feb;23(3):746-756.
doi: 10.1158/1078-0432.CCR-16-1021. Epub 2016 Jul 11.

Integrated Analysis of Multiple Biomarkers from Circulating Tumor Cells Enabled by Exclusion-Based Analyte Isolation

Affiliations

Integrated Analysis of Multiple Biomarkers from Circulating Tumor Cells Enabled by Exclusion-Based Analyte Isolation

Jamie M Sperger et al. Clin Cancer Res. 2017 Feb.

Abstract

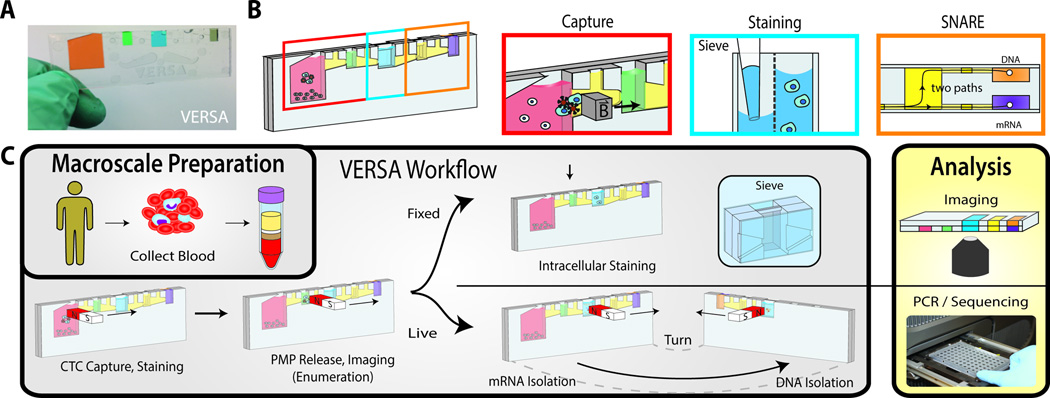
Purpose: There is a critical clinical need for new predictive and pharmacodynamic biomarkers that evaluate pathway activity in patients treated with targeted therapies. A microscale platform known as VERSA (versatile exclusion-based rare sample analysis) was developed to integrate readouts across protein, mRNA, and DNA in circulating tumor cells (CTC) for a comprehensive analysis of the androgen receptor (AR) signaling pathway.

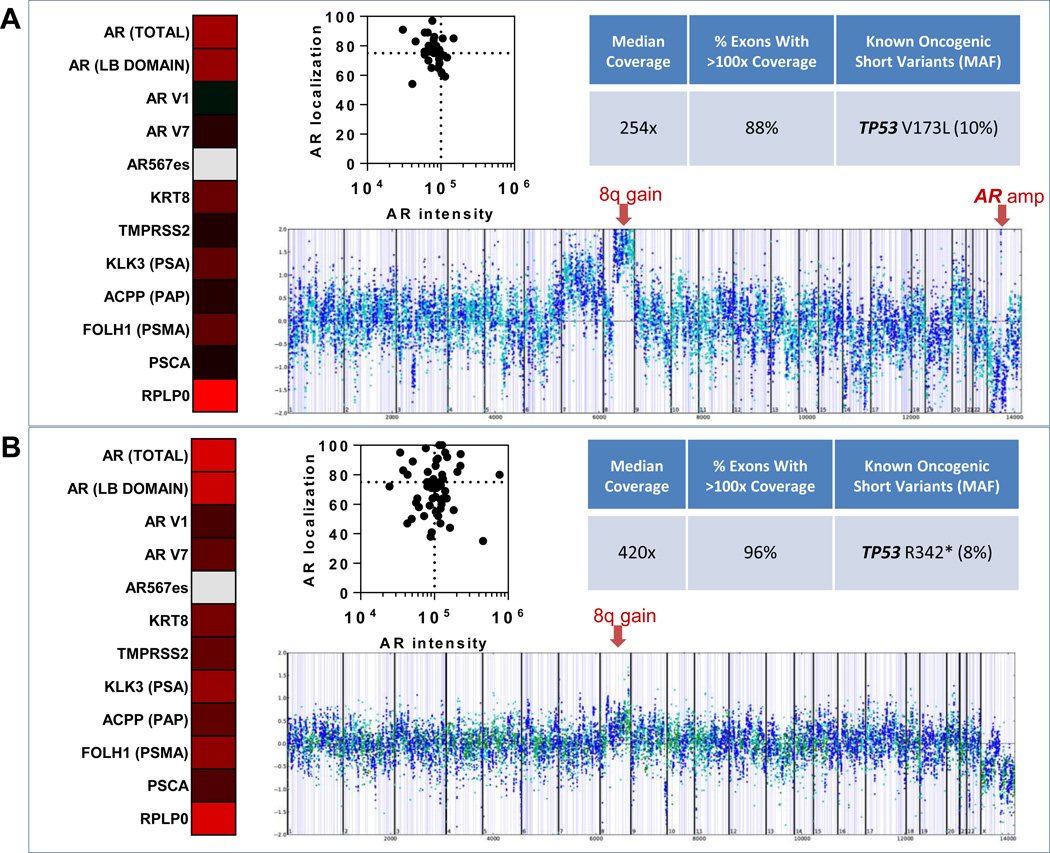
Experimental design: Utilizing exclusion-based sample preparation principles, a handheld chip was developed to perform CTC capture, enumeration, quantification, and subcellular localization of proteins and extraction of mRNA and DNA. This technology was validated across integrated endpoints in cell lines and a cohort of patients with castrate-resistant prostate cancer (CRPC) treated with AR-targeted therapies and chemotherapies.

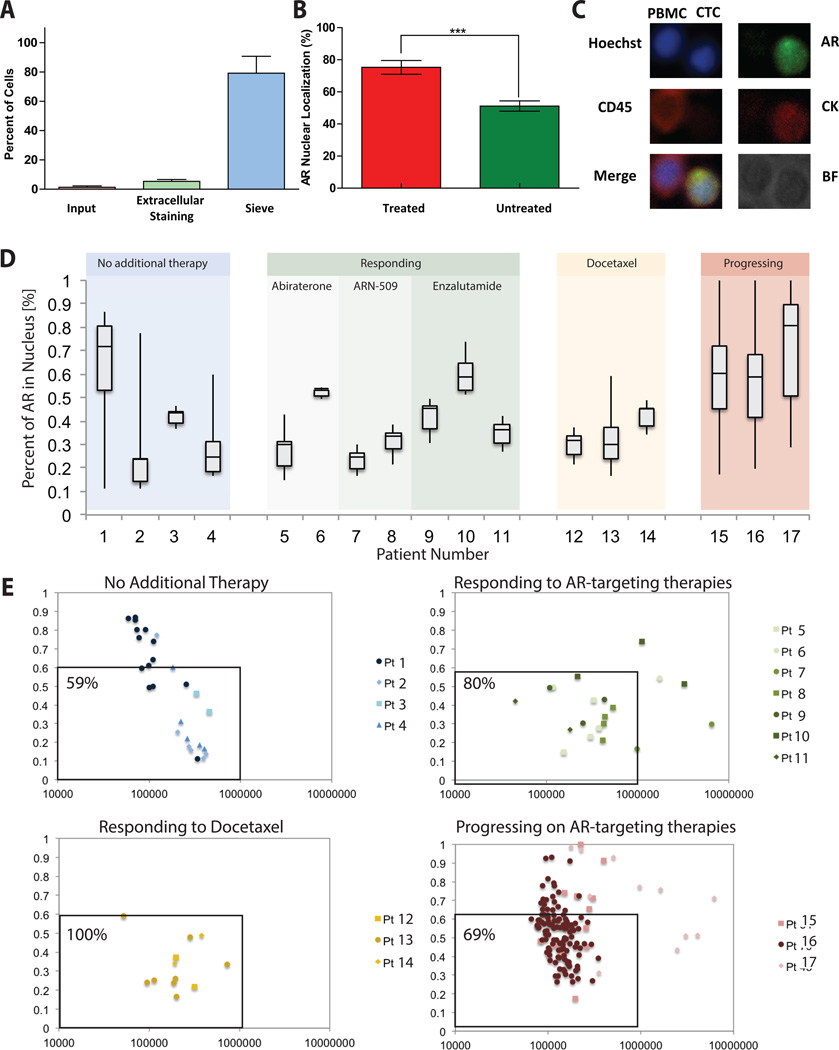
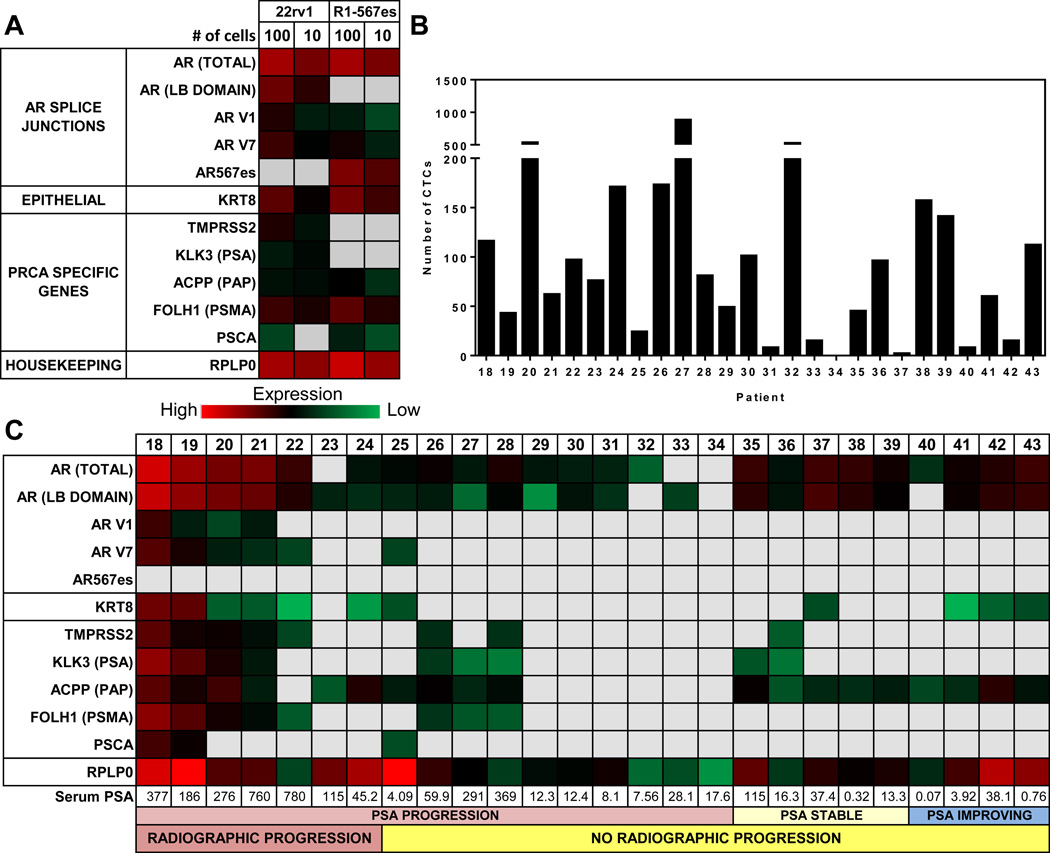
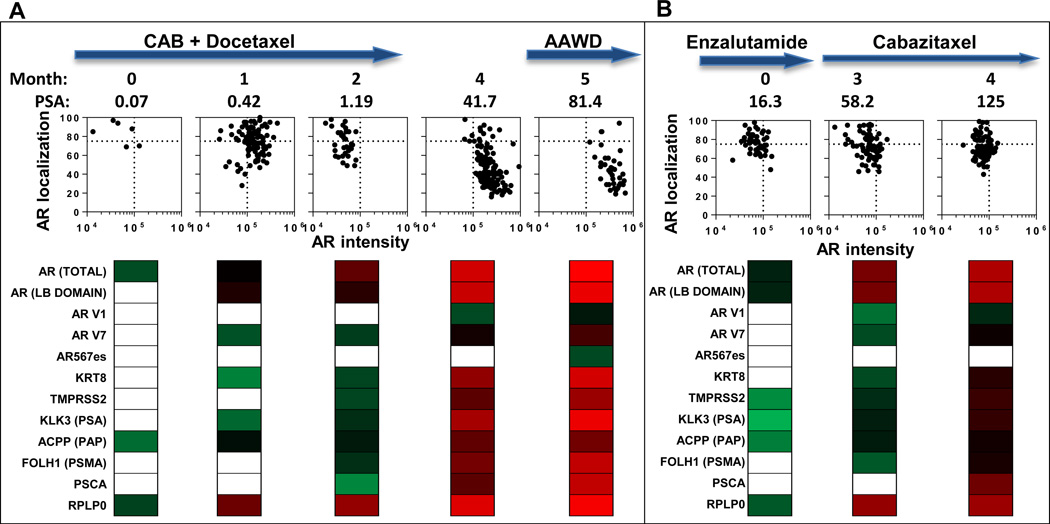
Results: The VERSA was validated in cell lines to analyze AR protein expression, nuclear localization, and gene expression targets. When applied to a cohort of patients, radiographic progression was predicted by the presence of multiple AR splice variants and activity in the canonical AR signaling pathway. AR protein expression and nuclear localization identified phenotypic heterogeneity. Next-generation sequencing with the FoundationOne panel detected copy number changes and point mutations. Longitudinal analysis of CTCs identified acquisition of multiple AR variants during targeted treatments and chemotherapy.

Conclusions: Complex mechanisms of resistance to AR-targeted therapies, across RNA, DNA, and protein endpoints, exist in patients with CRPC and can be quantified in CTCs. Interrogation of the AR signaling pathway revealed distinct patterns relevant to tumor progression and can serve as pharmacodynamic biomarkers for targeted therapies. Clin Cancer Res; 1-11. ©2016 AACR.


Figures

Figure. 1
Figure. 1. The VERSA device
The VERSA integrates efficient cell capture with PMP removal, staining and isolation of mRNA and DNA without dilutive steps. (A) The handheld VERSA is filled with colored dye to differentiate the different chambers. (B) The VERSA is pictured with boxes designating the well used for capture (red), staining (blue) and nucleic acid isolation (orange). (C) A magnet is used to purify PMP-bound CTCs from the input well (pink) through the oil-filled trapezoid into the extracellular staining well (green). After incubation, CTCs are moved into the sieve well (blue), which contains an 8 µm porous membrane, dividing the well into a front and back chamber. The membrane allows low-pressure fluid exchanges to facilitate removal of released and unbound PMPs while preventing cells of interest from passing through. The ability to perform multiple fluid exchanges enables cell permeabilization and incubation with antibodies to intracellular antigens. Cells are imaged in device. mRNA is isolated by lysing cells in device, adding oligo-dT PMPs and moving RNA to the front elution well (orange box, top right). The subsequent addition of silca PMPs with a nuclear lysis buffer enables co-extraction of DNA by magnetic transfer of PMPs to the back well.
Figure 2
Figure 2. AR quantification and nuclear localization in CRPC patients
(A) Approximately 25 calcein-labeled LNCaP cells were spiked into the input well and imaged. Following VERSA procedure, input, extracellular staining and sieve wells were again imaged and LNCaPs counted to determine percent of cells in each well. (B) AR nuclear localization of AR transfected cos-7 cells stimulated with and without mibolerone (AR agonist). Stimulated cells (n=30, mean±SD) showed significantly higher AR nuclear localization as compared to unstimulated cells (p<0.0004). (C) A representative patient PBMC and CTC is shown here stained with CD45 (PBMC) or AR and Cytokeratin (CTC). (D) The percent nuclear localization is shown for 17 CRPC patients grouped by patient treatment and response. Box plots show average and spread (min to max) of the localization percent within CTCs for each patient across different classes of therapy. (E) For each individual CTC within a patient total AR Intensity and AR nuclear localization percentage were plotted for different patient groups.
Figure 3
Figure 3. Gene expression analysis of the AR signaling pathway
(A) Results from quantitiative RT-PCR are presented as Ct values represented as a heat map. mRNA was isolated from the indicated number of cells (n=3) from either 22rv1 or R1-D568 cell lines. (B) Enumeration of CTCs (defined as the number of cells with intact nuclei, CK+, CD45−/7.5 mL blood) from a fixed sample run in parallel to gene expression analysis. (C) mRNA was isolated from Epcam positive fraction from15 mL of EDTA anticoagulated blood. mRNA was reversed transcribed, pre –amplified and probed for the AR gene splice junctions including multiple splice variants and PRCA specific genes.
Figure 4
Figure 4. Longitudinal analysis of patients with CRPC
(A) Pt 40, and (B) Pt 36 were monitored as they progressed through the indicated treatments. Treatment is indicated at the top. The initial blood draw (Month 0) corresponds to (A) cycle 3 of chemohormonal therapy for Pt 40 and (B) cycle 2 of Enzalutamide treatment for Pt 36. For each patient, and at each time point, we present AR nuclear localization verses intensity (each point representing a single CTC). Below each plot, we show panels with gene expression data (represented as a heat map of Ct values). CAB (Combined Androgen Blockade), AAWD (Anti-Androgen Withdrawl)
Figure 5
Figure 5. Multi-parametric analysis of gene expression, genomic profiling and AR protein analysis from captured CTCs
(A) Gene expression and AR protein analysis in a single blood draw from patient 19, and genomic profiling from a subsequent blood draw from this patient. (B) Results shown are from a single blood draw from patient 18. Gene expression data is shown as a heatmap, where red indicates high expression, black median expression, green low expression, and gray no detectable expression. AR protein analysis of CTCs is reported as a graph of AR nuclear localization verses AR intensity. Sequencing coverage and known oncogenic short variants detected using FoundationOne comprehensive genomic profiling are shown along with corresponding copy number plots (each dot represents coverage ratio compared to normal for all exon and intron targets as well as SNPs). Prostate cancer-specific copy number changes are indicated with red arrows (gain of 8q in both patients and focal amplification of AR in patient 19 (A).

References

    1. Lang JM, Casavant BP, Beebe DJ. Circulating tumor cells: getting more from less. Science translational medicine. 2012;4:141ps13. - PubMed
    1. Armstrong AJ, Tannock IF, de Wit R, George DJ, Eisenberger M, Halabi S. The development of risk groups in men with metastatic castration-resistant prostate cancer based on risk factors for PSA decline and survival. Eur J Cancer. 2010;46:517–525. - PubMed
    1. de Bono JS, Scher HI, Montgomery RB, Parker C, Miller MC, Tissing H, et al. Circulating tumor cells predict survival benefit from treatment in metastatic castration-resistant prostate cancer. Clinical cancer research : an official journal of the American Association for Cancer Research. 2008;14:6302–6309. - PubMed
    1. Danila DC, Anand A, Sung CC, Heller G, Leversha MA, Cao L, et al. TMPRSS2-ERG status in circulating tumor cells as a predictive biomarker of sensitivity in castration-resistant prostate cancer patients treated with abiraterone acetate. European urology. 2011;60:897–904. - PMC - PubMed
    1. Scher HI, Morris MJ, Larson S, Heller G. Validation and clinical utility of prostate cancer biomarkers. Nature reviews Clinical oncology. 2013;10:225–234. - PMC - PubMed