. 2016 Jul 25;213(8):1589-608.
doi: 10.1084/jem.20151467. Epub 2016 Jul 11.

Unique and shared signaling pathways cooperate to regulate the differentiation of human CD4+ T cells into distinct effector subsets

Affiliations

Unique and shared signaling pathways cooperate to regulate the differentiation of human CD4+ T cells into distinct effector subsets

Cindy S Ma et al. J Exp Med. .

Abstract

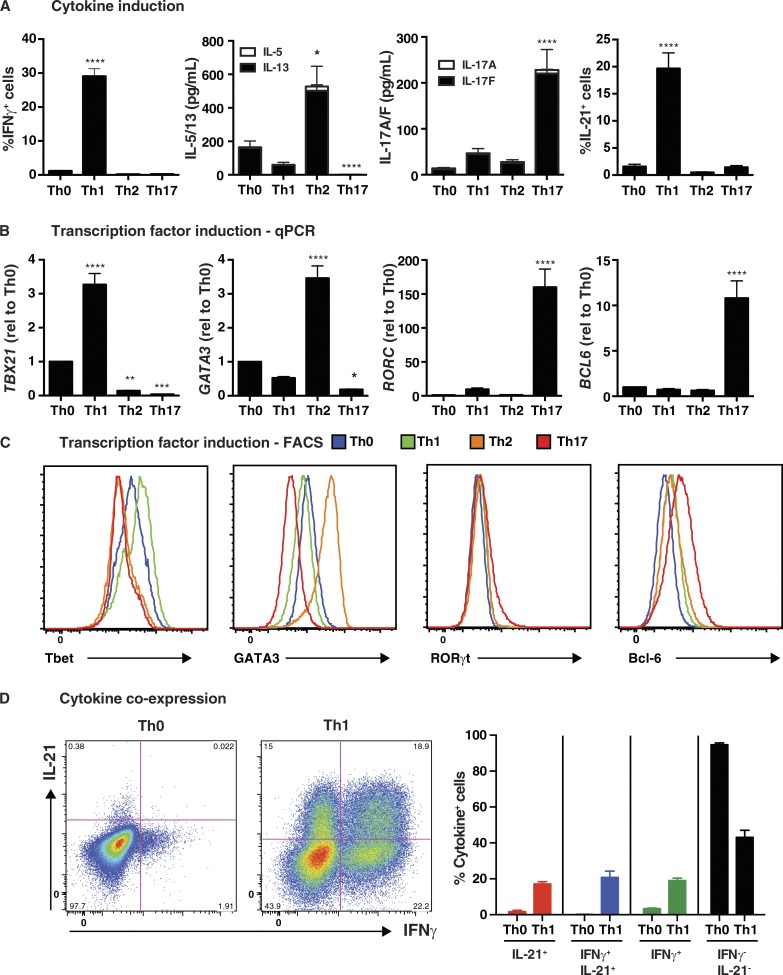
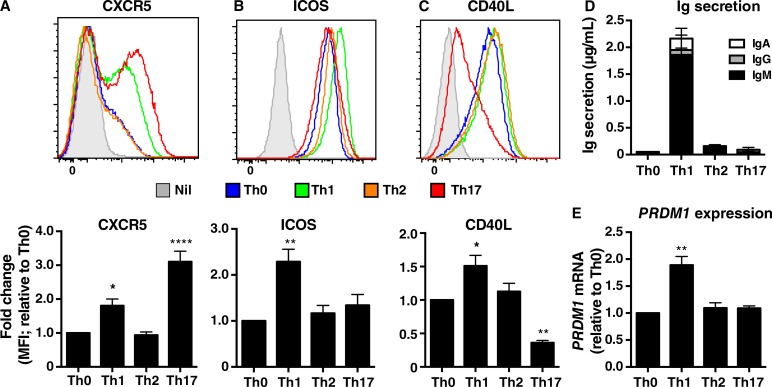
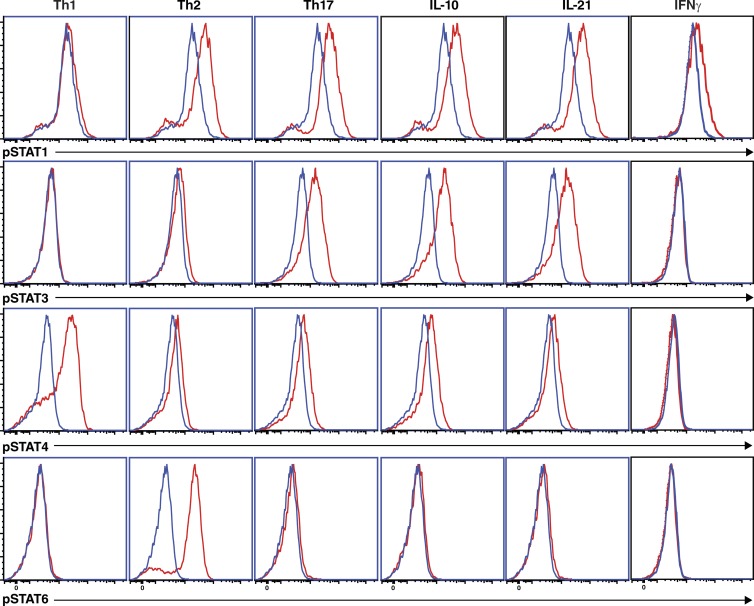
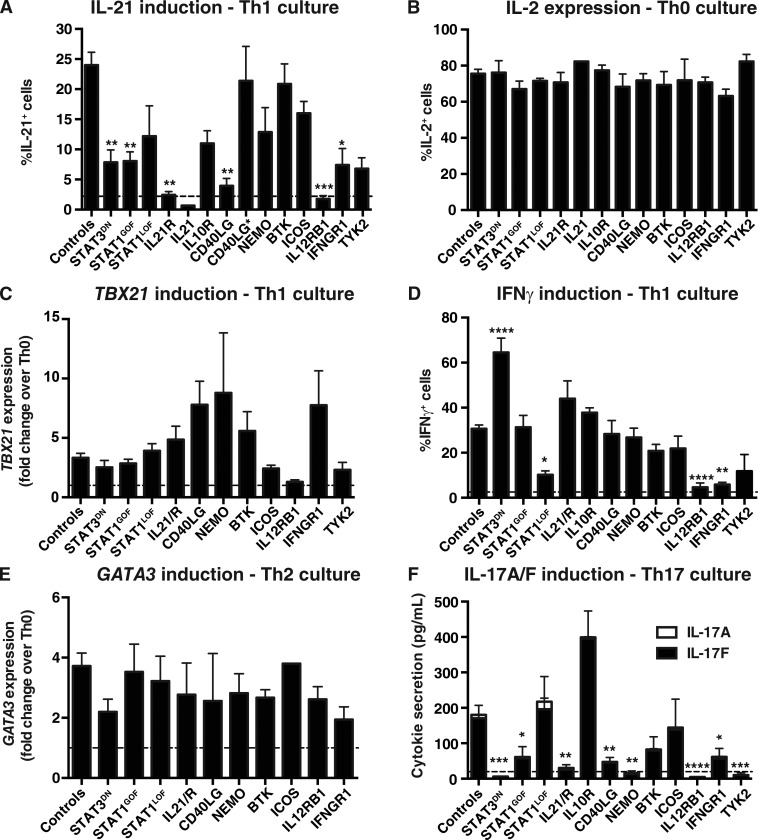
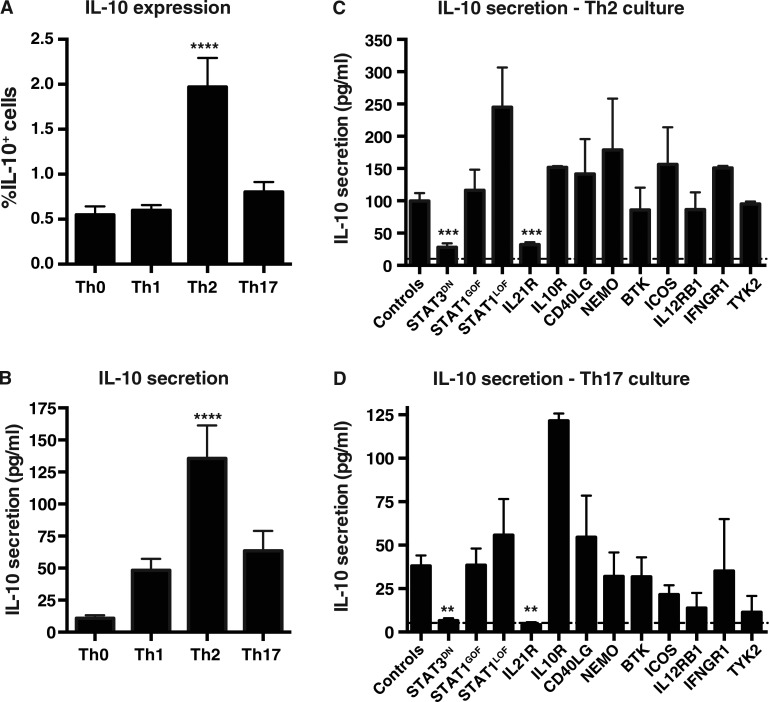
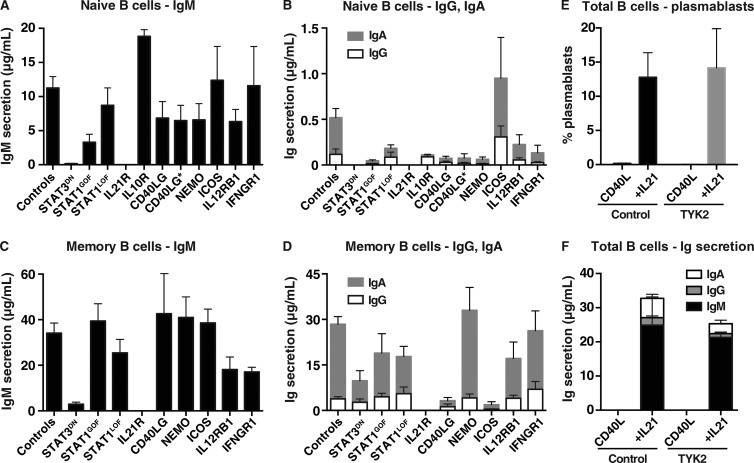
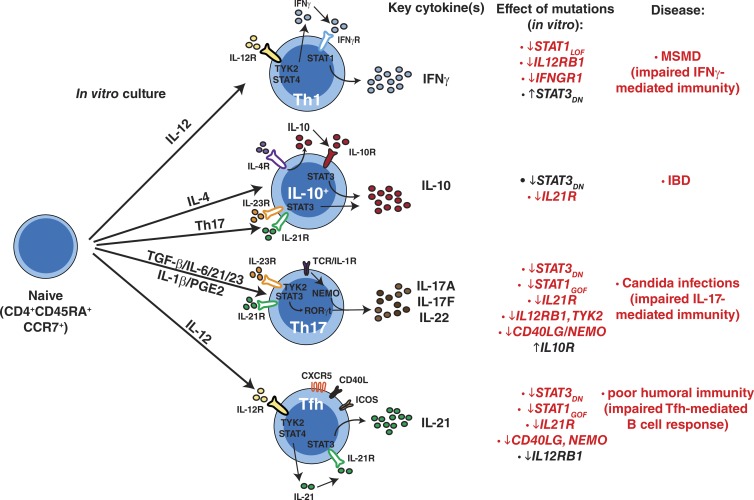
Naive CD4(+) T cells differentiate into specific effector subsets-Th1, Th2, Th17, and T follicular helper (Tfh)-that provide immunity against pathogen infection. The signaling pathways involved in generating these effector cells are partially known. However, the effects of mutations underlying human primary immunodeficiencies on these processes, and how they compromise specific immune responses, remain unresolved. By studying individuals with mutations in key signaling pathways, we identified nonredundant pathways regulating human CD4(+) T cell differentiation in vitro. IL12Rβ1/TYK2 and IFN-γR/STAT1 function in a feed-forward loop to induce Th1 cells, whereas IL-21/IL-21R/STAT3 signaling is required for Th17, Tfh, and IL-10-secreting cells. IL12Rβ1/TYK2 and NEMO are also required for Th17 induction. Strikingly, gain-of-function STAT1 mutations recapitulated the impact of dominant-negative STAT3 mutations on Tfh and Th17 cells, revealing a putative inhibitory effect of hypermorphic STAT1 over STAT3. These findings provide mechanistic insight into the requirements for human T cell effector function, and explain clinical manifestations of these immunodeficient conditions. Furthermore, they identify molecules that could be targeted to modulate CD4(+) T cell effector function in the settings of infection, vaccination, or immune dysregulation.


Figures

Figure 1.
Figure 1.
In vitro induction of features of Tfh cells in human naive CD4+ T cells. Naive CD4+ T cells were isolated from peripheral blood of healthy donors, and then cultured with T cell activation and expansion (TAE) beads alone (Th0) or under Th1 (+IL-12), Th2 (+IL-4), or Th17 (+TGF-β, IL-1β, IL-6, IL-21, IL-23, and PGE2) conditions for 5 d. After this time, the cells were harvested and analyzed for (A) production of IFN-γ, IL-5/IL-13, IL-17A/IL-17F, and IL-21 by intracellular staining or cytometric bead array (CBA; mean ± SEM; n = 8–17); and (B and C) expression of TBX21/Tbet, GATA3, RORC/Rorγt, or BCL6 by qPCR (B) or flow cytometry (C). The graphs in B correspond to the fold change (mean ± SEM; n = 10–17) in expression of the indicated transcription factor relative to Th0 culture. Histograms depicted in C are representative of three to five independent experiments. (D) Coexpression of IL-21 and IFN-γ by Th0- or Th1-stimulated human naive CD4+ T cells was determined by intracellular staining and flow cytometry. The graphs depicts the mean ± SEM of cytokine-expressing cells derived from nine different experiments. *, P < 0.05; **, P < 0.01; ***, P < 0.001; ****, P < 0.0001, compared with Th0 (ANOVA).
Figure 2.
Figure 2.
IL-12 selectively induces Tfh phenotype and function in human naive CD4+ T cells. Peripheral blood naive CD4+ T cells were cultured in media only (Nil) or with TAE beads alone (Th0) or under Th1, Th2, or Th17 conditions. (A–C) After 3 d, the cells were harvested and expression of (A) CXCR5, (B) ICOS, and (C) CD40L were determined by flow cytometry. The histogram plots (top) depict expression of the indicated surface receptor by cells cultured in media (solid gray) or under Th0 (blue), Th1 (green), Th2 (orange), or Th17 (red) conditions. The graphs (bottom) represent fold change in expression of the indicated cell surface marker relative to the Th0 culture (mean ± SEM; n = 4). *, P < 0.05; **, P < 0.01; ****, P < 0.0001 compared with Th0 (ANOVA). (D and E) After 5 d, activated CD4+ T cells were treated with mitomycin C and co-cultured with sort-purified allogeneic naive B cells in the presence of TAE beads for 7 d. (D) Secretion of IgM, IgG, and IgA (n = 3) and (E) expression of PRDM1 (Blimp1; n = 2) relative to the Th0 cultures were determined by ELISA and qPCR, respectively. Values represent mean ± SEM. **, P < 0.01.
Figure 3.
Figure 3.
Differential induction of STAT activation by in vitro–polarizing conditions. Naive CD4+ T cells were cultured with TAE beads for 4 d. After this time, the cells were harvested, and then cultured in media alone (blue histogram) or under Th1 (+IL-12), Th2 (+IL-4), or Th17 (+TGF-β, IL-1β, IL-6, IL-21, IL-23, and PGE2) conditions, or with IL-10, IL-21, or IFN-γ (red histograms) for 30 min. Phosphorylation of STAT1, STAT3, STAT4, and STAT6 was determined by intracellular staining and flow cytometry. The data are representative of experiments performed on cells from two to three different donors.
Figure 4.
Figure 4.
Impact of disease-causing mutations on differentiation of naive CD4+ T cells to Th1, Th2, Th17, and Tfh fates in vitro. Naive CD4+ T cells were isolated from peripheral blood of healthy donors or patients with mutations in STAT3, STAT1, IL21/R, IL10R, CD40LG, NEMO, BTK, ICOS, IL12RB1, IFNGR1, or TYK2, and then cultured with TAE beads alone (Th0) or under Th1/Tfh (+IL-12), Th2 (+IL-4), or Th17 (+TGF-β, IL-1β, IL-6, IL-21, and IL-23) conditions for 5 d. Cells were then harvested and analyzed for expression of cytokines and transcription factors. (A) Percentage of cells expressing IL-21 in response to Tfh/IL-12 stimulation. (B) Percentage of cells expressing IL-2 in Th0 culture. (C and D) Induction of TBX21 (C) and IFN-γ (D) expression after Th1/IL-12–polarizing culture. (E) Induction of GATA3 in response to Th2/IL-4 stimulation. (F) Induction of IL-17A and IL-17F secretion after Th17-polarizing culture. Controls, n = 17–48; STAT3DN, n = 2–10; STAT1GOF, n = 5–14; STAT1LOF, n = 3–8; IL21R, n = 3–5 experiments; IL21 n = 1; IL10R, n = 1–2; CD40LG, n = 3–9 (CD40LG* (MILD), n = 3); NEMO, n = 2–7; BTK, n = 5–8; ICOS, n = 2–7; IL12RB1, n = 3–8; IFNGR1, n = 2–6; TYK2, n = 2–3. *, P < 0.05; **, P < 0.01; ***, P < 0.001; ****, P < 0.0001, compared with Th0 (ANOVA; Student’s t test). The dashed lines indicate the mean percentage of IL-21+ (A) or IFN-γ+ (D) cells, or secretion of IL-17A/F (F), detected under Th0 conditions. Note that data for IL-17A/F production by TYK2-deficient naive CD4+ T cells was presented in Kreins et al. (2015), but is shown here for comparison.
Figure 5.
Figure 5.
Induction of IL-10 by Th2- and Th17-polarizing cultures is compromised by mutations in IL21R and STAT3. (A and B) Naive CD4+ T cells from healthy donors were cultured with TAE beads alone (Th0) or under Th1, Th2, or Th17 conditions for 5 d. After this time, the cells were harvested and analyzed for IL-10 production by intracellular staining and flow cytometry (A; n = 15) or CBA (n = 24). Values represent mean ± SEM. ****, P < 0.0001 compared with Th0 (ANOVA). (C and D) Naive CD4+ T cells from healthy donors or patients were cultured with TAE beads alone (Th0) or under Th2 (C) or Th17 (D) conditions for 5 d. IL-10 secretion was determined by CBA. Values represent mean ± SEM; dashed line indicates the mean level of IL-10 secretion under Th0 conditions. Controls, n = 31–35; STAT3DN, n = 6–8; STAT1GOF, n = 8; STAT1LOF, n = 4–5; IL21R, n = 4–5; IL10R, n = 1–2; CD40LG, n = 5; NEMO, n = 2–3; BTK, n = 7; ICOS, n = 3; IL12RB1, n = 5–6; IFNGR1, n = 2–5; TYK2, n = 2–3. **, P < 0.01; ***, P < 0.001, compared with controls (ANOVA; Student’s t test).
Figure 6.
Figure 6.
Unsupervised clustering of CD4+ T cells from PID and normal healthy donors by nonnegative matrix factorization (NMF). (A) Heat map of log2-transformed expression data, with genes organized into naive and memory metagenes. Expression levels are indicated by the color scale, with red and blue respectively representing high and low relative expression. (B) Visualization of expression levels of naive and memory metagenes by memory CD4+ T cells and naive CD4+ T cells from normal healthy donors and PID patients. Naive CD4+ T cells clustered tightly together and could not be distinguished from each other irrespective of genotype.
Figure 7.
Figure 7.
Disease-causing mutations do not compromise proliferation of naive CD4+ T cells. Naive CD4+ T cells from healthy donors (solid gray histograms) and patients (overlay black histograms) with the indicated gene mutations were labeled with CFSE, and then cultured with TAE beads (Th0) for 5 d. After this time, the cells were harvested and analyzed for proliferation by assessing CFSE dilution. Histograms are representative of experiments performed using naive CD4+ T cells from nine different healthy controls, two patients with mutations in STAT3, STAT1, CD40LG, NEMO, BTK, IL12RB1, or IFNGR1, or individual patients with mutations in IL21R, IL10R, or ICOS.
Figure 8.
Figure 8.
Impaired Tfh function of naive CD4+ T cells caused by mutations affecting IL-21/STAT3 signaling or cognate T–B cell interactions. (A) Naive CD4+ T cells from healthy controls or PID patients cultured under Th0 or Th1 conditions that induce a Tfh phenotype for 5 d were then treated with mitomycin C and co-cultured with sort-purified normal allogeneic naive B cells in the presence of TAE beads. Secretion of IgM was determined after 7 d; values are expressed as IgM secretion (mean ± SEM) as a percentage of the response induced by normal naive CD4+ T cells assessed concurrently. Controls, n = 33; STAT3DN, n = 6; STAT1GOF, n = 8; STAT1LOF, n = 4; IL21R, n = 5; IL21, n = 1; IL10R, n = 2; CD40LG, n = 5; CD40LG*, n = 3; NEMO, n = 3; BTK, n = 7; ICOS, n = 4; IL12RB1, n = 4; TYK2, n = 1. (B and C) Co-cultures described in A were supplemented with exogenous IL-21 (B) or CD40L (C) on day 0; IgM secretion was determined after 7 d. The dotted line indicates the relative response (mean ± SEM) of control naive CD4+ T cells (normalized to 100%). (D) Naive CD4+ T cells from healthy controls or patients with STAT3DN, IL21R, or BTK LOF mutations or STAT1 GOF mutations were cultured under Th0, Th1/Tfh, or Th17 conditions. After 3 d, the cells were harvested, and expression of CXCR5, CD40L, or ICOS was determined by flow cytometry. The histogram plots depict expression of the indicated surface receptor on cells cultured under Th0 (blue), Th1/Tfh (green), or Th17 (red) conditions. The graphs represent fold change (mean ± SEM) in expression of the indicated cell surface marker normalized to the Th0 culture (dashed line). Controls, n = 5; STAT3LOF, n = 3; STAT1GOF, n = 2; IL21R, n = 2; BTK, n = 3.
Figure 9.
Figure 9.
Functional in vitro responses of naive and memory B cells from immunodeficient patients. Naive (A and B) and memory (C and D) B cells were isolated from the peripheral blood of healthy donors or patients with mutations in STAT3, STAT1 (LOF/GOF), IL21R, IL10R, CD40LG (null and hypomorphic [CD40LG*]), NEMO, ICOS, IL12RB1, or IFNGR1, and then cultured with CD40L/IL-21. Secretion of IgM (A and C), IgG and IgA (B and D) was determined after 7 d by Ig heavy chain specific ELISAs. Values represent mean ± SEM. Controls, n = 25; STAT3DN, n = 6; STAT1GOF, n = 9; STAT1LOF, n = 6; IL21R, n = 4; IL10R, n = 2; CD40LG, n = 4; NEMO, n = 5; ICOS, n = 4; IL12R, n = 5; IFNGR1, n = 6. (E and F) total B cells were isolated from healthy donors or patients with mutations in TYK2 (n = 3), and then cultured with CD40L alone or CD40L/IL-21. (E) The proportion of cells acquiring a plasmablast phenotype (CD38hiCD27hi) was determined after 5 d by flow cytometry. (F) Ig secretion was determined after 7 d.
Figure 10.
Figure 10.
Impact of monogenic mutations on differentiation of human naive CD4+ T cells. Pathways of human naive CD4+ T cell differentiation in vitro and how specific mutations compromise these processes. MSMD, Mendelian susceptibility to mycobacterial disease; IBD, inflammatory bowel disease. The corresponding diseases listed occur in individuals with gene mutations that are shown in red type. The genes shown in black type do not result in the indicated disease states.

Similar articles

Cited by

References

    1. Annunziato F., Cosmi L., Santarlasci V., Maggi L., Liotta F., Mazzinghi B., Parente E., Filì L., Ferri S., Frosali F., et al. . 2007. Phenotypic and functional features of human Th17 cells. J. Exp. Med. 204:1849–1861. 10.1084/jem.20070663 - DOI - PMC - PubMed
    1. Avery D.T., Deenick E.K., Ma C.S., Suryani S., Simpson N., Chew G.Y., Chan T.D., Palendira U., Bustamante J., Boisson-Dupuis S., et al. . 2010. B cell-intrinsic signaling through IL-21 receptor and STAT3 is required for establishing long-lived antibody responses in humans. J. Exp. Med. 207:155–171. 10.1084/jem.20091706 - DOI - PMC - PubMed
    1. Batten M., Ramamoorthi N., Kljavin N.M., Ma C.S., Cox J.H., Dengler H.S., Danilenko D.M., Caplazi P., Wong M., Fulcher D.A., et al. . 2010. IL-27 supports germinal center function by enhancing IL-21 production and the function of T follicular helper cells. J. Exp. Med. 207:2895–2906. 10.1084/jem.20100064 - DOI - PMC - PubMed
    1. Becattini S., Latorre D., Mele F., Foglierini M., De Gregorio C., Cassotta A., Fernandez B., Kelderman S., Schumacher T.N., Corti D., et al. . 2015. T cell immunity. Functional heterogeneity of human memory CD4+ T cell clones primed by pathogens or vaccines. Science. 347:400–406. 10.1126/science.1260668 - DOI - PubMed
    1. Boisson-Dupuis S., Bustamante J., El-Baghdadi J., Camcioglu Y., Parvaneh N., El Azbaoui S., Agader A., Hassani A., El Hafidi N., Mrani N.A., et al. . 2015. Inherited and acquired immunodeficiencies underlying tuberculosis in childhood. Immunol. Rev. 264:103–120. 10.1111/imr.12272 - DOI - PMC - PubMed

Publication types

MeSH terms