. 2016 Jul 25;213(8):1441-58.
doi: 10.1084/jem.20151780. Epub 2016 Jul 11.

Identification of embryonic precursor cells that differentiate into thymic epithelial cells expressing autoimmune regulator

Affiliations

Identification of embryonic precursor cells that differentiate into thymic epithelial cells expressing autoimmune regulator

Nobuko Akiyama et al. J Exp Med. .

Abstract

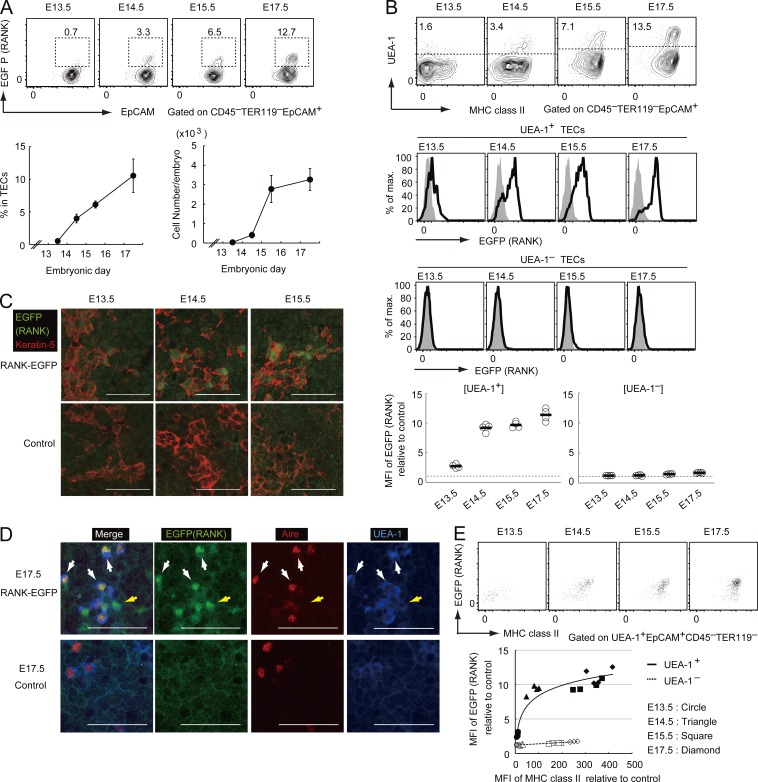
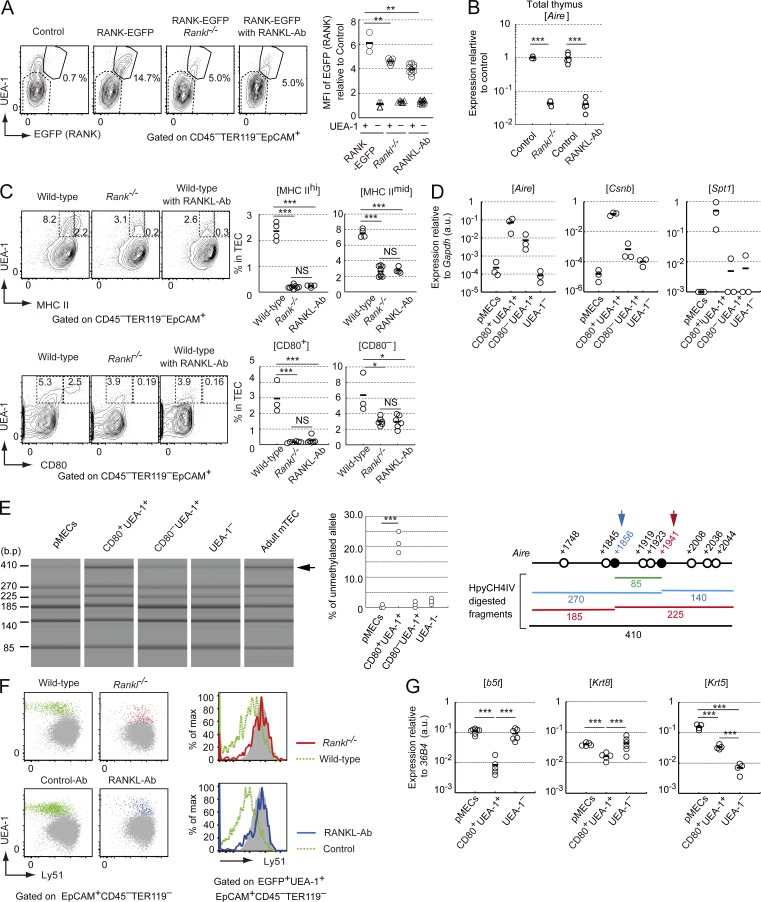
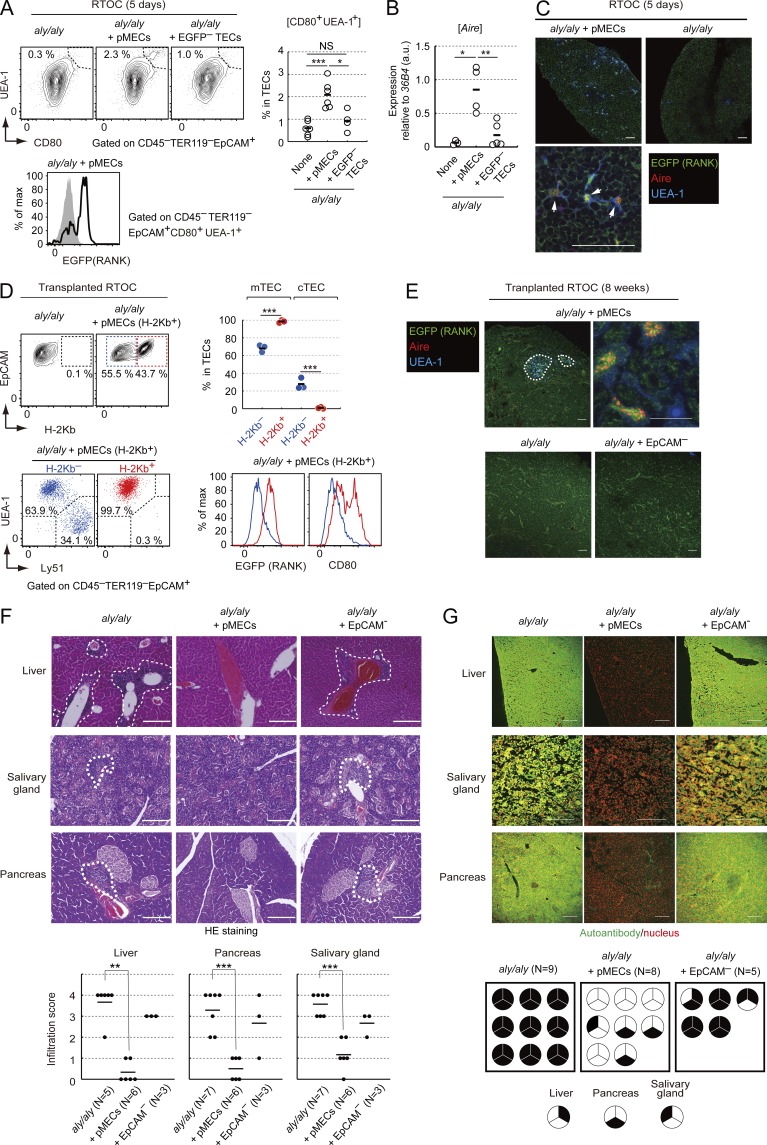
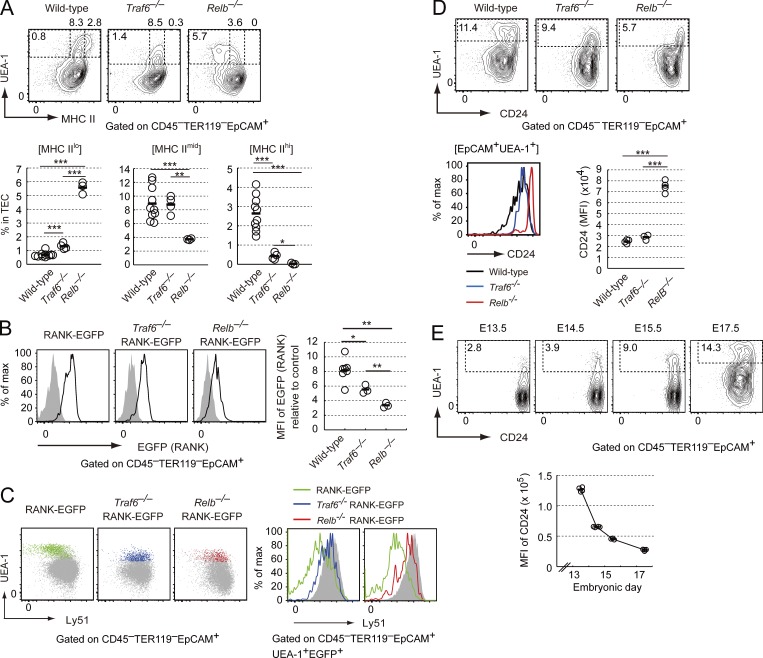
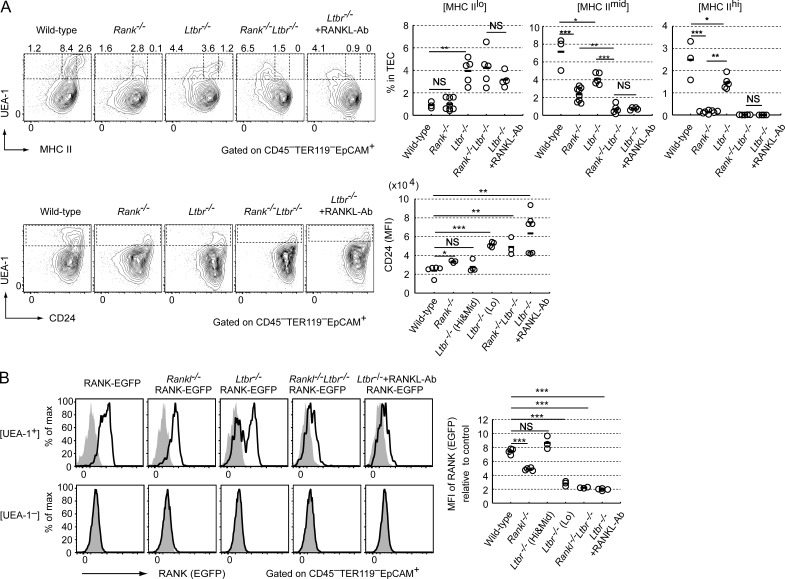
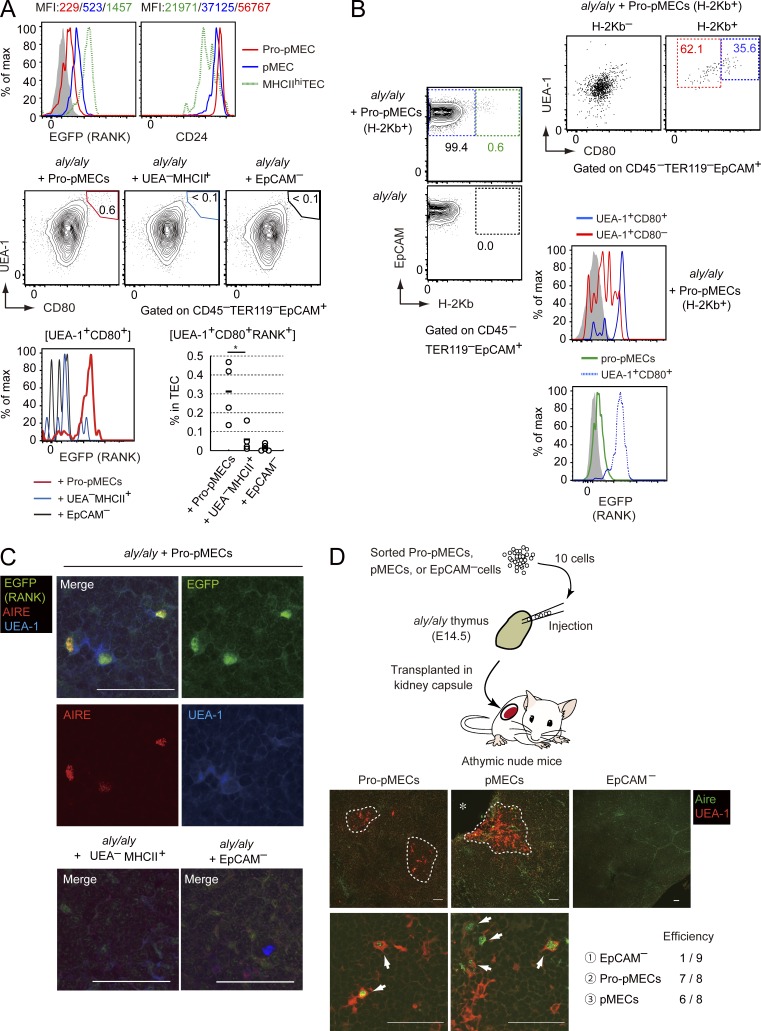
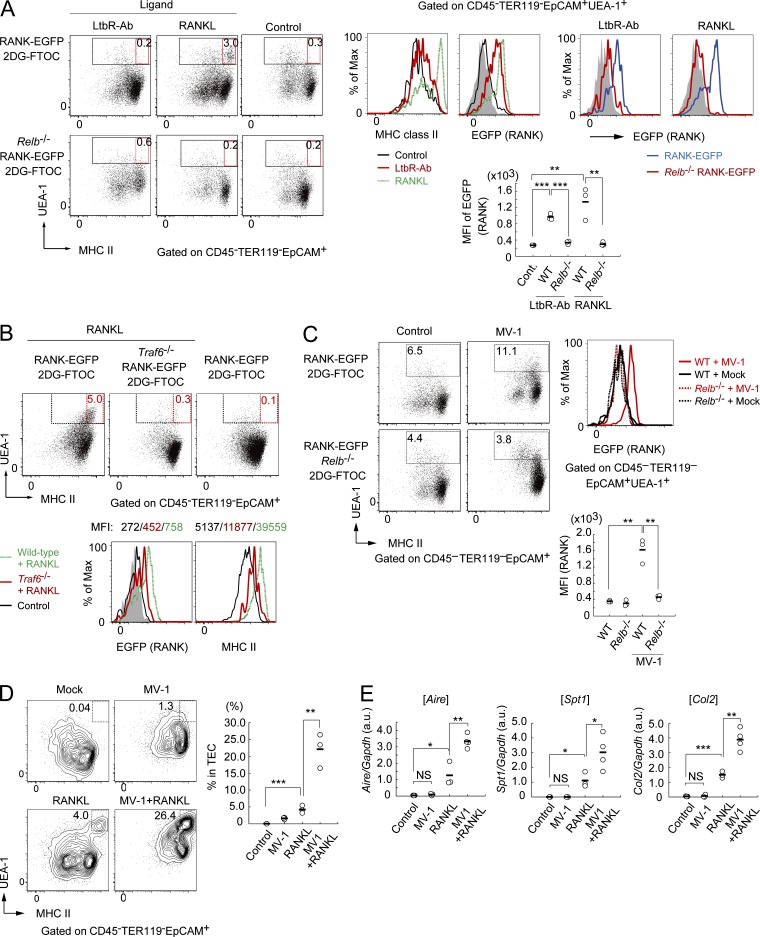
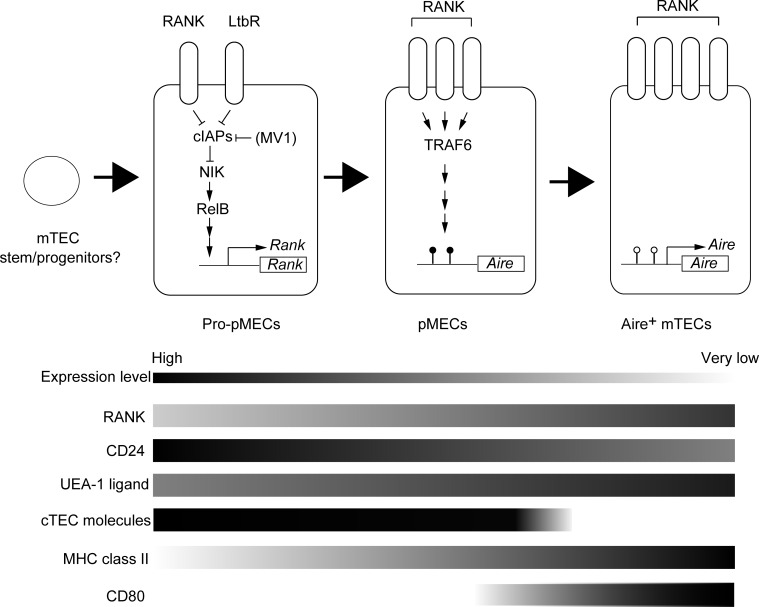
Medullary thymic epithelial cells (mTECs) expressing autoimmune regulator (Aire) are critical for preventing the onset of autoimmunity. However, the differentiation program of Aire-expressing mTECs (Aire(+) mTECs) is unclear. Here, we describe novel embryonic precursors of Aire(+) mTECs. We found the candidate precursors of Aire(+) mTECs (pMECs) by monitoring the expression of receptor activator of nuclear factor-κB (RANK), which is required for Aire(+) mTEC differentiation. pMECs unexpectedly expressed cortical TEC molecules in addition to the mTEC markers UEA-1 ligand and RANK and differentiated into mTECs in reaggregation thymic organ culture. Introduction of pMECs in the embryonic thymus permitted long-term maintenance of Aire(+) mTECs and efficiently suppressed the onset of autoimmunity induced by Aire(+) mTEC deficiency. Mechanistically, pMECs differentiated into Aire(+) mTECs by tumor necrosis factor receptor-associated factor 6-dependent RANK signaling. Moreover, nonclassical nuclear factor-κB activation triggered by RANK and lymphotoxin-β receptor signaling promoted pMEC induction from progenitors exhibiting lower RANK expression and higher CD24 expression. Thus, our findings identified two novel stages in the differentiation program of Aire(+) mTECs.


Figures

Figure 1.
Figure 1.
RANK expression in UEA-1+ TECs was increased with embryonic thymic development. (A) Flow cytometric analysis of EGFP expression in TECs from embryonic RANK-EGFP mice. Percentages of EGFP+EpCAM+ cells in TECs and cell numbers are shown on the bottom. Error bars represent the SD. n = 4 for each age group. (B) Flow cytometric analysis of EGFP expression in UEA-1+ TECs from RANK-EGFP embryonic mice. (top) UEA-1 and MHCII. (bottom and bottom middle) RANK expression (EGFP) in UEA-1+ TECs and UEA-1 TECs, respectively. Bold lines represent profiles of RANK-EGFP mice. Shaded regions indicate backgrounds of age-matched control mice. (bottom) median fluorescence intensity (MFI) values relative to the control. Black bars, mean values. n = 4 for each age group. Dotted lines, relative MFI of 1. (C) Immunohistochemical analysis of thymic sections from RANK-EGFP and control mice. EGFP (green) and keratin-5 (red) are shown. Bars, 50 µm. Data are representative of three independent experiments. (D) Immunohistochemical analysis of thymic sections from E17.5 RANK-EGFP mice (top) and wild-type mice (bottom) stained with anti-EGFP (green), anti-Aire (red), and anti–UEA-1 (blue). White arrows, cells expressing EGFP, Aire, and UEA-1 ligand; yellow arrows: cells expressing EGFP and UEA-1-ligand. Bars, 50 µm. Data are representative of three independent experiments. (E) Correlations between EGFP (RANK) and MHCII expression. (top) Profiles of EGFP and MHCII expression. (bottom) MFIs of EGFP expression in TECs of RANK-EGFP mice relative to that in control EpCAM cells are plotted against the MFI of MHC class II in TECs relative to that in control EpCAM cells. Closed and open notations indicate UEA-1+ TECs and UEA-1 TECs, respectively. Each data point is derived from one embryo. The solid line shows the fitting curve between relative MFIs of RANK and MHCII expression. n = 4 for each age group.
Figure 2.
Figure 2.
pMECs expressed low levels of mTEC maturation markers and high levels of cTEC molecules. (A) Flow cytometric analysis of EGFP+UEA-1+ TECs from RANK-EGFP mice, Rankl−/− RANK EGFP mice, and RANK-EGFP mice treated with anti–RANKL-Ab at E17.5. The left panel (control) shows the profile of wild-type mice. Percentages of EGFP+UEA+ in TECs are shown. MFIs of EGFP relative to each control in UEA-1+ TECs (circles) and UEA-1 TECs (triangles) are summarized in the graph. n = 3 for RANK-EGFP. n = 6 for Rankl−/− RANK EGFP mice and n = 10 for RANK-EGFP mice treated with anti-RANKL-Ab. Black bars: mean values. **, P < 0.01, two-tailed Student’s t test. (B) Aire mRNA expression in the embryonic thymi of RANKL-Ab–treated mice and Rankl−/− mice. Aire expression in the total thymus of E17.5 Rankl−/− mice, E17.5 mice treated with RANKL-Ab, and corresponding control treated mice was analyzed by qPCR. Expression levels were calculated as arbitrary units normalized to 36B4 mRNA expression. Expression levels relative to the mean of the control were plotted in the graph for comparisons between two sets. Black bars indicate mean values. n = 3 for Rankl−/− and control mice. n = 5 for RANKL-Ab–treated mice and control mice. ***, P < 0.001, two-tailed Student’s t test. (C) Flow cytometric analysis of mTECs from embryonic Rankl−/− mice, Rank−/− mice, wild-type mice treated with RANKL-Ab, and control wild-type mice at E17.5. (left) typical profiles of TECs. (top and bottom) Percentages of UEA-1+MHCIIhi and UEA-1+MHCIImid in total TECs and UEA-1+CD80+ and UEA-1+CD80, respectively. n = 4 for wild-type embryos and wild-type embryos treated with RANKL-Ab. n = 8 for Rank−/− embryos in upper graphs. n = 3 for wild-type embryos. n = 6 for Rankl−/− embryos and wild-type embryos treated with RANKL-Ab in lower graphs. Black bars indicate mean values. *, P < 0.05; ***, P < 0.001; and NS, not significant (two-tailed Student’s t test). (D) Aire, Csnb, and Spt1 mRNA expression in pMECs, CD80+ TECs, CD80 TECs, and UEA-1 TECs, as determined by qPCR. CD80+ TECs, CD80 TECs, and UEA-1 TECs were sorted from E17.5 wild-type thymi (Fig. S1). n = 3 for each samples. The values are arbitrary units normalized to Gapdh mRNA expression. Black bars indicate mean values. (E) CpG methylation analysis of the Aire gene in pMECs, CD80+ TECs, CD80 TECs, and UEA-1 TECs by combined bisulfite restriction analysis (COBRA). CD80+ TECs, CD80 TECs, and UEA-1 TECs were sorted from E17.5 wild-type thymi (Fig. S1). A typical gel electropherogram of COBRA is shown. The arrow indicates the band that was not digested with the methylation-sensitive restriction enzyme HpyCH13IV. Percentages of unmethylated CpGs are summarized in the right graph. n = 3 for each sample. ***, P < 0.001, two-tailed Student’s t test. (right) Aire gene structure and predicted length of the HpyCH13IV digestion fragment. The red and blue arrows in the lower panels indicate the T-DMR of the Aire gene. (F) Flow cytometric analysis of Ly51 expression in pMECs at E17.5. Typical profiles of UEA-1 and Ly51 staining (left) in TECs and Ly51 expression in RANK+UEA-1+ TECs (right) are shown. Profiles of RANK+UEA-1+ TECs are shown as color dots and lines. Green dots and lines, RANK-EGFP mice (wild-type, n = 3) or control-Ab-treated RANK-EGFP mice (control, n = 3); red dots and lines, Rankl−/− RANK-EGFP mice (n = 3); and blue dots and lines, RANK-EGFP mice treated with RANKL-Ab (blue line, n = 3) at E17.5. Shaded dots and regions indicate UEA-1 TECs. Data are representative of each sample. (G) b5t, Krt8, and Krt5 mRNA expression in pMECs, CD80+ TECs, and UEA-1 TECs, as determined by qPCR. pMECs and other TECs were sorted from RANKL-Ab–treated E17.5 RANK-EGFP mice and untreated E17.5 wild-type mice (see also Fig. S1). Values are arbitrary units normalized to 36B4 mRNA expression. n = 8 for pMECs, n = 5 for CD80+ TECs, and n = 8 for UEA-1 TECs for b5t and Krt8 expression. n = 4 for Krt5 expression. Black bars, mean values. ***, P < 0.001, two-tailed Student’s t test.
Figure 3.
Figure 3.
pMECs differentiated into Aire-expressing mTECs inducing self-tolerance. (A) Flow cytometric analysis of reaggregation thymic organ culture (RTOC) derived from aly/aly embryonic thymic cells and pMECs. (left) typical flow cytometric profiles. Data are summarized in a right figure. (bottom) EGFP expression profiles in CD80+UEA-1+ TECs (solid line) and UEA-1 TECs (shaded region). n = 6 for aly/aly RTOC with pMECs and aly/aly RTOC. n = 4 for aly/aly RTOC with UEA-1EGFP TECs. pMECs and UEA-1EGFP TECs were sorted from RANKL-Ab–treated E17.5 RANK-EGFP mice. Black bars, mean values. *, P < 0.05; ***, P < 0.001, two-tailed Student’s t test. (B) qPCR analysis of Aire mRNA in aly/aly RTOC, aly/aly RTOC with pMECs, and aly/aly RTOC with UEA-1EGFP TECs. Values are arbitrary units normalized to 36B4 mRNA expression. n = 3 for aly/aly RTOC, n = 4 for aly/aly RTOC with pMECs, and n = 5 for aly/aly RTOC with UEA-1EGFP TECs. Black bars, mean values. *, P < 0.05; ***, P < 0.001, two-tailed Student’s t test. (C) Immunohistochemical analysis of RTOCs consisting of the aly/aly embryonic thymus and pMECs. EGFP (green), Aire (red), and UEA-1 (blue) are shown. Arrows: cells expressing Aire, EGFP (RANK), and UEA-1 ligand. Bars, 50 µm. Data are representative of three independent experiments. (D) Flow cytometric analysis of the thymus generated from RTOC by kidney transplantation. Typical profiles of EpCAM and H-2Kb staining (top left) and UEA-1 and Ly51 staining (bottom left) are shown. Percentages of mTECs (UEA-1+Ly51) and cTECs (UEA-1Ly51+) in H-2Kb and H-2kb+ (derived from pMECs) TEC fractions are shown in the top right upper graph. n = 3. ***, P < 0.001, two-tailed Student’s t test. Typical expression profiles of EGFP and CD80 in H-2Kb+ (red) and H-2kb (blue) TECs are shown in the lower right panel. (E) Immunohistochemical analysis of the thymus generated from RTOC by kidney transplantation. Aire (red), EGFP (green), and UEA-1 (blue) are shown. White dotted lines: medulla regions. A higher magnification image of aly/aly RTOC with pMECs is shown in an upper right panel. Bars, 50 µm for lower magnification images and 10 µm for the higher magnification image. n = 8 for aly/aly RTOC and aly/aly RTOC with pMECs, and n = 5 for aly/aly RTOC with EpCAM cells. Data are representatives of each sample. (F) Inflammatory cell infiltration in nude mice receiving RTOC. Hematoxylin and eosin staining of organs is shown. White lines: areas of inflammatory cell infiltration in liver (n = 5 for aly/aly only, n = 6 for pMECs, and n = 3 for EpCAM), pancreas (n = 7 for aly/aly only, n = 6 for pMECs, and n = 3 for EpCAM) and salivary gland (n = 7 for aly/aly only, n = 6 for pMECs, and n = 3 for EpCAM). Data are representatives of each sample. Bars, 200 µm. **, P < 0.01; ***, P < 0.001, Mann-Whitney U test. (G) Detection of autoantibodies in serum of nude mice transplanted with RTOC. The liver, salivary glands, and pancreas of RAG2-deficient mice were stained with sera (green) and propidium iodide (red). Data are representative of each sample. Bars, 100 µm. (bottom) A summary of autoantibody. Each circle represents an individual mouse. Autoantibody generation is represented as filled regions. n = 9 for aly/aly RTOC, n = 8 for aly/aly RTOC with pMECs, and n = 5 for aly/aly RTOC with EpCAM cells.
Figure 4.
Figure 4.
Distinct roles of TRAF6 and RelB in embryonic mTEC differentiation. (A) Flow cytometric analysis of TECs in thymi of Traf6−/−, Relb−/−, and wild-type embryos (E17.5). (top) Typical profiles of UEA-1 and MHCII in TECs. Percentages of specific cell types are shown. n = 10 for wild-type, n = 4 for Traf6−/−, and n = 3 for Relb−/− embryos. Black bars, mean values. *, P < 0.05; **, P < 0.01; ***, P < 0.001, two-tailed Student’s t test. (B) Flow cytometric analysis of EGFP expression in TECs of Traf6−/− RANK-EGFP, Relb−/− RANK-EGFP, and RANK-EGFP embryos (E17.5). Solid lines indicate EGFP expression in UEA-1+ TECs of each type of RANK-EGFP mice. Shaded region shows background determined in each EGFP-negative wild-type or mutant embryos. Relative MFIs of EGFP to control is shown in the right graph. n = 7 for RANK-EGFP mice; n = 3 for Traf6−/− RANK-EGFP mice and Relb−/− RANK-EGFP mice. Black bars, mean values. *, P < 0.05; **, P < 0.01, two-tailed Student’s t test. (C) Flow cytometric analysis of Ly51 expression in EGFP+UEA-1+ TECs at E17.5. Typical profiles of UEA-1 and Ly51 staining (left) in TECs and Ly51 expression in RANK+UEA-1+ TECs (right) are shown. Profiles of RANK+UEA-1+ TECs are shown as colored dots and lines. Green dots and lines, RANK-EGFP mice (wild-type); blue dots and lines, Traf6−/−RANK-EGFP mice; red dots and lines, Relb−/− RANK-EGFP mice. Shaded dots and regions indicate UEA-1 TECs. Data are representative of each experiment. n = 3 for RANK-EGFP mice, n = 2 for Traf6−/− RANK-EGFP mice, and n = 4 for Relb−/− RANK-EGFP mice. (D) Flow cytometric analysis of CD24 expression in UEA-1+ TECs of E17.5 Traf6−/− RANK-EGFP, Relb−/− RANK-EGFP, and RANK-EGFP embryos (E17.5). (top) Typical flow cytometric profiles of UEA-1 and CD24 expression. (bottom left) CD24 expression in EpCAM+UEA-1+ cells. (bottom right) MFIs of CD24. n = 4 for wild-type embryos, n = 3 for Traf6−/− embryos, and n = 4 for Relb−/− embryos. Black bars, mean values. *, P < 0.05; ***, P < 0.001, two-tailed Student’s t test. (E) Flow cytometric analysis of CD24 expression in TECs at E13.5, E14.5, E15.5, and E17.5. (left) typical flow cytometric profiles of UEA-1 and CD24. (right) MFIs of CD24. n = 4 for each age group. Black bars, mean values.
Figure 5.
Figure 5.
RANK and LtβR signaling induced pMECs from their progenitors. (A) Flow cytometric analysis of TECs in Rank−/−, Ltbr−/−, Rank−/− Ltbr−/−, anti-RANKL-Ab-treated Ltbr−/−, and control wild-type embryos (E17.5). (top left) Typical flow cytometric profiles of UEA-1 and MHCII. Numbers in figures indicate percentages of different TEC subtypes. n = 3 for wild-type, n = 8 for Rank−/−, n = 5 for Ltbr−/−, n = 5 for Rank−/− Ltbr−/−, and n = 4 for Ltbr−/− treated with RANKL-Ab. Black bars, mean values. *, P < 0.05; **, P < 0.01; ***, P < 0.001; NS, not significant; two-tailed Student’s t test. (bottom left) Typical flow cytometric profiles of UEA-1 and CD24 in TECs. MFIs of CD24 in UEA-1+ TECs are summarized in the bottom right graph. Ltbr−/−(Hi&Mid) and Ltbr−/− (Lo) indicates MHCIIhi and MHCIImidUEA-1+TECs and MHCIIloUEA+TECs in Ltbr−/−. n = 5 for wild-type, n = 3 for Rank−/−, n = 4 for Ltbr−/−, n = 3 for Rank−/− Ltbr−/−, and n = 7 for Ltbr−/− treated with RANKL-Ab. Black bars, mean values. *, P < 0.05; ***, P < 0.001; NS, not significant; two-tailed Student’s t test. (B) Flow cytometric analysis of EGFP expression in TECs of E17.5 Rankl−/− RANK-EGFP, Ltbr−/− RANK-EGFP, Rankl−/− Ltbr−/− RANK-EGFP, anti–RANKL-Ab–treated Ltbr−/− RANK-EGFP, and control wild-type mice. Solid lines of top and bottom left panels show EGFP expression in UEA-1+ TECs and UEA-1 TECs, respectively. Shaded regions show background intensities determined in control embryos. n = 4 for RANK-EGFP mice, n = 4 for Rankl−/− RANK-EGFP mice, n = 3 for Ltbr−/− RANK-EGFP mice, n = 3 for Rankl−/− Ltbr−/− RANK-EGFP mice, n = 4 for Ltbr−/− RANK-EGFP mice treated with RANKL-Ab. Black bars, mean values. ***, P < 0.001; NS, not significant; two-tailed Student’s t test.
Figure 6.
Figure 6.
Pro-pMECs differentiated into Aire+ mTECs. (A) Flow cytometric analysis of RTOCs prepared from aly/aly embryonic thymi and pro-pMECs, UEA-1 TECs, and EpCAM stroma cells. Pro-pMECs, UEA-1MHCII+ TECs, and EpCAM stroma cells were sorted from Ltbr−/− RANK-EGFP mice treated with anti-RANKL-Ab (Fig. S2). (top) EGFP expression and CD24 expression of pro-pMECs (red), pMECs (blue), and MHCIIhi TECs (green dots). Shade regions (top left) show UEA-1-TECs. RTOCs were analyzed after 5 d of culture (middle). Numbers indicate percentages of UEA-1+CD80+ cells in TECs. (bottom left) EGFP expression in UEA-1+CD80+ cells in RTOCs. (bottom right) Percentages of UEA-1+EGFP+CD80+ cells in total TECs. n = 4 for RTOC with pro-pMECs, n = 4 for RTOC with UEA-1MHCII+ TECs, and n = 5 for RTOC with EpCAM stroma cells. *, P < 0.05, two-tailed Student’s t-test. (B) Flow cytometric analysis of RTOCs prepared from pro-pMECs after 5 d of culture. Expression of CD80, UEA-1 (top right), and EGFP (middle right) in pro-pMEC–derived cells (H-2Kb+; left) is shown. Data are representative of three independent experiments. EGFP expression profiles of pro-pMECs and CD80+UEA-1+ TECs are shown (bottom right). (C) Immunohistochemical analysis of RTOC sections after 5 d of culture. EGFP (green), Aire (red), and UEA-1 (blue) are shown. Only composite images (merge) are shown for RTOCs with UEA-1MHCII+ cells and EpCAM stroma cells. Data are representative of three independent experiments. (D) Injection of limited numbers of pMECs and pro-pMECs (10 cells) into aly/aly embryonic thymi. Pro-pMECs (UEA-1+CD24hiMHCIIlo TECs) and pMECs (EGFP+UEA-1+MHCIImid TECs) were sorted from E14.5 RANK-EGFP mice treated with anti-RANKL-Ab. The sorting strategy is shown in Fig. S3. Immunohistochemical staining for Aire (green) and UEA-1 (red) is shown. White dotted lines show areas containing UEA-1+ cells. Asterisk: a kidney. Efficiency in the bottom panels indicates the ratio of the number of thymi possessing thymic medulla-like areas containing UEA-1+Aire+ cells to the number of trials. n = 8 for pMECs and pro-pMECs, and n = 9 for EpCAM cells.
Figure 7.
Figure 7.
Nonclassical NF-κB activation by RANK and LtβR signaling induced pMECs. (A) Flow cytometric analysis of fetal thymic stroma stimulated with RANK and LtβR signaling. (left) typical flow cytometric profiles of UEA-1 and MHCII. The ligands used for stimulation are shown at the top. Numbers in red rectangles show percentages of UEA-1+MHCIIhi TECs of the total TECs. Black rectangles represent gating of UEA-1+TECs. (middle) Expression profiles of EGFP and MHCII in UEA-1+ TECs of 2DG-FTOCs stimulated with LtβR-Ab or RANKL. Red lines show profiles in anti–LtβR-Ab–treated 2DG-FTOC. Green dotted lines show profiles in RANKL-treated 2DG-FTOC. (right) EGFP profiles in 2DG-FTOC from Relb−/− RANK-EGFP mice. Blue and red lines show EGFP expression in 2DG-FTOC from RANK-EGFP and Relb−/− RANK-EGFP mice, respectively. Ligands are shown at the top. Shaded regions: EGFP-negative UEA-1+TECs from wild-type 2DG-FTOC. Data are representatives of three independent experiments. (bottom) MFIs of EGFP. n = 3. **, P < 0.01; ***, P < 0.001 (two-tailed Student’s t test). (B) Flow cytometric analysis of Traf6−/− 2DG-FTOC stimulated with RANKL. (top) typical profiles of UEA-1 and MHCII expression in TECs of RANKL-treated 2DG-FTOCs from Traf6−/− RANK-EGFP and RANK-EGFP mice. (bottom) EGFP and MHCII expression in UEA-1+ TECs in RANKL-treated 2DG-FTOC. Green dotted line: profile of RANK-EGFP 2DG-FTOC. Red line shows profile of Traf6−/−RANK-EGFP 2DG-FTOC. Black line shows profile of untreated RANK-EGFP 2DG-FTOC. Shaded region shows UEA-1 TECs from RANK-EGFP 2DG-FTOC. Data are representative of three independent experiments. (C) Flow cytometric analysis of 2DG-FTOC stimulated with the cIAP inhibitor MV-1. Numbers in rectangles show percentages of UEA-1+ cells of total TECs. (right) EGFP expression in UEA-1+ cells. Data are representative of three independent experiments. (bottom) MFIs of EGFP. n = 3. **, P < 0.01, two-tailed Student’s t test. (D) Flow cytometric analysis of 2D-FTOC stimulated with MV-1, RANKL, or MV1 plus RANKL. Numbers in rectangles: percentages of UEA-1+MHCIIhi cells of total TECs. n = 3. **, P < 0.01; ***, P < 0.001, two-tailed Student’s t test. (E) qPCR analysis of 2DG-FTOC stimulated with the cIAP inhibitor MV-1, RANKL, or MV1 plus RANKL. Values are arbitrary units normalized to 36B4 mRNA expression. n = 4 for MV1 and RANKL stimulation and n = 3 for others. *, P < 0.05; **, P < 0.01; ***, P < 0.001, two-tailed Student’s t test.
Figure 8.
Figure 8.
A proposed mechanism for embryonic mTEC differentiation. Pro-pMECs derived from earlier progenitor or stem cells receive RANK or LtβR signaling. Nonclassical NF-κB activation results in differentiation of pro-pMECs into pMECs expressing higher levels of RANK. When pMECs receive RANK-TRAF6 signaling, pMECs differentiate into Aire-expressing mTECs.

References

    1. Akiyama N., Shinzawa M., Miyauchi M., Yanai H., Tateishi R., Shimo Y., Ohshima D., Matsuo K., Sasaki I., Hoshino K., et al. . 2014. Limitation of immune tolerance-inducing thymic epithelial cell development by Spi-B-mediated negative feedback regulation. J. Exp. Med. 211:2425–2438. 10.1084/jem.20141207 - DOI - PMC - PubMed
    1. Akiyama T., Maeda S., Yamane S., Ogino K., Kasai M., Kajiura F., Matsumoto M., and Inoue J.. 2005. Dependence of self-tolerance on TRAF6-directed development of thymic stroma. Science. 308:248–251. 10.1126/science.1105677 - DOI - PubMed
    1. Akiyama T., Shimo Y., Yanai H., Qin J., Ohshima D., Maruyama Y., Asaumi Y., Kitazawa J., Takayanagi H., Penninger J.M., et al. . 2008. The tumor necrosis factor family receptors RANK and CD40 cooperatively establish the thymic medullary microenvironment and self-tolerance. Immunity. 29:423–437. 10.1016/j.immuni.2008.06.015 - DOI - PubMed
    1. Akiyama T., Shinzawa M., and Akiyama N.. 2012. TNF receptor family signaling in the development and functions of medullary thymic epithelial cells. Front. Immunol. 3:278 10.3389/fimmu.2012.00278 - DOI - PMC - PubMed
    1. Akiyama T., Shinzawa M., Qin J., and Akiyama N.. 2013. Regulations of gene expression in medullary thymic epithelial cells required for preventing the onset of autoimmune diseases. Front. Immunol. 4:249 10.3389/fimmu.2013.00249 - DOI - PMC - PubMed

Publication types

MeSH terms