

Spatial and Temporal Clustering of Anti-Glomerular Basement Membrane Disease
- PMID: 27401523
- PMCID: PMC4974897
- DOI: 10.2215/CJN.13591215
Spatial and Temporal Clustering of Anti-Glomerular Basement Membrane Disease
Abstract
Background and objectives: An environmental trigger has been proposed as an inciting factor in the development of anti-GBM disease. This multicenter, observational study sought to define the national incidence of anti-GBM disease during an 11-year period (2003-2014) in Ireland, investigate clustering of cases in time and space, and assess the effect of spatial variability in incidence on outcome.
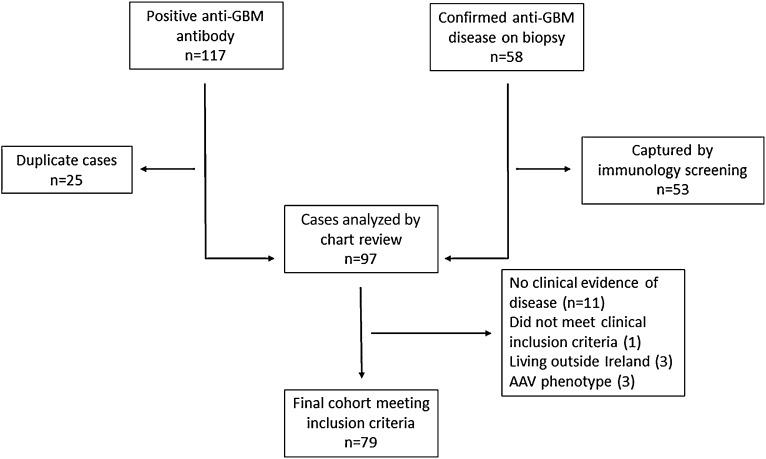
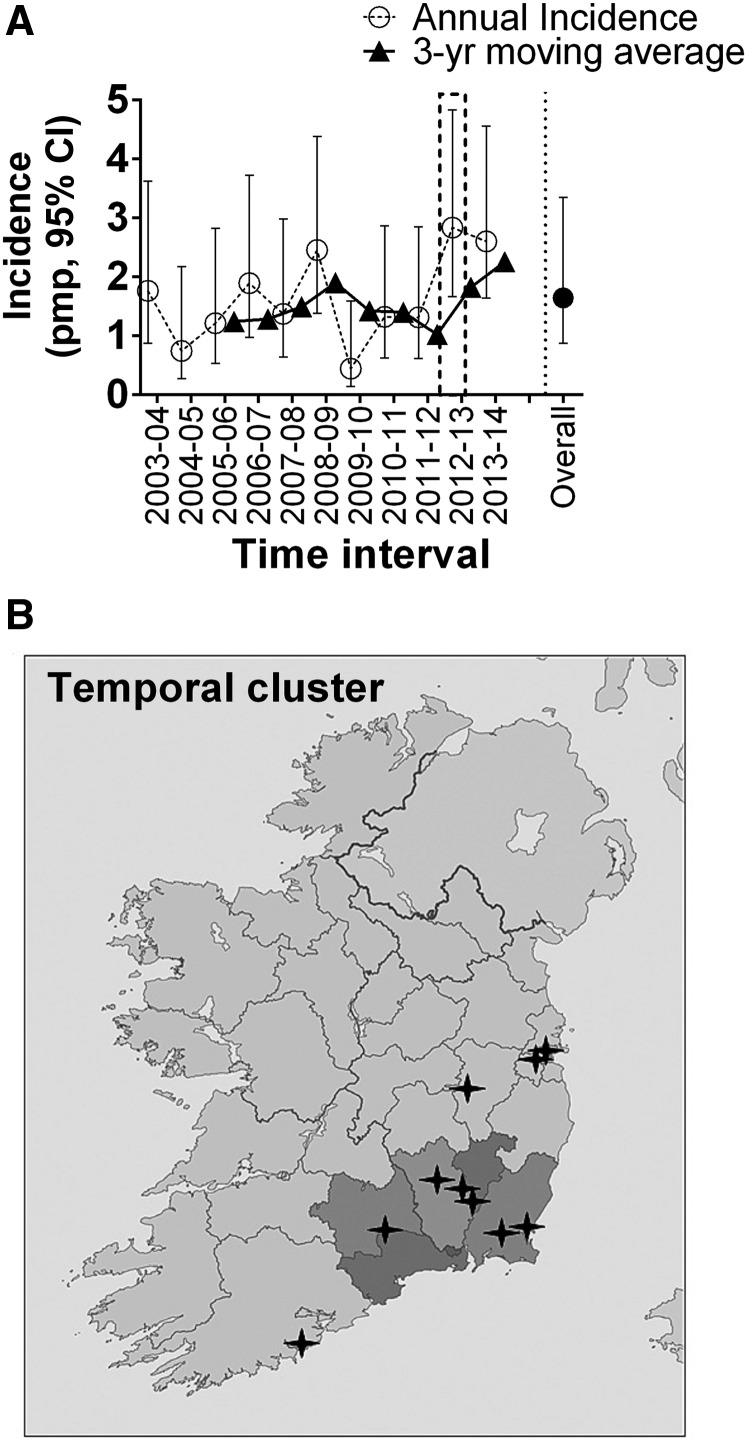
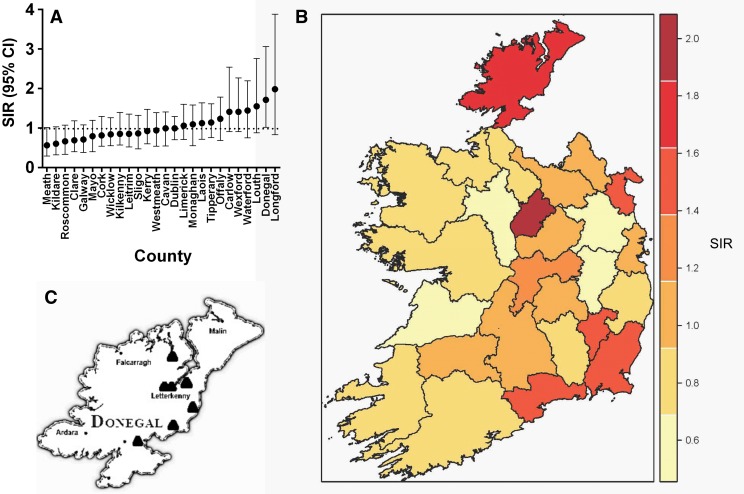
Design, setting, participants, & measurements: We ascertained cases by screening immunology laboratories for instances of positivity for anti-GBM antibody and the national renal histopathology registry for biopsy-proven cases. The population at risk was defined from national census data. We used a variable-window scan statistic to detect temporal clustering. A Bayesian spatial model was used to calculate standardized incidence ratios (SIRs) for each of the 26 counties.
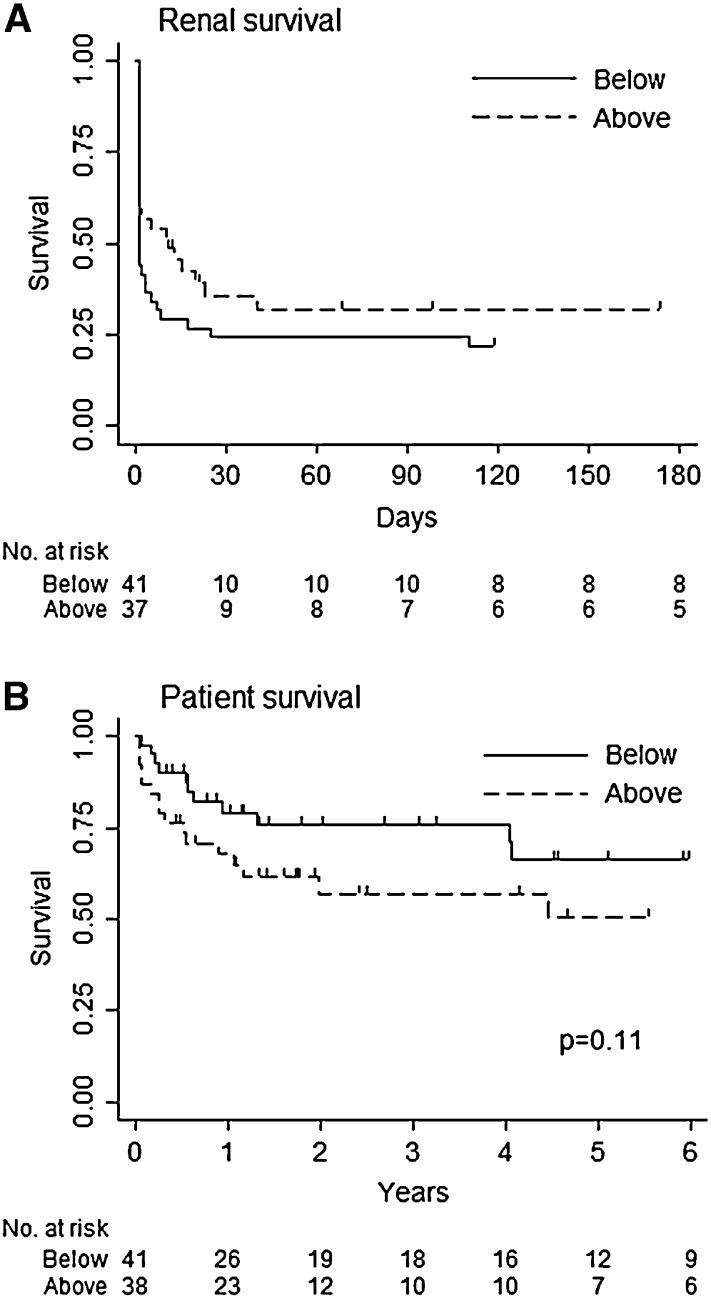
Results: Seventy-nine cases were included. National incidence was 1.64 (95% confidence interval [95% CI], 0.82 to 3.35) per million population per year. A temporal cluster (n=10) was identified during a 3-month period; six cases were resident in four rural counties in the southeast. Spatial analysis revealed wide regional variation in SIRs and a cluster (n=7) in the northwest (SIR, 1.71; 95% CI, 1.02 to 3.06). There were 29 deaths and 57 cases of ESRD during a mean follow-up of 2.9 years. Greater distance from diagnosis site to treating center, stratified by median distance traveled, did not significantly affect patient (hazard ratio, 1.80; 95% CI, 0.87 to 3.77) or renal (hazard ratio, 0.76; 95% CI, 0.40 to 1.13) survival.
Conclusions: To our knowledge, this is the first study to report national incidence rates of anti-GBM disease and formally investigate patterns of incidence. Clustering of cases in time and space supports the hypothesis of an environmental trigger for disease onset. The substantial variability in regional incidence highlights the need for comprehensive country-wide studies to improve our understanding of the etiology of anti-GBM disease.
Keywords: ANCA; anti-glomerular basement membrane disease; autoantibodies; cluster analysis; epidemiology; follow-up studies; humans; incidence; kidney; kidney failure, chronic.
Copyright © 2016 by the American Society of Nephrology.
Figures
Comment in
-
Clustering of Anti-GBM Disease: Clues to an Environmental Trigger?Clin J Am Soc Nephrol. 2016 Aug 8;11(8):1324-1326. doi: 10.2215/CJN.05580516. Epub 2016 Jul 11. Clin J Am Soc Nephrol. 2016. PMID: 27401526 Free PMC article. No abstract available.
References
-
- Hellmark T, Segelmark M: Diagnosis and classification of Goodpasture’s disease (anti-GBM). J Autoimmun 48-49: 108–112, 2014 - PubMed
-
- Jennette JC, Falk RJ, Bacon PA, Basu N, Cid MC, Ferrario F, Flores-Suarez LF, Gross WL, Guillevin L, Hagen EC, Hoffman GS, Jayne DR, Kallenberg CG, Lamprecht P, Langford CA, Luqmani RA, Mahr AD, Matteson EL, Merkel PA, Ozen S, Pusey CD, Rasmussen N, Rees AJ, Scott DG, Specks U, Stone JH, Takahashi K, Watts RA: 2012 revised International Chapel Hill Consensus Conference Nomenclature of Vasculitides. Arthritis Rheum 65: 1–11, 2013 - PubMed
-
- Naus J, Wallenstein S: Temporal surveillance using scan statistics. Stat Med 25: 311–324, 2006 - PubMed
-
- Nagarwalla N: A scan statistic with a variable window. Stat Med 15: 845–850, 1996 - PubMed
-
- Besag J, York J, Mollie A: Bayesian image restoration with two applications in spatial statistics. Ann Inst Stat Math 43: 1–59, 1991
Publication types
MeSH terms
LinkOut - more resources
Full Text Sources
Other Literature Sources
Medical
Molecular Biology Databases
