

Organic Cation Transporter 2 Overexpression May Confer an Increased Risk of Gentamicin-Induced Nephrotoxicity
- PMID: 27401566
- PMCID: PMC4997869
- DOI: 10.1128/AAC.00907-16
Organic Cation Transporter 2 Overexpression May Confer an Increased Risk of Gentamicin-Induced Nephrotoxicity
Abstract
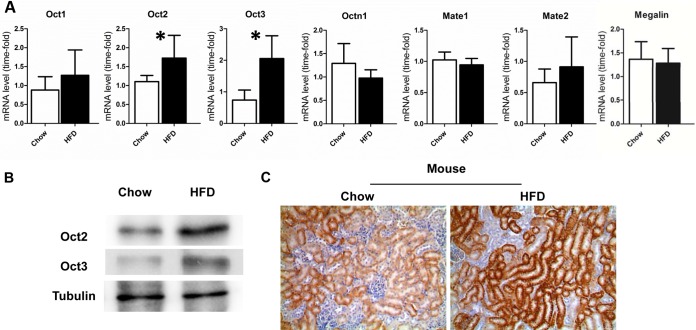
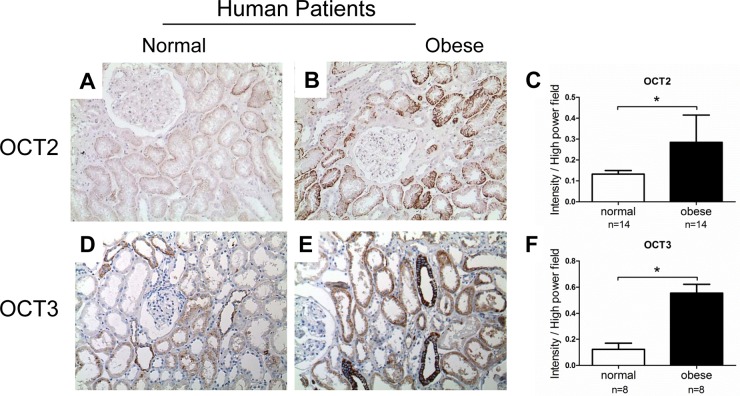
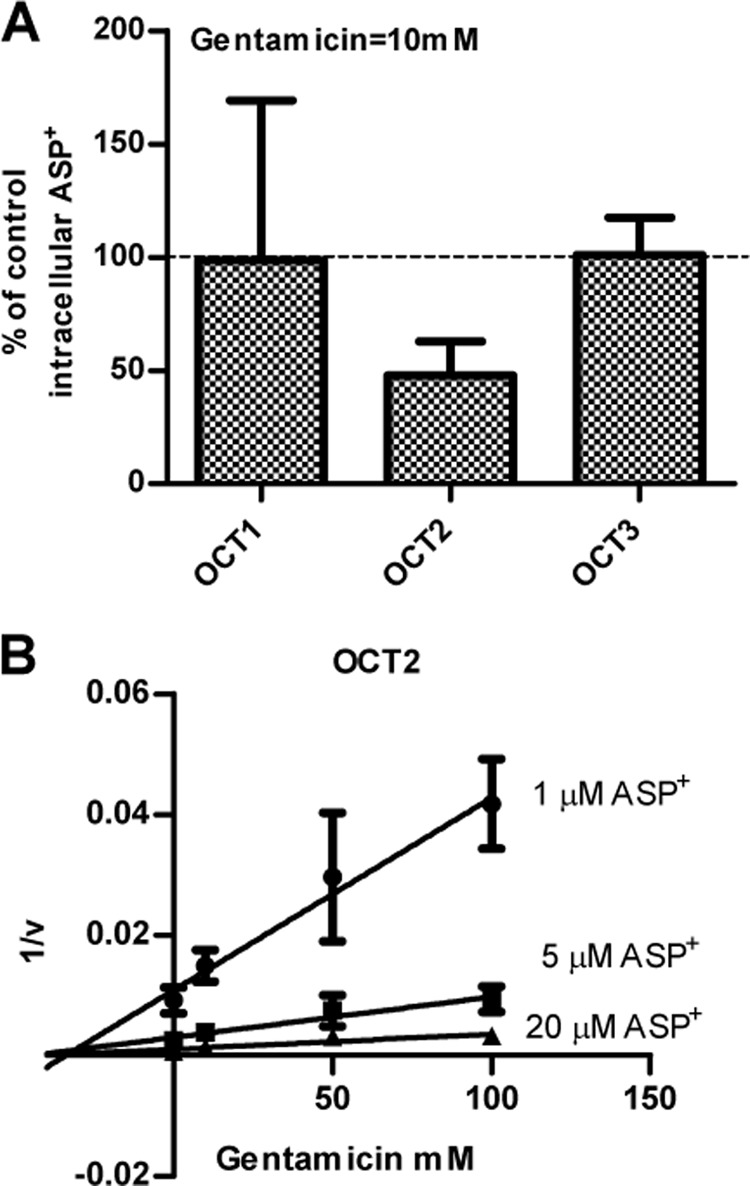
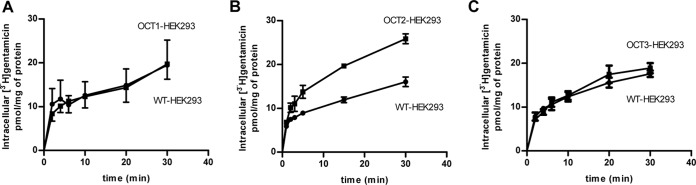
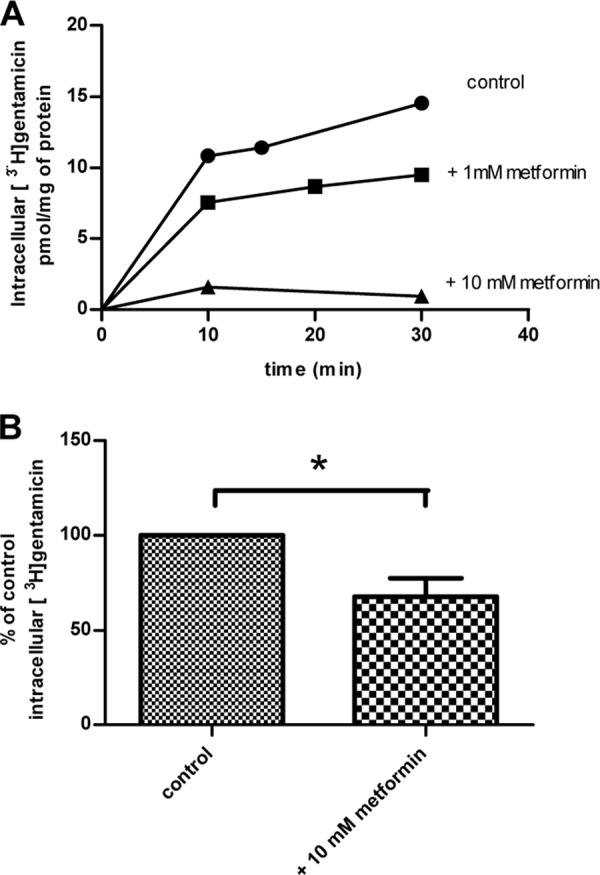
Nephrotoxicity is a relevant limitation of gentamicin, and obese patients have an increased risk for gentamicin-induced kidney injury. This damage is thought to depend on the accumulation of the drug in the renal cortex. Obese rats showed substantially higher levels of gentamicin in the kidney than did lean animals. This study characterized the role of organic cation transporters (OCTs) in gentamicin transport and elucidated their possible contribution in the increased renal accumulation of gentamicin in obesity. The mRNA and protein expression levels of the organic cation transporters Oct2 (Slc22a2) and Oct3 (Slc22a3) were increased in kidney samples from obese mice fed a high-fat diet. Similarly, OCT2 (∼2-fold) and OCT3 (∼3-fold) showed increased protein expression in the kidneys of obese patients compared with those of nonobese individuals. Using HEK293 cells overexpressing the different OCTs, human OCT2 was found to transport [(3)H]gentamicin with unique sigmoidal kinetics typical of homotropic positive cooperativity (autoactivation). In mouse primary proximal tubular cells, [(3)H]gentamicin uptake was reduced by approximately 40% when the cells were coincubated with the OCT2 substrate metformin. The basolateral localization of OCT2 suggests that gentamicin can enter proximal tubular cells from the blood side, probably as part of a slow tubular secretion process that may influence intracellular drug concentrations and exposure time. Increased expression of OCT2 may explain the higher accumulation of gentamicin, thereby conferring an increased risk of renal toxicity in obese patients.
Copyright © 2016, American Society for Microbiology. All Rights Reserved.
Figures

Similar articles
-
Selective Inhibition on Organic Cation Transporters by Carvedilol Protects Mice from Cisplatin-Induced Nephrotoxicity.Pharm Res. 2018 Sep 6;35(11):204. doi: 10.1007/s11095-018-2486-2. Pharm Res. 2018. PMID: 30191328 Free PMC article.
-
Metformin is a superior substrate for renal organic cation transporter OCT2 rather than hepatic OCT1.Drug Metab Pharmacokinet. 2005 Oct;20(5):379-86. doi: 10.2133/dmpk.20.379. Drug Metab Pharmacokinet. 2005. PMID: 16272756
-
Renal uptake of substrates for organic anion transporters Oat1 and Oat3 and organic cation transporters Oct1 and Oct2 is altered in rats with adenine-induced chronic renal failure.J Pharm Sci. 2013 Mar;102(3):1086-94. doi: 10.1002/jps.23433. Epub 2012 Dec 29. J Pharm Sci. 2013. PMID: 23280877
-
Transport of drugs in the kidney by the human organic cation transporter, OCT2 and its genetic variants.J Pharm Sci. 2006 Jan;95(1):25-36. doi: 10.1002/jps.20536. J Pharm Sci. 2006. PMID: 16307453 Review.
-
Genetic and Epigenetic Regulation of Organic Cation Transporters.Handb Exp Pharmacol. 2021;266:81-100. doi: 10.1007/164_2021_450. Handb Exp Pharmacol. 2021. PMID: 33674913 Review.
Cited by
-
Tobramycin Clearance Is Best Described by Renal Function Estimates in Obese and Non-obese Individuals: Results of a Prospective Rich Sampling Pharmacokinetic Study.Pharm Res. 2019 May 30;36(8):112. doi: 10.1007/s11095-019-2651-2. Pharm Res. 2019. PMID: 31147853 Free PMC article.
-
The Role of Mitochondria in Drug-Induced Kidney Injury.Front Physiol. 2020 Sep 4;11:1079. doi: 10.3389/fphys.2020.01079. eCollection 2020. Front Physiol. 2020. PMID: 33013462 Free PMC article. Review.
-
L-carnitine co-administration prevents colistin-induced mitochondrial permeability transition and reduces the risk of acute kidney injury in mice.Sci Rep. 2024 Jul 16;14(1):16444. doi: 10.1038/s41598-024-67171-x. Sci Rep. 2024. PMID: 39013979 Free PMC article.
-
Drug Transporters in the Kidney: Perspectives on Species Differences, Disease Status, and Molecular Docking.Front Pharmacol. 2021 Nov 29;12:746208. doi: 10.3389/fphar.2021.746208. eCollection 2021. Front Pharmacol. 2021. PMID: 34912216 Free PMC article. Review.
-
Equine Drug Transporters: A Mini-Review and Veterinary Perspective.Pharmaceutics. 2020 Nov 8;12(11):1064. doi: 10.3390/pharmaceutics12111064. Pharmaceutics. 2020. PMID: 33171593 Free PMC article. Review.
References
Publication types
MeSH terms
Substances
LinkOut - more resources
Full Text Sources
Other Literature Sources
Medical
