Clinical Trial
. 2016 Aug;76(2):137-48.
doi: 10.1111/aji.12535.

Effects of the levonorgestrel-releasing intrauterine device on the immune microenvironment of the human cervix and endometrium

Affiliations
Clinical Trial

Effects of the levonorgestrel-releasing intrauterine device on the immune microenvironment of the human cervix and endometrium

Uma Shanmugasundaram et al. Am J Reprod Immunol. 2016 Aug.

Abstract

Problem: There is little information regarding the impact of the intrauterine device on immune parameters of the upper female reproductive tract related to risk of HIV acquisition.

Method of study: We collected cervical and endometrial samples from women using the hormonal intrauterine device to study its effects on endocervical cytokines/chemokine concentrations, phenotypic markers of T cells, responses of endometrial T cells to activation, and alterations of endometrial cellular infiltrates.

Results: Hormonal intrauterine device use was associated with: increased concentrations of inflammatory cytokines/chemokines (endocervix); increased coexpression of CXCR4 and CCR5 (endocervix and endometrium); increased coexpression of CD38 and HLADR (endocervix and endometrium); increased intracellular IL-10 production after T-cell stimulation (endometrium); and increased density of T cells, most notably regulatory T cells (endometrium).

Conclusion: Hormonal intrauterine device use resulted in both inflammatory and immunosuppressive alterations. Further research is needed to determine the significance of these changes for HIV risk.

Keywords: HIV; IUD; T-cell; chemokine; cytokine; progestin.


Figures

Figure 1
Figure 1
Compares values for 13 cytokines, chemokines, and innate immune factors in endocervical fluids from controls (n=24) and LNGIUD users (n=19). Fluids were collected from participants by insertion of an ophthalmic sponge [Merocel] into the endocervical canal for 90 s; fluids were extracted and analyzed on a Milliplex platform as described in Methods. Panel (a) age‐adjusted mean biomarker concentrations (circles) and 95% confidence intervals (bars) from controls (blue) and LNGIUD users (red). Concentration is represented on a log scale in pg/ml, ordered by biomarker concentration in controls from lowest (y‐axis top) to highest (y‐axis bottom). Panel (b) the mean fold‐change (circle) and 95% confidence intervals (bars) of values from LNGIUD users compared to control for each biomarker. Specific P‐values are indicated for fold‐change with P‐values <.10
Figure 2
Figure 2
Flow cytometry gating used in the analysis of endocervical and endometrial T‐cell phenotypes. After initial gating of lymphocytes (based on forward vs side scatter) and doublet discrimination, dead cells were excluded by staining with live/dead viable amine; viable cells that were CD3+ CD66b (not shown) were then subdivided into CD4+ or CD8+ populations. The resulting CD4+ or CD8+ T cells were then assessed for expression of three pairs of phenotypic markers, as described in the text. Shown from left to right, these were as follows: differentiation markers CCR7 and CD45RA; activation markers CD38 and HLADR; chemokine receptors CCR5 and CXCR4. Quadrant gates were drawn based on fluorescence‐minus‐one (FMO) controls. Numbers in each quadrant indicate percentages of CD4+ or CD8+ T cells expressing various combinations of markers. Data shown are from a representative participant using LNGIUD
Figure 3
Figure 3
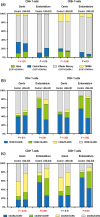
A summary of flow cytometric phenotyping data. Bivariate distributions of three pairs of phenotypes, (a) CCR7/CD45RA, (b) CD38/HLADR, and (c) CXCR4/CCR5, are summarized for CD4+ and CD8+ T cells from endocervical cytobrush and endometrium, as indicated in the figure headings. The stacked box plots summarize the distribution of each phenotype, analyzed as a function of exposure group (control or LNGIUD) in models stratified by tissue and cell type. P‐values <.05 are shown in red type. Color coding follows the same pattern in all graphs: +/− blue, −/+ yellow, +/+ green, −/− gray. TEMRA indicates terminally differentiated effector cells expressing CD45RA
Figure 4
Figure 4
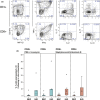
Panel (a) intracellular cytokine production by CD4+ and CD8+ T cells following polyclonal stimulation. For analysis of endometrial T‐cell responses to stimulation, production of six cytokines (IFN‐γ, IL‐2, IL‐10, IL‐17, MIP‐1β, and TNF‐α) and the granule‐associated membrane protein CD107 were measured by flow cytometry as described in the text. Initial gating was performed to identify lymphocytes and remove doublets (not shown), followed by gating of viable CD3+ T cells on subsets expressing either CD4 or CD8, and finally for individual responses as indicated on bivariate plots. Numbers indicate the percentages of CD4+ or CD8+ T cells in each quadrant. Data shown are from a representative participant using LNGIUD with SEB‐stimulated cells. Panel (b) production of IL‐10 by CD4+ and CD8+ T cells from endometrial tissue of LNGIUD users (“IUD”) and control women (“REF”) following stimulation with PMA–ionomycin (blue boxes, left) or SEB (red boxes, right). Box plots illustrate the percent responding cells by subject group, cell type, and stimulus. The length of each box represents the interquartile range (IQR; the distance between the 25th and 75th percentiles), and the interior line represents the median (50th percentile). A symbol (diamond) denotes the mean. “Whiskers” are drawn to the most extreme observations that lie within the fences. The upper fence is defined as the third quartile plus 1.5 times the interquartile range (IQR), and the lower fence is defined as the first quartile minus 1.5 times the interquartile range. Observations outside the fences are identified with small circles
Figure 5
Figure 5
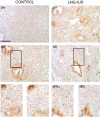
Immunohistochemical detection of regulatory T cells in endometrial biopsies. Five‐micron paraffin sections of formalin‐fixed endometrial biopsies from control participants panels (a and b) and LNGIUD users panels (c and d) were incubated with mouse monoclonal anti‐FoxP3 antibodies followed by peroxidase‐conjugated goat anti‐mouse secondary antibodies and diaminobenzidine substrate, as described in Methods. Slides were counterstained with hematoxylin. Dark brown nuclear staining reflects the presence of FoxP3. Enlarged views of rectangular areas outlined in panel (b) and (d) are shown from the same slide panels (b1 and d1) or from a serial section incubated without anti‐FoxP3 antibodies panels (b2 and d2). Bar in panel (a) = 100 μm

References

    1. UNAIDS . The Gap Report. Geneva: Joint United Nations Programme on HIV/AIDS; 2014.
    1. Buhling KJ, Zite NB, Lotke P, Black K, Group IW . Worldwide use of intrauterine contraception: a review. Contraception. 2014;89:162–173. - PubMed
    1. United Nations . World Contraceptive Patterns 2013. http://www.un.org/en/development/desa/population/publications/family/con.... Accessed March 12, 2016.
    1. Blumenthal PD, Voedisch A, Gemzell‐Danielsson K. Strategies to prevent unintended pregnancy: increasing use of long‐acting reversible contraception. Hum Reprod Update. 2011;17:121–137. - PubMed
    1. Wira CR, Rodriguez‐Garcia M, Patel MV. The role of sex hormones in immune protection of the female reproductive tract. Nat Rev Immunol. 2015;15:217–230. - PMC - PubMed

Publication types