How large are the consequences of covariate imbalance in cluster randomized trials: a simulation study with a continuous outcome and a binary covariate at the cluster level
- PMID: 27401771
- PMCID: PMC4939594
- DOI: 10.1186/s12874-016-0182-7
How large are the consequences of covariate imbalance in cluster randomized trials: a simulation study with a continuous outcome and a binary covariate at the cluster level
Abstract
Background: The number of clusters in a cluster randomized trial is often low. It is therefore likely random assignment of clusters to treatment conditions results in covariate imbalance. There are no studies that quantify the consequences of covariate imbalance in cluster randomized trials on parameter and standard error bias and on power to detect treatment effects.
Methods: The consequences of covariance imbalance in unadjusted and adjusted linear mixed models are investigated by means of a simulation study. The factors in this study are the degree of imbalance, the covariate effect size, the cluster size and the intraclass correlation coefficient. The covariate is binary and measured at the cluster level; the outcome is continuous and measured at the individual level.
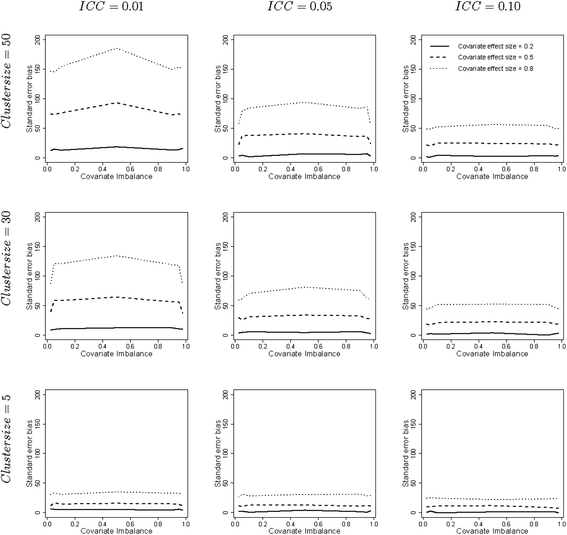
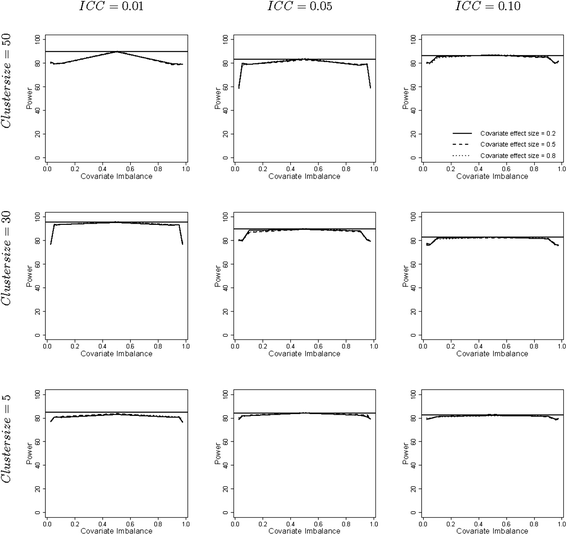
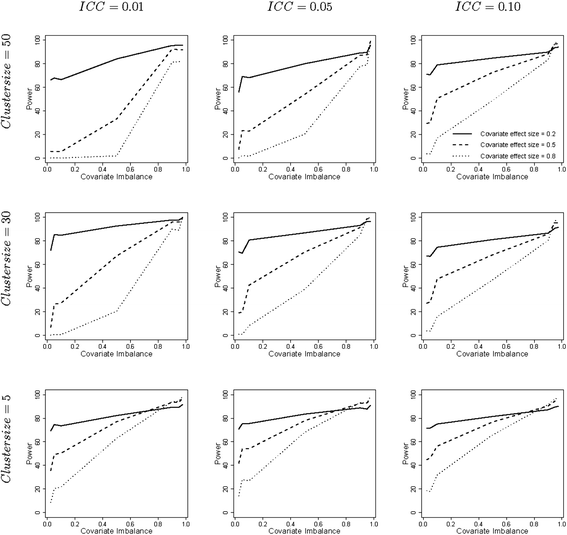
Results: The results show covariate imbalance results in negligible parameter bias and small standard error bias in adjusted linear mixed models. Ignoring the possibility of covariate imbalance while calculating the sample size at the cluster level may result in a loss in power of at most 25 % in the adjusted linear mixed model. The results are more severe for the unadjusted linear mixed model: parameter biases up to 100 % and standard error biases up to 200 % may be observed. Power levels based on the unadjusted linear mixed model are often too low. The consequences are most severe for large clusters and/or small intraclass correlation coefficients since then the required number of clusters to achieve a desired power level is smallest.
Conclusions: The possibility of covariate imbalance should be taken into account while calculating the sample size of a cluster randomized trial. Otherwise more sophisticated methods to randomize clusters to treatments should be used, such as stratification or balance algorithms. All relevant covariates should be carefully identified, be actually measured and included in the statistical model to avoid severe levels of parameter and standard error bias and insufficient power levels.
Keywords: Adjusted linear mixed model; Cluster randomization; Covariate imbalance; Simulation study; Unadjusted linear mixed model.
Figures


Similar articles
-
Impact of baseline covariate imbalance on bias in treatment effect estimation in cluster randomized trials: Race as an example.Contemp Clin Trials. 2020 Jan;88:105775. doi: 10.1016/j.cct.2019.04.016. Epub 2019 Jun 20. Contemp Clin Trials. 2020. PMID: 31228563 Free PMC article.
-
The fixed-effects model for robust analysis of stepped-wedge cluster trials with a small number of clusters and continuous outcomes: a simulation study.Trials. 2024 Oct 25;25(1):718. doi: 10.1186/s13063-024-08572-1. Trials. 2024. PMID: 39455982 Free PMC article.
-
Evaluating tests for cluster-randomized trials with few clusters under generalized linear mixed models with covariate adjustment: A simulation study.Stat Med. 2024 Jan 30;43(2):201-215. doi: 10.1002/sim.9950. Epub 2023 Nov 7. Stat Med. 2024. PMID: 37933766 Free PMC article.
-
Imputation strategies for missing continuous outcomes in cluster randomized trials.Biom J. 2008 Jun;50(3):329-45. doi: 10.1002/bimj.200710423. Biom J. 2008. PMID: 18537126 Review.
-
Generalized estimating equations in cluster randomized trials with a small number of clusters: Review of practice and simulation study.Clin Trials. 2016 Aug;13(4):445-9. doi: 10.1177/1740774516643498. Epub 2016 Apr 19. Clin Trials. 2016. PMID: 27094487 Review.
Cited by
-
Covariate-constrained randomization in cluster randomized 2x2 factorial trials: Application to a diabetes prevention study.Res Sq [Preprint]. 2024 Mar 25:rs.3.rs-3783684. doi: 10.21203/rs.3.rs-3783684/v1. Res Sq. 2024. Update in: Trials. 2024 Sep 6;25(1):593. doi: 10.1186/s13063-024-08415-z. PMID: 38585808 Free PMC article. Updated. Preprint.
-
What are the statistical implications of treatment non-compliance in cluster randomized trials: A simulation study.Stat Med. 2019 Nov 20;38(26):5071-5084. doi: 10.1002/sim.8351. Epub 2019 Oct 3. Stat Med. 2019. PMID: 31578760 Free PMC article.
-
Impact of baseline covariate imbalance on bias in treatment effect estimation in cluster randomized trials: Race as an example.Contemp Clin Trials. 2020 Jan;88:105775. doi: 10.1016/j.cct.2019.04.016. Epub 2019 Jun 20. Contemp Clin Trials. 2020. PMID: 31228563 Free PMC article.
-
Comparing analytical strategies for balancing site-level characteristics in stepped-wedge cluster randomized trials: a simulation study.BMC Med Res Methodol. 2023 Sep 12;23(1):206. doi: 10.1186/s12874-023-02027-y. BMC Med Res Methodol. 2023. PMID: 37700232 Free PMC article.
-
Mind the gap: covariate constrained randomisation can protect against substantial power loss in parallel cluster randomised trials.BMC Med Res Methodol. 2022 Apr 13;22(1):111. doi: 10.1186/s12874-022-01588-8. BMC Med Res Methodol. 2022. PMID: 35413793 Free PMC article.
References
-
- Moerbeek M. Randomization of clusters versus randomization of persons within clusters: which is preferable? Am Stat. 2005;59:72–8. doi: 10.1198/000313005X20727. - DOI
-
- Campbell MJ, Walters SJ. How to design, analyse and report cluster randomised trials in medicine and health related research. Chichester: Wiley; 2014.
-
- Donner A, Klar N. Design and analysis of cluster randomization trials in health research. London: Edward Arnold; 2000.
-
- Eldridge M, Kerry S. A practical guide to cluster randomised trials in health services research. Chichester: Wiley; 2012.
-
- Hayes RJ, Moulton LH. Cluster randomised trials. Boca Raton: CRC Press; 2009.
MeSH terms
LinkOut - more resources
Full Text Sources
Other Literature Sources

