. 2016 Oct;53(10):1587-99.
doi: 10.1111/psyp.12722. Epub 2016 Jul 12.

The effects of respiratory sinus arrhythmia on anger reactivity and persistence in major depression

Affiliations

The effects of respiratory sinus arrhythmia on anger reactivity and persistence in major depression

Alissa J Ellis et al. Psychophysiology. 2016 Oct.

Abstract

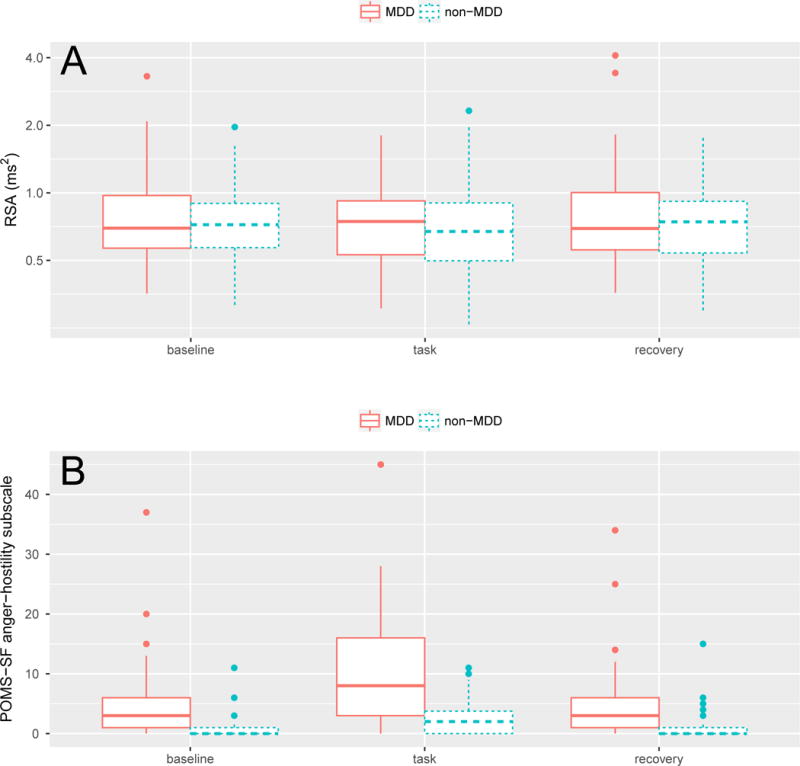
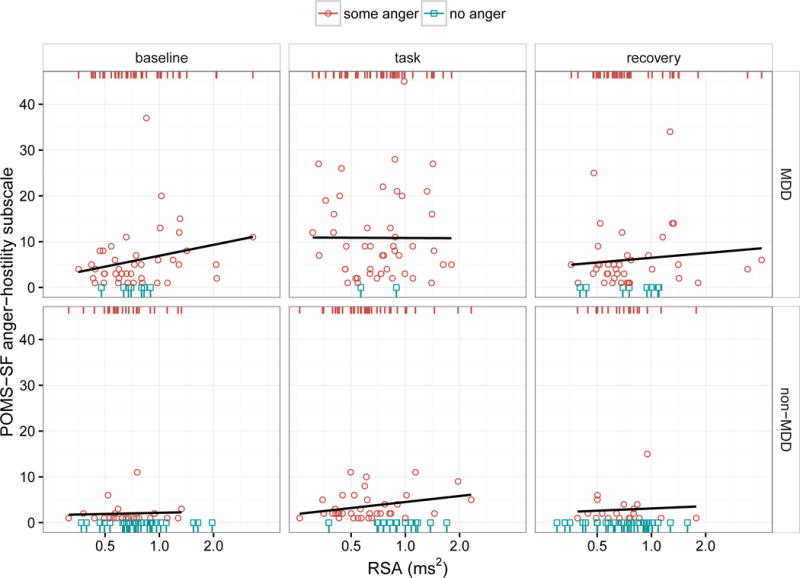
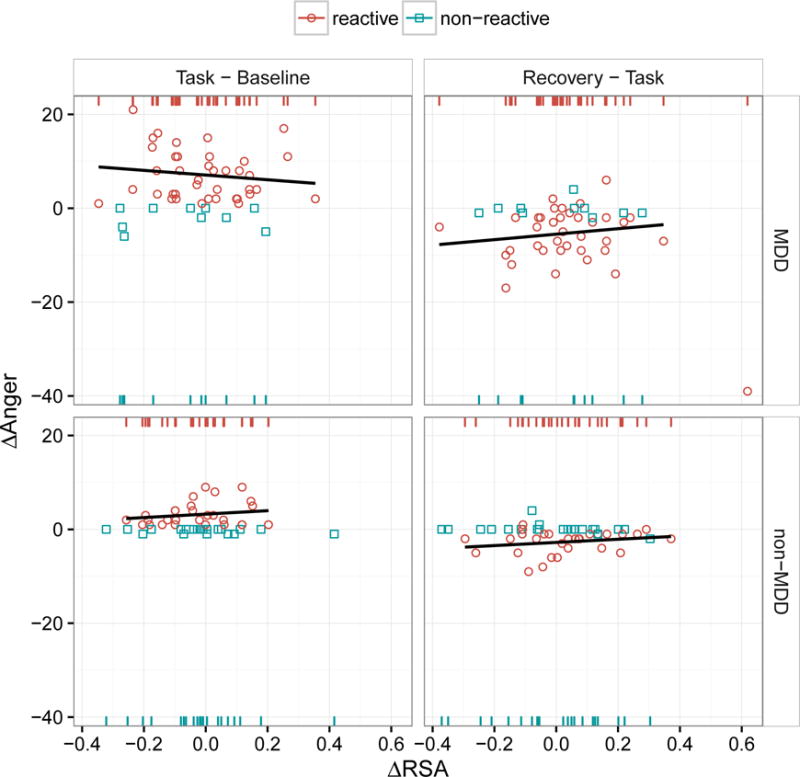
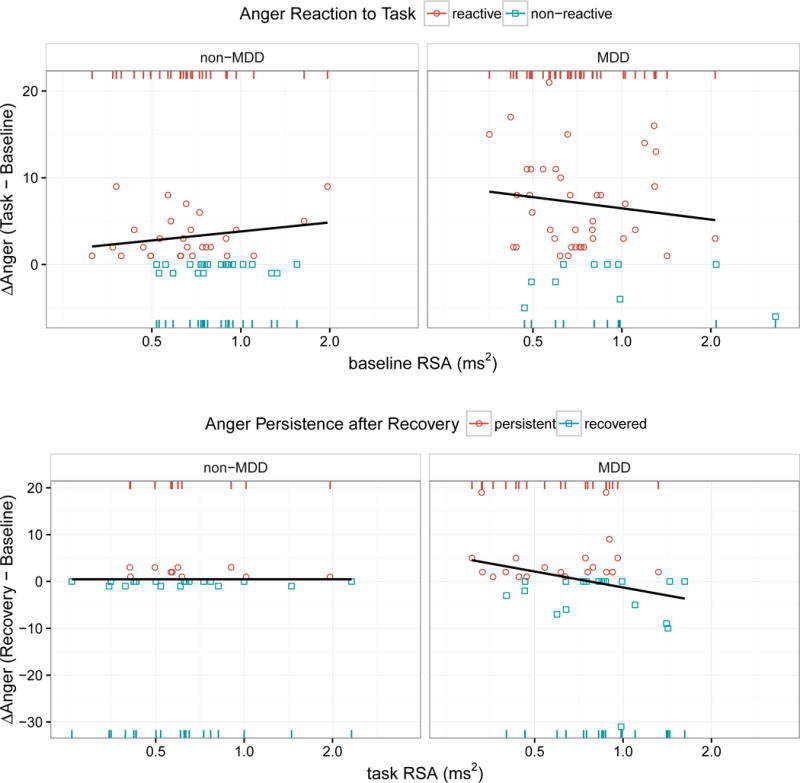
The experience of anger during a depressive episode has recently been identified as a poor prognostic indicator of illness course. Given the clinical implications of anger in major depressive disorder (MDD), understanding the mechanisms involved in anger reactivity and persistence is critical for improved intervention. Biological processes involved in emotion regulation during stress, such as respiratory sinus arrhythmia (RSA), may play a role in maintaining negative moods. Clinically depressed (MDD; n = 49) and nondepressed (non-MDD; n = 50) individuals were challenged with a stressful computer task shown to increase anger, while RSA (high frequency range 0.15-0.4 Hz) was collected. RSA predicted future anger, but was unrelated to current anger. That is, across participants, low baseline RSA predicted anger reactivity during the task, and in depressed individuals, those with low RSA during the task had a greater likelihood of anger persistence during a recovery period. These results suggest that low RSA may be a psychophysiological process involved in anger regulation in depression. Low RSA may contribute to sustained illness course by diminishing the repair of angry moods.

Keywords: Anger; Major depression; Mood persistence; Respiratory sinus arrhythmia.


Figures

Figure 1
Figure 1
(A) Distributions of RSA magnitude (spectral power for high-frequency band) for MDD and non-MDD participants across baseline, task, and recovery periods. Note that the intervals of the y-axis are drawn to log-scale. (B) Distributions of POMS-anger scores for MDD and non-MDD individuals across task conditions. Note the severe floor effect, especially for non-MDD participants. The large proportion of zero values necessitated that we model anger separately as both a discrete (i.e., on-off) process and a continuous process only for those participants with non-zero anger.
Figure 2
Figure 2
Scatter plots of POMS anger scores (y axis) as a function of concurrent RSA measurements (x axis with log scale) across groups (rows) and experimental condition (columns). The effect of MDD and RSA on anger was modeled in two stages. In the first stage, we predicted the presence vs. absence of anger as indicated by red circles and blue squares, respectively. The red and blue rugs at the top and bottom of each panel simply reiterate and separate the x-values (RSA magnitude) by the presence vs. absence of anger, respectively. These rugs, as opposed to the scatter plots, should be used for interpreting the effect of RSA in the context of the logistic models reported in Table 2; in other words, the y-dimension (anger magnitude) is completely irrelevant to these models and is considered separately in the second stage of modeling by fitting a least-squares regression to the non-zero anger data only. The regression lines in these plots reflect this second stage and are only fit to the red circles (where there is actual variance in anger magnitude), not the blue squares. In summary, this approach treats anger as a two-process phenomenon: 1) a “switch” that “flips” between discrete states of not angry vs. angry (e.g., think of the red rug as “on” and the blue rug as “off”) and 2) a “knob” that “dials” the magnitude of anger up or down. These are two independent questions, and it is possible for RSA or MDD to predict the “anger switch” but not the “anger knob”, or vice versa. In this case, there is only evidence that RSA is related to concurrent anger as a discrete state: within the non-MDD group and the task condition, note the relative separation of the blue and red rugs, indicating that higher task RSA was associated with the complete absence of anger. However, none of the regression lines fit to the non-zero anger values were significant, indicating that, within the subsample showing non-zero anger, the magnitude of RSA was not associated with the magnitude of anger. (As discussed in the switch vs. dial metaphor, these two findings are independent of one another and should not be viewed as contradictory.) MDD, on the other hand, was related to both presence and magnitude of anger as reflected by the greater number of blue squares (zero anger) in the non-MDD panels and larger y-values for the red circles in the MDD panels.
Figure 3
Figure 3
Scatter plots of the lag-1 differences in POMS anger scores (y axis, “Δ Anger”) as a function of the simultaneous lag-1 differences in the logs of RSA magnitudes (x axis, “Δ RSA”) across groups (rows) and the transitions between experimental conditions (columns). The effect of MDD and Δ RSA on anger was modeled in two stages. In the first stage, we predicted whether participants did or did not show increased anger in reaction to the frustrating task, as indicated by the red circles (labeled “reactive”) and blue squares (labeled “non-reactive”), respectively. The red and blue rugs at the top and bottom, of each panel simply reiterate and separate the x-values (Δ RSA scores) by reactive vs. non-reactive individuals, respectively. These rugs, as opposed to the scatter plots, should be used for interpreting the effect of Δ RSA in the context of the logistic models reported in Table 3; in other words, the y-dimension (Δ Anger) is completely irrelevant to these models and is considered separately in the second stage of modeling by fitting a least-squares regression to only those data points reflecting increased anger. The regression lines in these plots (none of which were statistically significant) reflect this second stage and are only fit to the red circles, not the blue squares. There was no evidence that within-individual change in RSA was related to within-individual change in anger, regardless of whether anger induction was modeled as a discrete event or as a continuous process. The presence of MDD, on the other hand, predicted both processes: this can be seen in the the left “Task – Baseline” column in terms of both a greater number of red circles in the MDD vs. non-MDD group (more MDD participants experienced increased anger) and, comparing only the red circles between rows, a greater increase in anger in the MDD group. Note that the change in anger from task to recovery (right column) is roughly symmetrical to the change in anger from baseline to task (left column). Also note the outlier in the top-right panel (Recovery – Task for MDD) showing a very large decrease in anger and a very large simultaneous increase in RSA. This outlier was excluded from the regression line shown for this panel.
Figure 4
Figure 4
Scatter plots of anger reaction scores (top y-axis) and anger persistence scores (bottom y-axis) as a function of previous RSA measurements (x-axis at log scale) taken from the prior phase of the experiment (baseline RSA predicting subsequent anger reactivity following task, and task RSA predicting subsequent anger persistence following recovery). Anger reaction scores were computed as the difference in the POMS anger-hostility subscale between baseline and task; anger persistence scores were only computed for those participants who showed increased anger following task and were calculated as the difference in the POMS anger-hostility subscale between baseline and recovery. The effect of MDD and prior RSA on subsequent anger change was modeled in two stages. In the first stage, we predicted the presence vs. absence of elevated anger relative to baseline as indicated by red circles and blue squares, respectively. The red and blue rugs at the top and bottom of each panel simply reiterate and separate the x-values (prior RSA magnitude) into these dichotomous groups. These rugs, as opposed to the scatter plots, should be used for interpreting the effect of RSA in the context of the logistic models reported in Table 4; in other words, the y-dimension (magnitude of anger elevation over baseline) is completely irrelevant to these models and is considered separately in the second stage of modeling using least-squares regression. The regression lines in these plots, none of which were statistically significant, reflect this second stage of modeling. For the anger reaction scores (top), lines of least squares are only fit to the red circles in order to specifically model the magnitude of anger increase, excluding those who showed no anger increase. For the anger persistence scores (bottom), however, the lines of least squares are fit to all data points, given that the (Recovery – Baseline) anger differences for the MDD group showed normal variance around zero (rather than the typical inflation of zero values that characterizes this measurement), reflecting that many MDD participants experienced a “hyper-recovery” with anger levels falling well below baseline. Note, for Anger Reaction to Task, the rightward shift of the bottom blue rugs (relative to the leftward shift of the top red rugs) illustrates the effect reported in Table 4 that a 1 SD decrease in RSA at baseline nearly doubles the odds of a subsequent anger reaction, independent of MDD diagnosis. A similar effect can be seen for Anger Persistence after Recovery but only for the MDD group. Note the extreme lack of variance in anger persistence for the non-MDD group precludes detecting a similar effect for them.

Similar articles

Cited by

References

    1. Association, A. P. Diagnostic and Statistical Manual of Mental Disorders DSM-IV-TR (Text Revision) (Diagnostic & Statistical Manual of Mental Disorders (4 Sub) American Psychiatric Publishing, Inc; 2000.
    1. Beauchaine TP. Vagal tone, development, and Gray’s motivational theory: Toward an integrated model of autonomic nervous system functioning in psychopathology. Development and Psychopathology. 2001;13(2):183–214. http://doi.org/10.1017/S0954579401002012. - DOI - PubMed
    1. Beauchaine TP, Gatzke-Kopp L, Mead HK. Polyvagal Theory and developmental psychopathology: Emotion dysregulation and conduct problems from preschool to adolescence. Biological Psychology. 2007;74(2):174–184. http://doi.org/10.1016/j.biopsycho.2005.08.008. - DOI - PMC - PubMed
    1. Beck AT, Rial WY, Rickels K. Short form of Depression Inventory: Cross-validation. Psychological Reports. 1974;34(3, Pt 2):1184–1186. - PubMed
    1. Beck AT, Steer RA, Ball R, Ranieri WF. Comparison of Beck Depression Inventories–IA and –II in psychiatric outpatients. Journal of Personality Assessment. 1996;67(3):588–597. http://doi.org/10.1207/s15327752jpa6703_13. - DOI - PubMed

Publication types