. 2016 Aug 30;82(18):5612-20.
doi: 10.1128/AEM.00815-16. Print 2016 Sep 15.

Basic Reproduction Number and Transmission Dynamics of Common Serogroups of Enterohemorrhagic Escherichia coli

Affiliations

Basic Reproduction Number and Transmission Dynamics of Common Serogroups of Enterohemorrhagic Escherichia coli

Shi Chen et al. Appl Environ Microbiol. .

Abstract

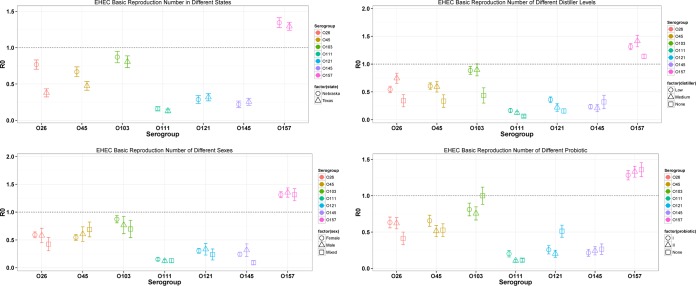
Understanding the transmission dynamics of pathogens is essential to determine the epidemiology, ecology, and ways of controlling enterohemorrhagic Escherichia coli (EHEC) in animals and their environments. Our objective was to estimate the epidemiological fitness of common EHEC strains in cattle populations. For that purpose, we developed a Markov chain model to characterize the dynamics of 7 serogroups of enterohemorrhagic Escherichia coli (O26, O45, O103, O111, O121, O145, and O157) in cattle production environments based on a set of cross-sectional data on infection prevalence in 2 years in two U.S. states. The basic reproduction number (R0) was estimated using a Bayesian framework for each serogroup based on two criteria (using serogroup alone [the O-group data] and using O serogroup, Shiga toxin gene[s], and intimin [eae] gene together [the EHEC data]). In addition, correlations between external covariates (e.g., location, ambient temperature, dietary, and probiotic usage) and prevalence/R0 were quantified. R0 estimates varied substantially among different EHEC serogroups, with EHEC O157 having an R0 of >1 (∼1.5) and all six other EHEC serogroups having an R0 of less than 1. Using the O-group data substantially increased R0 estimates for the O26, O45, and O103 serogroups (R0 > 1) but not for the others. Different covariates had distinct influences on different serogroups: the coefficients for each covariate were different among serogroups. Our modeling and analysis of this system can be readily expanded to other pathogen systems in order to estimate the pathogen and external factors that influence spread of infectious agents.

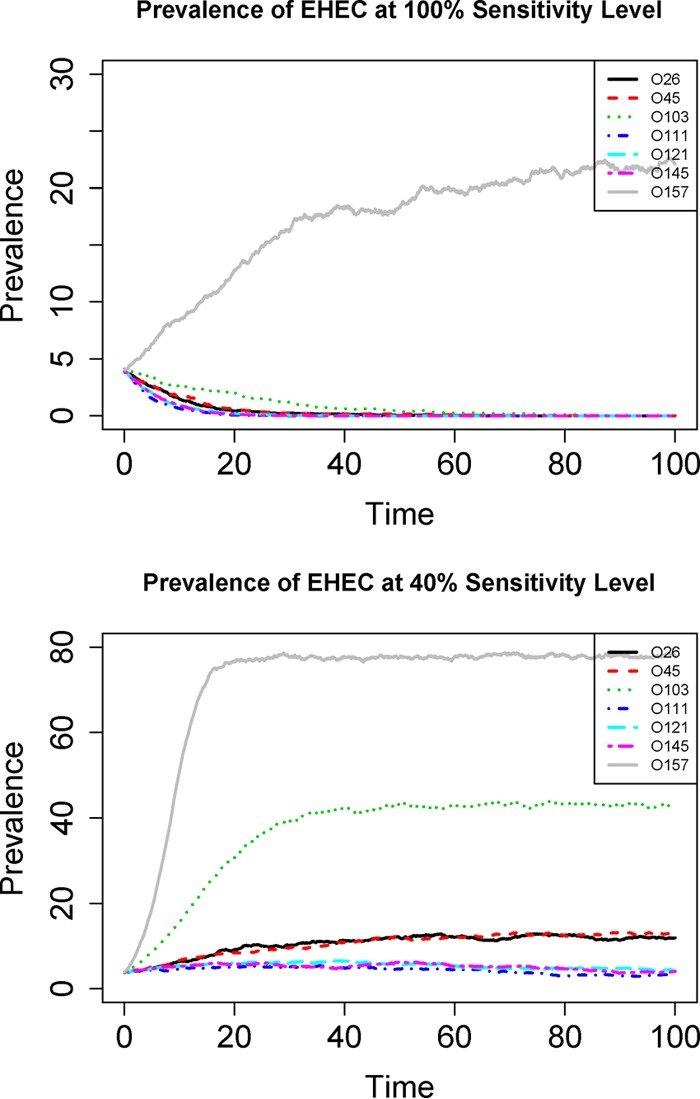
Importance: In this paper we describe a Bayesian modeling framework to estimate basic reproduction numbers of multiple serotypes of Shiga toxin-producing Escherichia coli according to a cross-sectional study. We then coupled a compartmental model to reconstruct the infection dynamics of these serotypes and quantify their risk in the population. We incorporated different sensitivity levels of detecting different serotypes and evaluated their potential influence on the estimation of basic reproduction numbers.


Figures

FIG 1
FIG 1
Pen-level R0 values of serogroups using O-group data in 2013 and 2014. The dashed line (y = 1) indicates the threshold of R0 = 1. The circles and triangles represent mean values, and error bars represent standard deviations. For the O-group data, O26, O45, O103, and O157 have R0 values of >1, indicating their potential to persist in the cattle population. On the other hand, O111, O121, and O145 have R0 values of <1, and it is difficult for them to persist in the population.
FIG 2
FIG 2
Pen-level R0 values of serogroups using EHEC data in 2013 and 2014. The dashed line (y = 1) indicates the threshold of R0 = 1. The circles and triangles represent mean values, and error bars represent standard deviations. In contrast to the results in Fig. 1, only O157 has an R0 value of >1, and all other, non-O157 serogroups have R0 values of <1 and cannot persist in the cattle population (using the EHEC data set, where the determination of the pathogen is more stringent than for the O-group data set).
FIG 3
FIG 3
R0 values of serogroups using the EHEC data at different levels of different covariates. The dashed line (y = 1) indicates the threshold of R0 = 1. Low distiller, 10%; medium distiller, 30%. The circles, triangles, and squares represent mean values, and error bars represent standard deviations.
FIG 4
FIG 4
Simulated time series of prevalence for different serogroups using EHEC data at different sensitivity levels. Upper panel, prevalence at 100% detection sensitivity; lower panel, prevalence at 50% detection sensitivity. All the R0 values are estimated from the 2014 EHEC data. The unit for the x axis is one infectious period (1/γ). Note that the total simulation time is long enough so that even for the O111, O121, and O145 serogroups with R0 values of >1, the transmissions still eventually die out (lower panel). This is expected from the stochastic Markov model (22).
FIG 5
FIG 5
Estimated R0 values for serogroups using EHEC data under different sensitivity levels. The error bars represents standard errors associated with the basic reproduction numbers. All six non-O157 serogroups (EHEC data) have R0 values of <1 at the 100% and 90% sensitivity levels. Only O103 has an R0 value of >1 at the 75% level, while all other, non-O157 serogroups still have R0 values of <1 at the 75% level. At the 50% level, all non-O157 serogroups have R0 values of >1, although O26, O45, and O103 have values substantially larger than one while O111, O121, and O145 have values marginally larger than one.

References

    1. Boyce TG, Swerdlow DL, Griffin PM. 1995. Escherichia coli O157:H7 and the hemolytic-uremic syndrome. N Engl J Med 333:364–368. doi:10.1056/NEJM199508103330608. - DOI - PubMed
    1. Scallan E, Hoekstra RM, Angulo FJ, Tauxe RV, Widdowson MA, Roy SL, Jones JL, Griffin PM. 2011. Foodborne illness acquired in the United States—major pathogens. Emerg Infect Dis 17:7–15. doi:10.3201/eid1701.P11101. - DOI - PMC - PubMed
    1. Erickson M, Doyle M. 2007. Food as a vehicle for transmission of Shiga toxin-producing Escherichia coli. J Food Prot 70:2426–2449. - PubMed
    1. Armstrong GL, Hollingsworth J, Morris JG. 1996. Emerging foodborne pathogens: Escherichia coli O157:H7 as a model of entry of a new pathogen into the food supply of the developed world. Epidemiol Rev 18:29–51. doi:10.1093/oxfordjournals.epirev.a017914. - DOI - PubMed
    1. Rasmussen MA, Casey TA. 2001. Environmental and food safety aspects of Escherichia coli O157:H7 infections in cattle. Crit Rev Microbiol 27:57–73. doi:10.1080/20014091096701. - DOI - PubMed

Publication types

MeSH terms

LinkOut - more resources