. 2016 Sep 8;6(9):2817-27.
doi: 10.1534/g3.116.030783.

ChloroSeq, an Optimized Chloroplast RNA-Seq Bioinformatic Pipeline, Reveals Remodeling of the Organellar Transcriptome Under Heat Stress

Affiliations

ChloroSeq, an Optimized Chloroplast RNA-Seq Bioinformatic Pipeline, Reveals Remodeling of the Organellar Transcriptome Under Heat Stress

Benoît Castandet et al. G3 (Bethesda). .

Abstract

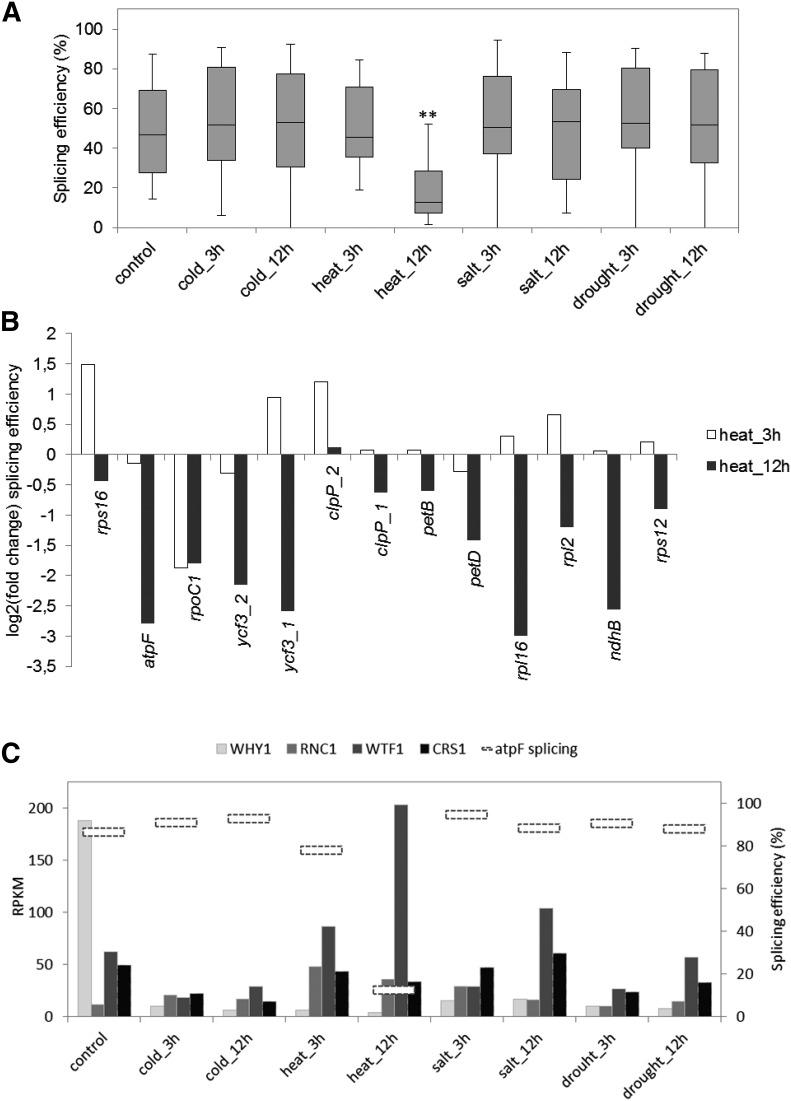
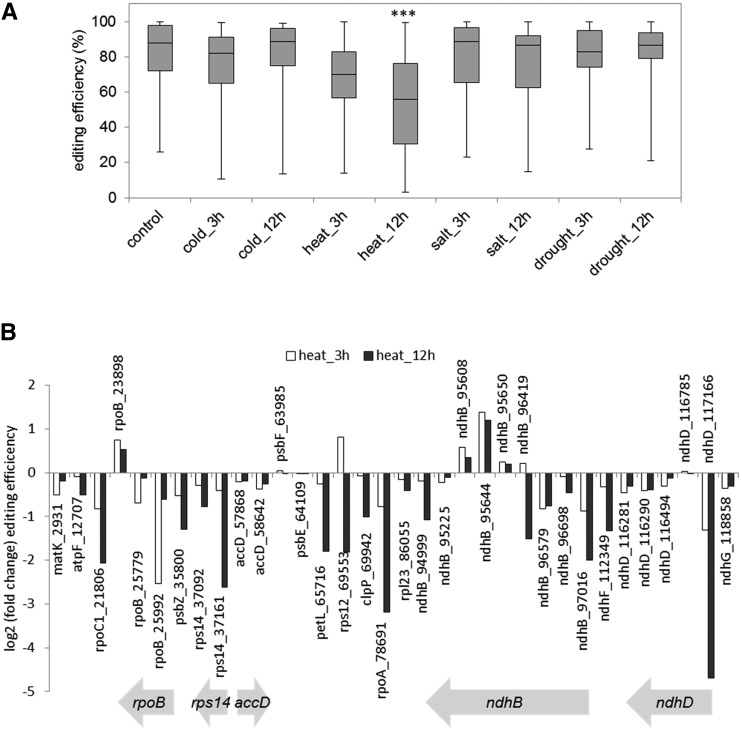
Although RNA-Seq has revolutionized transcript analysis, organellar transcriptomes are rarely assessed even when present in published datasets. Here, we describe the development and application of a rapid and convenient method, ChloroSeq, to delineate qualitative and quantitative features of chloroplast RNA metabolism from strand-specific RNA-Seq datasets, including processing, editing, splicing, and relative transcript abundance. The use of a single experiment to analyze systematically chloroplast transcript maturation and abundance is of particular interest due to frequent pleiotropic effects observed in mutants that affect chloroplast gene expression and/or photosynthesis. To illustrate its utility, ChloroSeq was applied to published RNA-Seq datasets derived from Arabidopsis thaliana grown under control and abiotic stress conditions, where the organellar transcriptome had not been examined. The most appreciable effects were found for heat stress, which induces a global reduction in splicing and editing efficiency, and leads to increased abundance of chloroplast transcripts, including genic, intergenic, and antisense transcripts. Moreover, by concomitantly analyzing nuclear transcripts that encode chloroplast gene expression regulators from the same libraries, we demonstrate the possibility of achieving a holistic understanding of the nucleus-organelle system. ChloroSeq thus represents a unique method for streamlining RNA-Seq data interpretation of the chloroplast transcriptome and its regulators.

Keywords: Arabidopsis thaliana; RNA editing; RNA splicing; RNA-Seq; chloroplast; heat stress; introns; noncoding RNAs; transcriptome.


Figures

Figure 1
Figure 1
Flow chart of the ChloroSeq strategy. RNA-Seq reads (obtained from public databases or a sequencing facility) in the FastQ format are aligned to the plastome genome using TopHat2. ChloroSeq is then applied to the bam file containing aligned reads, giving a complete view of the chloroplast transcriptome. Using the same data, it is possible to concomitantly analyze the nuclear transcriptome using, for example, the Tuxedo protocol. NCBI, National Center for Biotechnology Information; nt, nucleotide; RNA-Seq, RNA sequencing; RPKM, reads per kilobase per million mapped reads.
Figure 2
Figure 2
Heat map representation of chloroplast transcript levels following application of abiotic stresses. The window coverage data given by ChloroSeq analysis 1 was used to create the heat map. Low to high expression is represented by a green to red transition. Results are split between the forward (left) and reverse (right) strands. Dark gray stripes (outside lanes) represent known genic areas. The highly expressed psbA and rbcL genes, and the ribosomal operon are marked for reference. Vertical black arrows indicate the 12 hours heat stress treatment disscussed in the text.
Figure 3
Figure 3
Accumulation of as-atpH and as-rbcL under heat stress. (A) Normalized RNA-Seq read coverage in the atpH coding region (left panel) for 0 (blue line), 3 (green line), or 12 hr (red line) at 37° for either the plus or minus strands, with the gene model shown below depicting the extent of sense (gray arrows) and antisense atpH transcripts (dotted yellow arrow). The thick black line represents the strand-specific RNA probe used for gel blot analysis (right panel) to detect either as-atpH or sense atpH with 5 µg of total RNA. The atp operon model shows the major atpH-containing transcripts (lettered a–e correlating to bands identified in Germain et al. 2011). Stained 28S rRNA is included to reflect loading and size markers are shown at left. (B) Analysis of the rbcL coding region by RNA-Seq and gel blot as described for (A). For the rbcL sense gel blot, 1 µg of RNA was analyzed using a double-stranded DNA probe. nt, nucleotide; RNA-Seq, RNA sequencing; rRNA, ribosomal RNA.
Figure 4
Figure 4
Accumulation of transcripts encoding the plastid transcriptional machinery and ribonucleases under heat stress. (A) Fold gene expression compared to the control is on the log2 scale for 3 hr (white bars) and 12 hr (black bars) of heat stress, with the dotted line representing a twofold difference. RPOTp and RPOTmp encode the phage-type RNA polymerases; rpoA-C encode the bacterial-like RNA polymerase core subunits. (B) The graph description is as in (A). CSP41a and b encode the paralogous chloroplast stem-loop binding proteins/ribonucleases CSP41a and CSP41b; RNC3 and RNC4 encode redundant mini-ribonuclease III proteins; YbeY encodes endoribonuclease Y; RNJ encodes ribonuclease J; PNP encodes polynucleotide phosphorylase; and RNR encodes ribonuclease II/R. NEP, nuclear encoded polymerase; PEP, plastid encoded polymerase.
Figure 5
Figure 5
Increased intron accumulation under heat stress. Fold gene expression change of exons (A) and introns (B) between control and heat stress conditions by comparison of RPKM values. (C) RNA gel blot analysis of exons and introns for atpF (left) and petB (right) analyzed with double-stranded DNA probes (thick black bars in operon models) and 1 µg of total RNA. Letters on the right identify transcripts that are depicted in gene models under the blots. Stained 28S rRNA is included to reflect loading, and size markers are at the left. nt, nucleotide; RPKM, reads per kilobase per million mapped reads.
Figure 6
Figure 6
Heat stress inhibits splicing. (A) Box plot representation of splicing efficiencies under different stress conditions. The horizontal bars represent median splicing efficiencies and the top and bottom of the boxes represent 25 and 75% of the distribution, respectively. The top and bottom whiskers represent the highest and lowest efficiencies, respectively. The tRNA introns were omitted from the analysis because of poor coverage in this type of RNA-Seq library. ** P < 0.01 in a Student’s t-test. (B) Splicing efficiency change after 3 hr and 12 hr of heat stress as compared to control conditions. (C) Relationship between the splicing efficiency of the atpF intron (horizontal dashed boxes; Y2 axis) and expression of RNAs encoding protein factors involved in its splicing under different stress conditions (RPKM; Y1 axis). RNA-Seq, RNA sequencing; RPKM, reads per kilobase per million mapped reads.
Figure 7
Figure 7
Heat stress inhibits RNA editing. (A) Box plot representation of editing efficiencies under different stress conditions. The horizontal bar represents the median editing efficiencies and the top and bottom of the boxes represent 25 and 75% of the distribution, respectively. The top and bottom whiskers represent the highest and lowest editing efficiencies, respectively. Recently-discovered editing sites (Ruwe et al. 2013) were not included in the analysis, because they are poorly edited even under control conditions. *** P < 0.001 in a Student’s t-test. (B) Change in editing efficiency after 3 hr and 12 hr of heat stress, compared to control conditions. Genes containing more than one editing site are indicated by gene models across the bottom.

References

    1. Allorent G., Courtois F., Chevalier F., Lerbs-Mache S., 2013. Plastid gene expression during chloroplast differentiation and dedifferentiation into non-photosynthetic plastids during seed formation. Plant Mol. Biol. 82(1–2): 59–70. - PubMed
    1. Barkan A., 2011. Expression of plastid genes: organelle-specific elaborations on a prokaryotic scaffold. Plant Physiol. 155(4): 1520–1532. - PMC - PubMed
    1. Bentolila S., Oh J., Hanson M. R., Bukowski R., 2013. Comprehensive high-resolution analysis of the role of an Arabidopsis gene family in RNA editing. PLoS Genet. 9(6): e1003584. - PMC - PubMed
    1. Boussardon C., Salone V., Avon A., Berthome R., Hammani K., et al. , 2012. Two interacting proteins are necessary for the editing of the ndhD-1 site in Arabidopsis plastids. Plant Cell 24(9): 3684–3694. - PMC - PubMed
    1. Cahoon A. B., Takacs E. M., Sharpe R. M., Stern D. B., 2008. Nuclear, chloroplast, and mitochondrial transcript abundance along a maize leaf developmental gradient. Plant Mol. Biol. 66(1–2): 33–46. - PubMed

Publication types

Substances

LinkOut - more resources