. 2017 Jan;66(1):124-136.
doi: 10.1136/gutjnl-2016-312078. Epub 2016 Jul 8.

Myeloid cells are required for PD-1/PD-L1 checkpoint activation and the establishment of an immunosuppressive environment in pancreatic cancer

Affiliations

Myeloid cells are required for PD-1/PD-L1 checkpoint activation and the establishment of an immunosuppressive environment in pancreatic cancer

Yaqing Zhang et al. Gut. 2017 Jan.

Abstract

Background: Pancreatic cancer is characterised by the accumulation of a fibro-inflammatory stroma. Within this stromal reaction, myeloid cells are a predominant population. Distinct myeloid subsets have been correlated with tumour promotion and unmasking of anti-tumour immunity.

Objective: The goal of this study was to determine the effect of myeloid cell depletion on the onset and progression of pancreatic cancer and to understand the relationship between myeloid cells and T cell-mediated immunity within the pancreatic cancer microenvironment.

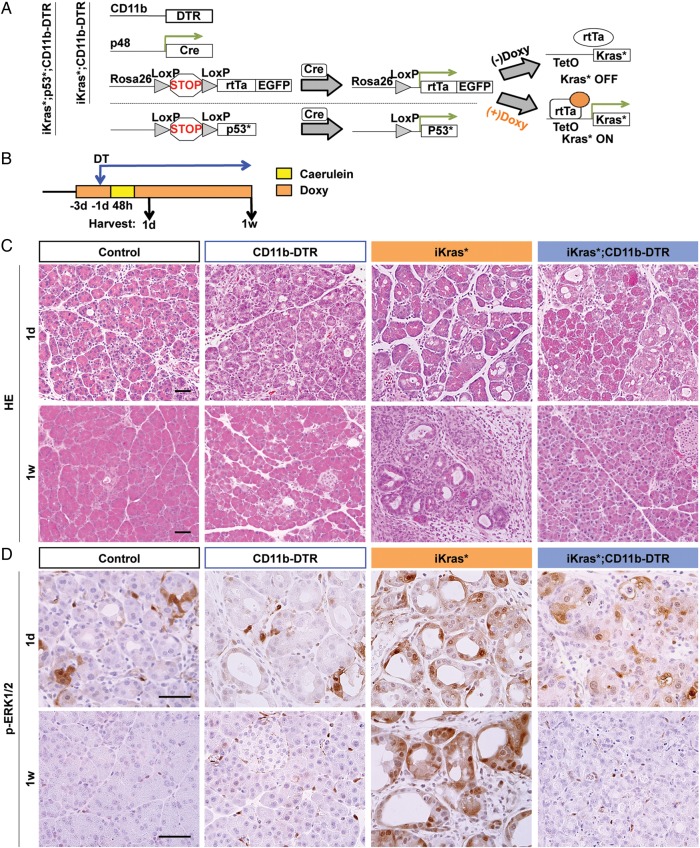
Methods: Primary mouse pancreatic cancer cells were transplanted into CD11b-diphtheria toxin receptor (DTR) mice. Alternatively, the iKras* mouse model of pancreatic cancer was crossed into CD11b-DTR mice. CD11b+ cells (mostly myeloid cell population) were depleted by diphtheria toxin treatment during tumour initiation or in established tumours.

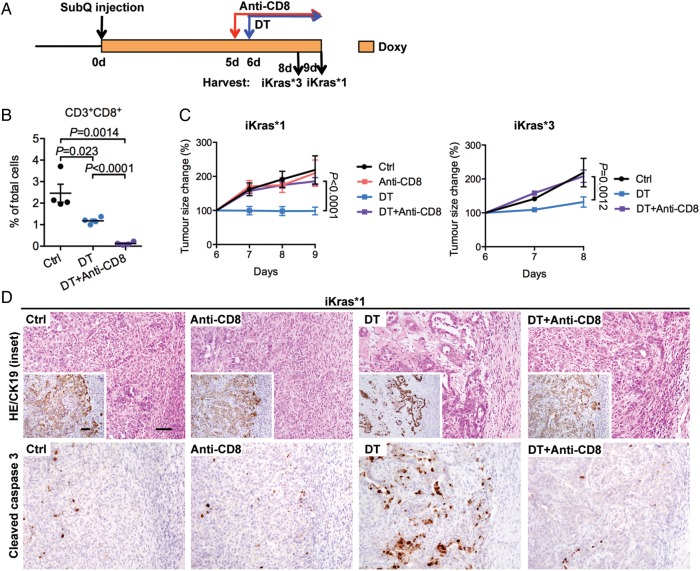
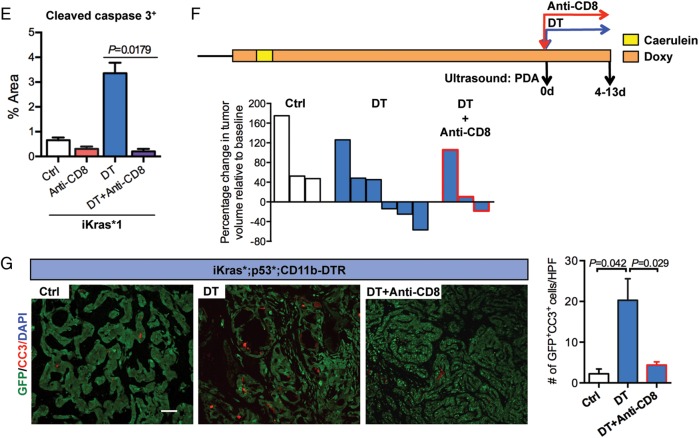
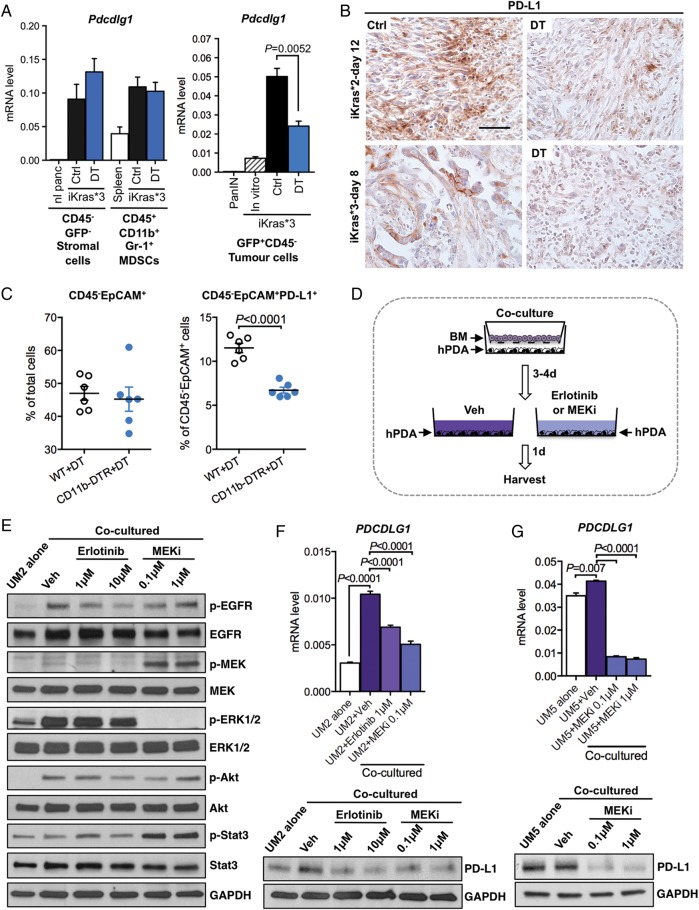
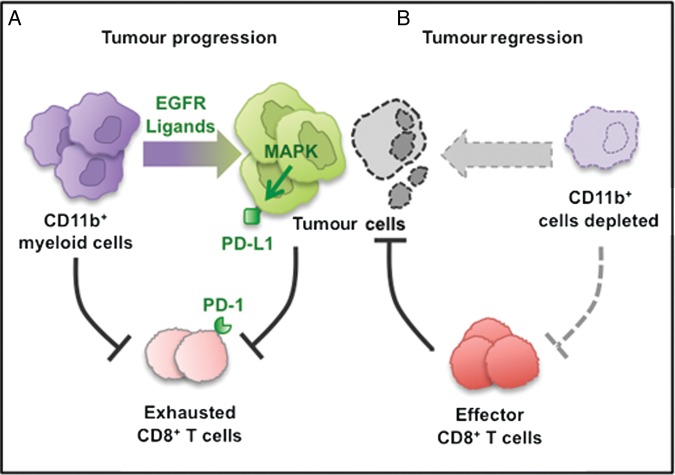
Results: Depletion of myeloid cells prevented KrasG12D-driven pancreatic cancer initiation. In pre-established tumours, myeloid cell depletion arrested tumour growth and in some cases, induced tumour regressions that were dependent on CD8+ T cells. We found that myeloid cells inhibited CD8+ T-cell anti-tumour activity by inducing the expression of programmed cell death-ligand 1 (PD-L1) in tumour cells in an epidermal growth factor receptor (EGFR)/mitogen-activated protein kinases (MAPK)-dependent manner.

Conclusion: Our results show that myeloid cells support immune evasion in pancreatic cancer through EGFR/MAPK-dependent regulation of PD-L1 expression on tumour cells. Derailing this crosstalk between myeloid cells and tumour cells is sufficient to restore anti-tumour immunity mediated by CD8+ T cells, a finding with implications for the design of immune therapies for pancreatic cancer.

Keywords: GENE REGULATION; IMMUNE RESPONSE; MACROPHAGES; PANCREATIC CANCER; SIGNAL TRANSDUCTION.


Conflict of interest statement

Conflicts of Interest: None declared.

Figures

Figure 1
Figure 1
CD11b+ myeloid cells are required for oncogenic Kras-driven pancreatic intraepithelial neoplasia (PanIN) formation. (A) Genetic makeup of the iKras*;CD11b- diphtheria toxin receptor (DTR) (p48Cre;TetO-KrasG12D; Rosa26rtTa-IRES-EGFP;CD11b-DTR) and iKras*;p53*;CD11b-DTR (p48Cre;TetO-KrasG12D; Rosa26rtTa-IRES-EGFP;p53R172H/+;CD11b-DTR) mouse models is shown. (B) Experimental design is shown. Doxycycline water was given to iKras* and iKras*;CD11b-DTR mice to induce Kras* expression for 3 days before 2 consecutive days of intraperitoneal caerulein injections to induce pancreatitis. Mice also received diphtheria toxin (DT) injection to deplete CD11b+ myeloid cells 1 day prior to pancreatitis induction; n=4–8 mice per time point. (C) H&E and (D) phosph-ERK1/2 staining of wild-type control, CD11b-DTR, iKras* and iKras*;CD11b-DTR pancreas 1 day and 1 week post-pancreatitis induction. Scale bar 50 μm.
Figure 2
Figure 2
Myeloid cells are required for pancreatic cancer growth and maintenance. (A) Experimental design showing subcutaneous tumour growth. Diphtheria toxin (DT) was given 1 day prior to subcutaneous tumour plantation. (B) Tumour growth curve of subcutaneous tumours is shown. Data represent mean±SEM, n=4–6. Statistical difference was analysed by two-way analysis of variance (ANOVA). (C) H&E staining of subcutaneous tumours from control and DT-treated CD11b-DT receptor (DTR) mice is shown. Scale bar 50 µm. (E) Experimental design showing subcutaneous tumour progression and maintenance. DT was given to deplete myeloid cells after the tumours were measurable. (F) Changes in tumour size (%) post-DT treatment are shown. Data represent mean±SEM, n=6–8. Statistical difference was analysed by two-way ANOVA between two groups. (H) H&E staining of subcutaneous 65 671 tumours is shown. Scale bar 50 µm. (G) Percentage of CD45+CD11b+ myeloid cells, CD45+CD11b+F4/80+ macrophages and CD45+CD11b+Gr1+ MDSCs in subcutaneous 65 671 tumours measured by flow cytometry. Data represent mean±SEM; each point indicates one tumour (n=5–6). The statistical difference was determined by two-tailed Student’s t-tests. MDSCs, myeloid-derived suppressor cells.
Figure 3
Figure 3
Myeloid cell depletion induces tumour cell death and enhances tumour-infiltrating CD8+ T cells. (A) Experimental design is shown. (B) Immunohistochemistry for cleaved caspase 3 and (D) co-immunofluorescent staining for TUNEL (red) and cytokeratin 19 (CK19) (green) in control and diphtheria toxin (DT)-treated subcutaneous tumours are shown. Scale bar 50 µm. Quantification of cleaved caspase 3+ areas per slide (%) and TUNEL+ cell number per high power field (HPF, 400×) are shown in (C). Data represent mean±SEM, n=3. The statistical difference was determined by two-tailed Student's t-test. (E) Co-immunofluorescent staining for CD8 (red), GFP (green), CD3 (grey) and DAPI (blue) in control and DT-treated iKras*1 and iKras*2 subcutaneous tumours is shown. Scale bar 25 µm. Yellow arrows indicate CD3+CD8+ T cells. (F) Quantification of CD3+CD8+ T-cell number per HPF. Data represent mean±SEM, n=3–5. The statistical difference was determined by two-tailed Student’s t-test. (G) Quantitative real time-PCR showing interferon γ (Ifnγ), Ifnβ1 and perforin-1 expressions in control and DT-treated subcutaneous tumours. Data represent mean±SEM; each point indicates one sample (n=4–7). The statistical difference was determined by two-tailed Student’s t-test. DAPI, 4',6-diamidino-2-phenolindole.
Figure 4
Figure 4
CD8+ T cells depletion rescues tumour progression in myeloid cell-depleted mice. (A) Experimental design is shown. (B) Percentage of CD3+CD8+ T cells in control, diphtheria toxin (DT) treated or both DT and anti-CD8-treated iKras*3 subcutaneous tumours measured by flow cytometry is shown. Data represent mean±SEM; each point indicates one tumour (n=4). The statistical difference was determined by two-tailed Student’s t-test. (C) Tumour size change (%) of iKras*1 and iKras*3 subcutaneous tumours extracted from the control, DT and/or anti-CD8 treated CD11b-DT receptor (DTR) mice is shown. Data represent mean±SEM, n=6. The statistical difference between groups was analysed by two-way analysis of variance. (D) H&E staining and immunohistochemistry for cytokeratin 19 (CK19) and cleaved caspase 3 in control, DT and/or anti-CD8-treated iKras*1 subcutaneous tumours are shown. Scale bar 50 µm. (E) Quantification of cleaved caspase 3+ areas per slide (%) is shown. Data represent mean±SEM, n=3. The statistical difference was determined by two-tailed Student’s t-test. (F) Experimental design: iKras*;p53*;CD11b-DTR mice were maintained on doxy water after pancreatitis induction and monitored for tumour formation. After pancreatic tumours identified by ultrasound, mice were given DT or in combination of anti-CD8 treatment. Tumour size was determined by ultrasound imaging. (G) Co-immunofluorescent staining for cleaved caspase 3 (CC3, red), GFP (green) and DAPI (blue) in tumours from control, DT with or without anti-CD8-treated mice is shown. Scale bar 50 µm. Graph depicts the quantification of apoptotic tumour cells per high power field (HPF, 200X). Data represent mean±SEM, three HPF for each mouse. Statistical difference was determined by two-tailed Student’s t-tests. DAPI, 4',6-diamidino-2-phenolindole.
Figure 4
Figure 4
CD8+ T cells depletion rescues tumour progression in myeloid cell-depleted mice. (A) Experimental design is shown. (B) Percentage of CD3+CD8+ T cells in control, diphtheria toxin (DT) treated or both DT and anti-CD8-treated iKras*3 subcutaneous tumours measured by flow cytometry is shown. Data represent mean±SEM; each point indicates one tumour (n=4). The statistical difference was determined by two-tailed Student’s t-test. (C) Tumour size change (%) of iKras*1 and iKras*3 subcutaneous tumours extracted from the control, DT and/or anti-CD8 treated CD11b-DT receptor (DTR) mice is shown. Data represent mean±SEM, n=6. The statistical difference between groups was analysed by two-way analysis of variance. (D) H&E staining and immunohistochemistry for cytokeratin 19 (CK19) and cleaved caspase 3 in control, DT and/or anti-CD8-treated iKras*1 subcutaneous tumours are shown. Scale bar 50 µm. (E) Quantification of cleaved caspase 3+ areas per slide (%) is shown. Data represent mean±SEM, n=3. The statistical difference was determined by two-tailed Student’s t-test. (F) Experimental design: iKras*;p53*;CD11b-DTR mice were maintained on doxy water after pancreatitis induction and monitored for tumour formation. After pancreatic tumours identified by ultrasound, mice were given DT or in combination of anti-CD8 treatment. Tumour size was determined by ultrasound imaging. (G) Co-immunofluorescent staining for cleaved caspase 3 (CC3, red), GFP (green) and DAPI (blue) in tumours from control, DT with or without anti-CD8-treated mice is shown. Scale bar 50 µm. Graph depicts the quantification of apoptotic tumour cells per high power field (HPF, 200X). Data represent mean±SEM, three HPF for each mouse. Statistical difference was determined by two-tailed Student’s t-tests. DAPI, 4',6-diamidino-2-phenolindole.
Figure 5
Figure 5
Myeloid cells regulate programmed cell death-ligand 1 (PD-L1) expression in pancreatic cancer cell through epidermal growth factor receptor (EGFR)/mitogen-activated protein kinases (MAPK) signalling. (A) Quantitative real time (qRT)-PCR for Pdcdlg1 expression in flow sorted CD45GFP stromal cells and CD45+CD11b+Gr-1+ MDSCs; Pdcdlg1 expression in pancreatic intraepithelial neoplasia (PanIN) cells, iKras*3 in vitro cells and flow sorted GFP+CD45 subcutaneous iKras*3 tumour cells. Data represent mean±SEM, n=3. The statistical difference was determined by two-tailed Student’s t-test. (B) Immunohistochemistry for PD-L1 in control and diphtheria toxin (DT)-treated subcutaneous tumours is shown. Scale bar 25 µm. (C) Percentage of CD45EpCAM+ tumour cells and CD45EpCAM+PD-L1+ tumour cells in subcutaneous 65 671 tumours extracted form DT-treated wild-type mice or CD11b-DT receptor (DTR) mice measured by flow cytometry is shown. Data represent mean±SEM; each point indicates one tumour (n=6). The statistical difference was determined by two-tailed Student’s t-test. (D) Experimental design of the co-culture experiments is shown. (E) Western blotting showing EGFR, MAPK, AKT, STAT3 signalling pathway components in UM2 cultured alone, co-cultured with bone marrow (BM) cells and followed by vehicle, erlotinib or MAPK kinase (MEK) inhibitor (MEKi) treatment. (F) qRT-PCR showing PDCDLG1 expression and western blotting for PD-L1 levels in primary human pancreatic ductal adenocarcinoma (PDA) cell line UM2 cultured alone, co-cultured with BM cells and followed by vehicle, erlotinib or MEKi treatment. Data represent mean±SEM, n=3. The statistical difference was determined by two-tailed Student’s t-tests. (G) qRT-PCR for PDCDLG1 expression and western blotting for PD-L1 levels in primary human PDA cell line UM5 cultured alone, co-cultured with BM cells and followed by vehicle or MEKi treatment are shown. Data represent mean±SEM, n=3. The statistical difference was determined by two-tailed Student’s t-tests. AKT, protein kinase B (PKB), also known as Akt; MDSCs, myeloid-derived suppressor cells; qRT, quantative real time.
Figure 6
Figure 6
Mitogen-activated protein kinase(MAPK) inactivation in vivo downregulates programmed cell death-ligand 1 (PD-L1) expression on tumour cells. (A) Experimental design is shown. (B) Changes in tumour size (%) post-MAPK kinase (MEK) inhibitor (MEKi) treatment. Data represent mean±SEM, n=4–6. Statistical difference between two groups was analysed by two-way analysis of variance (ANOVA). (C) By flow cytometry, the percentages of CD45EpCAM+PD-L1+ tumour cells and CD45+CD11b+PD-L1+ myeloid cells in subcutaneous 65 671 tumours and iKras*3 tumours extracted from vehicle or MEKi-treated mice were measured. Data represent mean±SEM; each point indicates one tumour (n=4–6). The statistical difference was determined by two-tailed Student’s t-test. (D) Western blotting showing PD-L1 and phosph-ERK1/2 levels in subcutaneous iKras*3 tumours post-vehicle or MEKi treatment. Data represent mean±SEM, n=3. (E) Co-immunofluorescent staining showing E-cadherin (green), PD-L1 (red), phosph-ERK1/2 (magenta) and DAPI (blue) in vehicle or MEKi-treated subcutaneous 65 671 tumours. Scale bar 50 µm. (F) Co-immunofluorescent staining showing GFP (green), PD-L1 (red), phosph-ERK1/2 (magenta) and DAPI (blue) in vehicle or MEKi-treated subcutaneous iKras*3 tumours. Magenta arrows indicate GFP+PD-L1+phosph-ERK1/2+ tumour cells; green arrows indicate GFP+PD-L1phosph-ERK1/2 tumour cells. Scale bar 50 µm. (G) Experimental design and graph showing the changes in tumour size (%) post-MEKi and/or anti-PD-1 treatment. Data represent mean±SEM, n=4–6. Statistical difference between two groups was analysed by two-way ANOVA. DAPI, 4',6-diamidino-2-phenolindole.
Figure 7
Figure 7
Diagram depicting our working model. The CD11b+ myeloid cells protect tumour cell viability by blocking CD8+ T-cell-mediated anti-tumour responses in pancreatic cancer. (A) CD11b+ myeloid cells block anti-tumour CD8+ T cells immune responses partially by activating the programmed cell death-1 (PD-1)/PD-ligand 1 (PD-L1) checkpoint. (B) CD11b+ myeloid cell depletion reverses immune suppression and enables CD8+ T-cell effector function, thus blocking tumour growth.

Comment in

References

    1. Hingorani SR, Petricoin EF, Maitra A, et al. Preinvasive and invasive ductal pancreatic cancer and its early detection in the mouse. Cancer Cell 2003;4:437–50. 10.1016/S1535-6108(03)00309-X - DOI - PubMed
    1. Clark CE, Hingorani SR, Mick R, et al. Dynamics of the immune reaction to pancreatic cancer from inception to invasion. Cancer Res 2007;67:9518–27. 10.1158/0008-5472.CAN-07-0175 - DOI - PubMed
    1. Zhang Y, Yan W, Mathew E, et al. CD4+ T lymphocyte ablation prevents pancreatic carcinogenesis in mice. Cancer Immunol Res 2014;2:423–35. 10.1158/2326-6066.CIR-14-0016-T - DOI - PMC - PubMed
    1. McAllister F, Bailey JM, Alsina J, et al. Oncogenic Kras activates a hematopoietic-to-epithelial IL-17 signaling axis in preinvasive pancreatic neoplasia. Cancer Cell 2014;25:621–37. 10.1016/j.ccr.2014.03.014 - DOI - PMC - PubMed
    1. Winograd R, Byrne KT, Evans RA, et al. Induction of T-cell immunity overcomes complete resistance to PD-1 and CTLA-4 blockade and improves survival in pancreatic carcinoma. Cancer Immunol Res 2015;3:399–411. 10.1158/2326-6066.CIR-14-0215 - DOI - PMC - PubMed

MeSH terms