Review
. 2016 Dec 28;95(6 Suppl):15-34.
doi: 10.4269/ajtmh.16-0141. Epub 2016 Jul 11.

Global Epidemiology of Plasmodium vivax

Affiliations
Review

Global Epidemiology of Plasmodium vivax

Rosalind E Howes et al. Am J Trop Med Hyg. .

Abstract

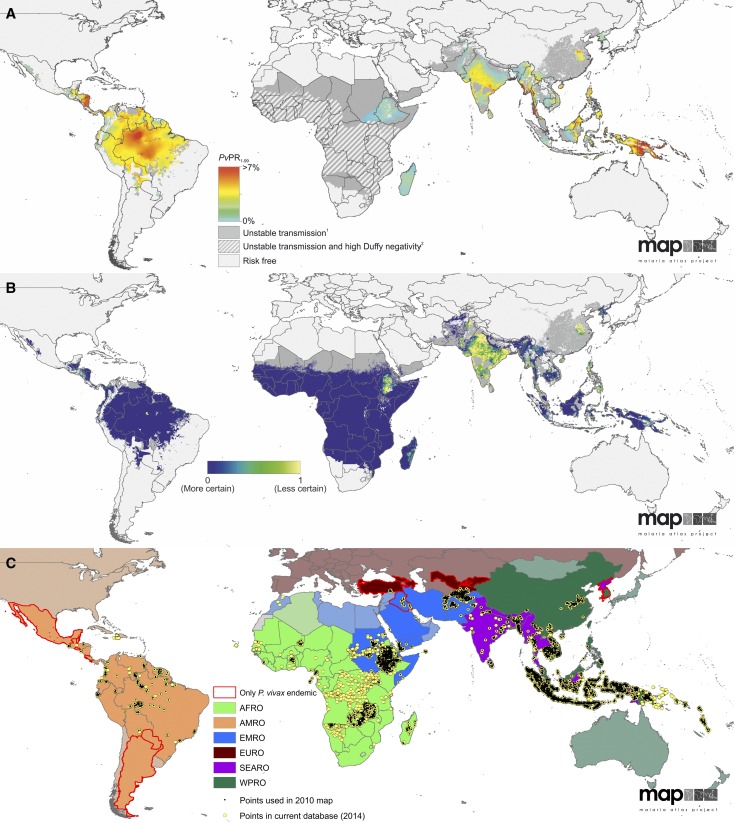
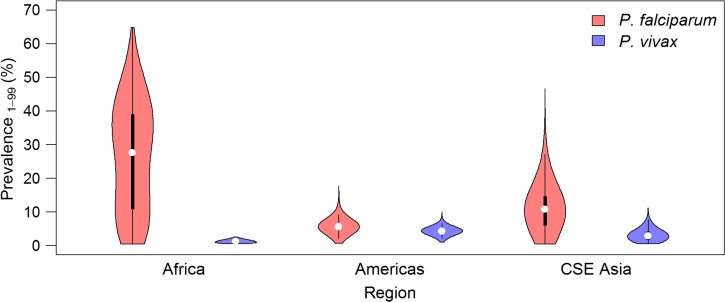
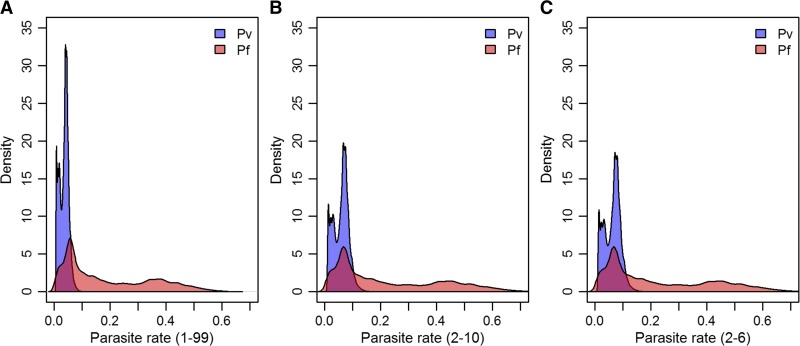
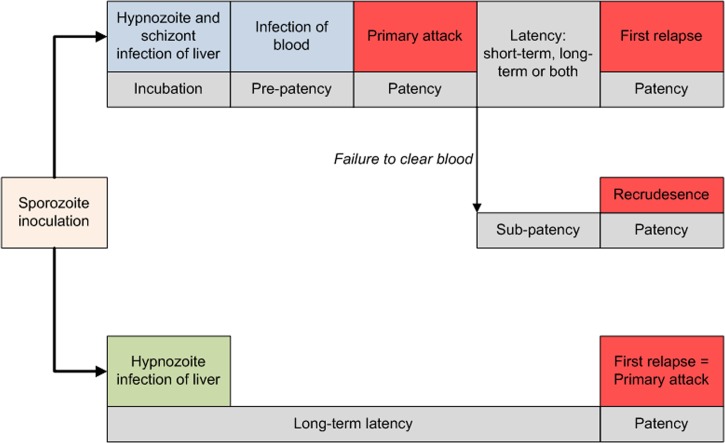
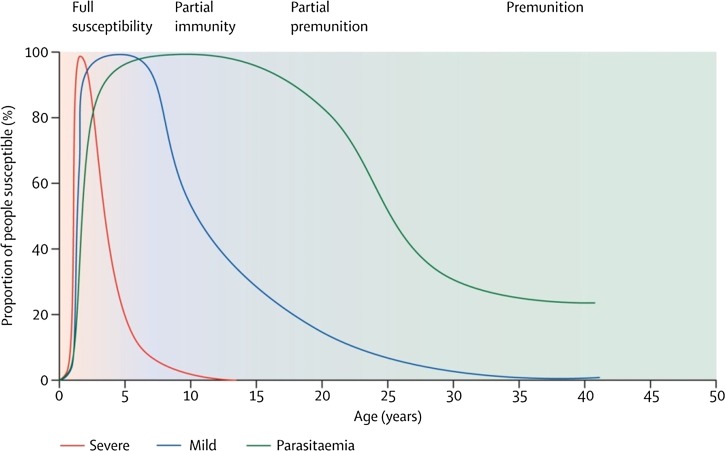
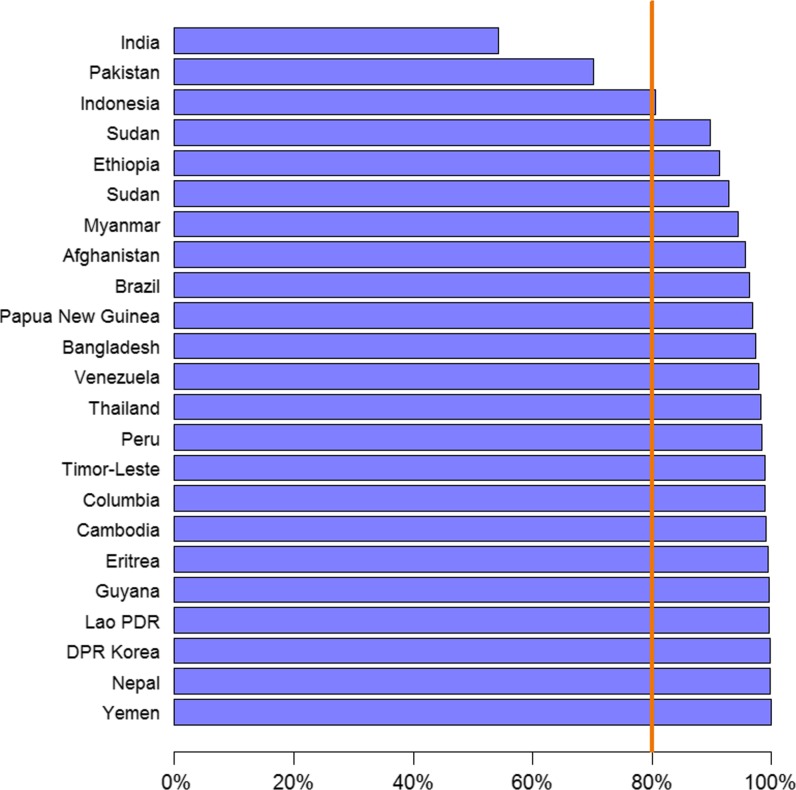
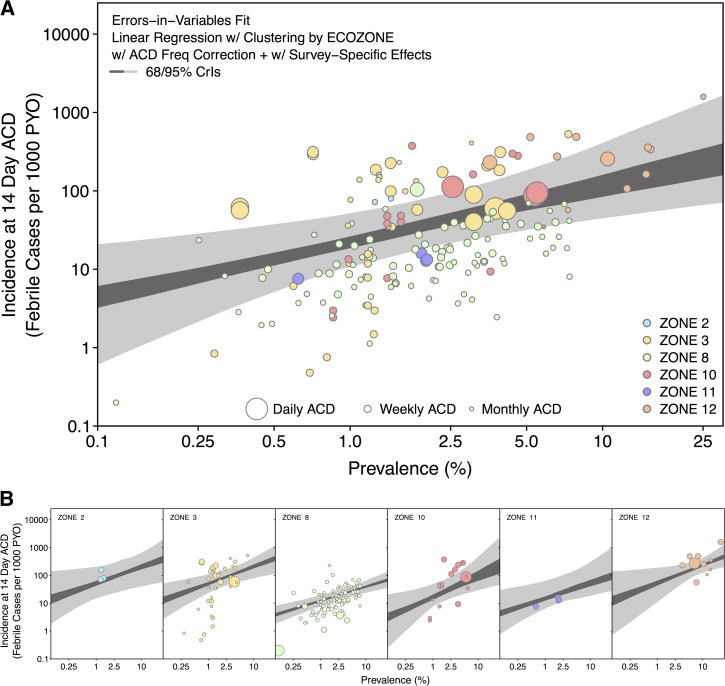
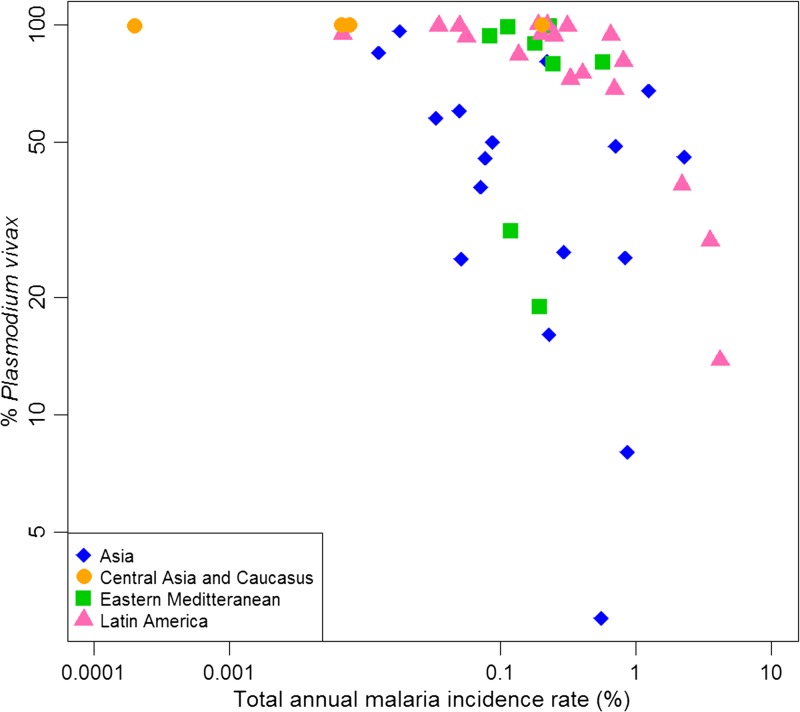
Plasmodium vivax is the most widespread human malaria, putting 2.5 billion people at risk of infection. Its unique biological and epidemiological characteristics pose challenges to control strategies that have been principally targeted against Plasmodium falciparum Unlike P. falciparum, P. vivax infections have typically low blood-stage parasitemia with gametocytes emerging before illness manifests, and dormant liver stages causing relapses. These traits affect both its geographic distribution and transmission patterns. Asymptomatic infections, high-risk groups, and resulting case burdens are described in this review. Despite relatively low prevalence measurements and parasitemia levels, along with high proportions of asymptomatic cases, this parasite is not benign. Plasmodium vivax can be associated with severe and even fatal illness. Spreading resistance to chloroquine against the acute attack, and the operational inadequacy of primaquine against the multiple attacks of relapse, exacerbates the risk of poor outcomes among the tens of millions suffering from infection each year. Without strategies accounting for these P. vivax-specific characteristics, progress toward elimination of endemic malaria transmission will be substantially impeded.


Figures

Figure 1.
Figure 1.
The spatial distribution of Plasmodium vivax, associated uncertainty, and input data records. (A) The limits and endemicity of P. vivax in 2010. Spatial limits of parasite-specific malaria risk are defined by annual parasite incidence (PvAPI) with further medical intelligence, temperature, and aridity masks. Areas were defined as stable, unstable (dark grey areas, PvAPI < 0.1 per 1,000 per annum), or no risk (light grey). The model-based geostatistics point estimates of the annual mean predicted prevalence are shown within the spatial limits of stable transmission. Estimates of parasite rate standardized to 1- to 99-year-olds (PvPR1–99) that range from 0% to > 7% are shown as a spectrum of blue to red. Hatching indicates areas where Duffy negativity gene frequency is predicted to exceed 90%. (B) The population-weighted uncertainty as the ratio of the posterior interquartile range to the posterior mean prediction at each pixel on a blue to yellow color spectrum multiplied by the underlying population density and rescaled to 0–1. Higher values (yellow) indicate areas with high uncertainty and large populations. (C) World Health Organization regions by color: the African region (AFRO) in green, the region of the Americas (AMRO) in orange, the eastern Mediterranean region (EMRO) in blue, the European region (EURO) in burgundy, the southeast Asian region (SEARO) in purple, and the western Pacific region (WPRO) in dark green. The countries in each region that are not endemic for P. vivax are slightly greyed out and shaded a lighter color. Those countries that are endemic only with P. vivax malaria are outlined in red. The location of the prevalence surveys that were input into the model that produced the map in Figure 1A is shown as small black points and the surveys conducted since 2010 are shown in yellow, illustrating the increased attention given to P. vivax in recent years.
Figure 2.
Figure 2.
Comparison of Plasmodium falciparum and Plasmodium vivax prevalence. Prevalence values from P. falciparum and P. vivax endemicity surfaces, standardized to the 1- to 99-year age range. The shaded areas correspond to each species and show a smoothed approximation of the frequency distribution (a kernel density plot) of parasite prevalence within each geographic region. The black central bar represents the interquartile range and the white circles indicate the median values. CSE Asia = Central and Southeast Asia.
Figure 3.
Figure 3.
Density plots of parasite rate (PR) pixels for Plasmpdium falciparum and Plasmodium vivax in all regions excluding Africa. The plot (A) shows the PR values age standardized, to all ages (1–99 years), (B) is standardized to 2- to 10-year-olds, and (C) 2- to 6-year-olds. The plots show that regardless of age, the vast majority of P. vivax is found at lower prevalence values.
Figure 4.
Figure 4.
Pathways to infection of blood and clinical attacks in Plasmodium vivax malaria.
Figure 5.
Figure 5.
Zoo-geographical zones and observed time to first relapse. (A) The zoo-geographical zones used to describe the time to first relapse. (B) The median observed time to relapse in each study used to obtain individual data. The size of each point varies by sample size and the time to first relapse is shown on a spectrum of red (< 1 month) to dark blue (> 12 months). (C) Violin plots show the observed time to first relapse in individuals from each zone in Figure 5A. The colored areas correspond to each zone and show a smoothed approximation of the frequency distribution (a kernel density plot) of the time to relapse within each geographic region. The black central bars represent the interquartile range, and the white circles indicate the median values.
Figure 6.
Figure 6.
Modeled relapse incidence and mean time to relapse. (A) The relapse incidence per 100,000 person days on a spectrum of blue to red, with red being the highest incidence of relapse. Zone 8 is hatched to indicate that the prediction is to be interpreted with caution. (B) The predicted mean time to relapse on a spectrum from blue to red, with red being most frequent relapse. The numbers of the zones correspond to those shown in Figure 5A.
Figure 7.
Figure 7.
Schematic of the age–parasite rate relationship by endemicity class. The curves generated by a model for Plasmodium falciparum (Plasmodium vivax would follow a similar pattern) show the age–parasite relationship at different endemicity levels: holoendemic areas are dark green (category of highest transmission levels), hyperendemicity areas green, mesoendemic areas light green, and hypoendemic areas olive green. Figure reproduced from Smith and others (2007).
Figure 8.
Figure 8.
The proportion of infections detected by microscopy versus proportion detected by polymerase chain reactions (PCR) for Plasmodium falciparum and Plasmodium vivax. Derived from data in Okell and others 2012 supplementary information. Only surveys where both P. vivax and P. falciparum were detected are shown. Of the 44 data points for each species, all but four were for all age groups—the remaining four considered children under age 5 only.
Figure 9.
Figure 9.
Relation between age and malaria severity in an area of moderate Plasmodium falciparum transmission intensity. With repeated exposure, protection is acquired first against severe malaria, then against illness with malaria, and much more slowly, against microscopy-detected parasitemia. Figure reproduced with permission from White and others.
Figure 10.
Figure 10.
Cumulative proportion of the global estimated Plasmodium vivax cases accounted for by the countries with the highest number of cases. Reproduced from the World Malaria Report 2014. Lao PDR refers to Lao People's Democratic Republic and DPR Korea to Democratic People's Republic of Korea.
Figure 11.
Figure 11.
Modeled relationship between parasite prevalence and clinical case incidence for Plasmodium vivax. (A) The pooled prevalence–incidence relationship as point-wise 68% and 95% credible intervals (CrIs) based on data from all zones (Figure 5). To produce a pooled fit, the posterior of each zone was weighted by the number of observations from that zone. (B) The zone-specific prevalence–incidence relationships. Zone 2 is Central America, zone 3 is South America, zone 8 is Monsoon Asia (India), zone 10 is southeast Asia, zone 11 is northern Asia and Europe, and Zone 12 is Melanesia. The 95% CrIs are shown in light grey and the 68% CrIs in dark grey. The colors of the zones correspond to those shown in Figure 6B. Reproduced from Battle and others.
Figure 12.
Figure 12.
The variation of the proportion of malaria cases due to Plasmodium vivax with the annual malaria incidence rates in endemic countries, as published in 2001 (the rest being mainly due to Plasmodium falciparum) shown on a logarithmic scale. The data points are color coded and shaped by region. Asia includes Bangladesh, Bhutan, Cambodia, China, Lao People's Democratic Republic, Malaysia, Myanmar, Nepal, Papua New Guinea, Philippines, Solomon Islands, Sri Lanka, Thailand, Vanuatu, and Vietnam. Central Asia and Caucasus includes Armenia, Azerbaijan, Tajikistan, and Turkey. Eastern Mediterranean refers to Afghanistan, Iran, Iraq, Oman, Pakistan, Saudi Arabia, Syria, and Yemen. Latin America includes Argentina, Belize, Bolivia, Brazil, Colombia, Costa Rica, Dominican Republic, Ecuador, El Salvador, Guatemala, French Guyana, Guyana, Haiti, Honduras, Mexico, Nicaragua, Panama, Peru, Suriname, and Venezuela. The percentage of P. vivax for each country is as cases reported by the countries to World Health Organization. Note that the figure excludes data from the African region because high prevalence of the Duffy negativity phenotype results in very low P. vivax transmission and occasional case reports of P. vivax are vastly outnumbered by P. falciparum cases. Figure modified from the original published version, and shared by Kamini Mendis.
Figure 13.
Figure 13.
The locations of (A) documented chloroquine-resistant and (B) chloroquine-sensitive Plasmodium vivax. Chloroquine resistance was categorized according to the strength of evidence: Category 1: > 10% recurrence by day 28, irrespective of confirmation of adequate blood chloroquine concentration; Category 2: confirmed recurrences by day 28 within reported whole-blood chloroquine concentration of > 100 nm; and Category 3: > 5% recurrences by day 28, irrespective of chloroquine concentration. Chloroquine sensitivity was confirmed if patients had enrolled after a symptomatic clinical illness, fewer than 5% recurrences had occurred by day 28, no primaquine was given before day 28, and studies had a sample size of at least 10 patients. Case reports were observations in individual patients of treatment failure during chloroquine prophylaxis, prolonged parasite clearance or P. vivax recurrence following treatment. Figure reproduced from Price and others (2014).

Similar articles

Cited by

References

    1. PATH . Staying the Course? Malaria Research and Development in a Time of Economic Uncertainty. Seattle, WA: PATH; 2011.
    1. Gething PW, Elyazar IR, Moyes CL, Smith DL, Battle KE, Guerra CA, Patil AP, Tatem AJ, Howes RE, Myers MF, George DB, Horby P, Wertheim HF, Price RN, Mueller I, Baird JK, Hay SI. A long neglected world malaria map: Plasmodium vivax endemicity in 2010. PLoS Negl Trop Dis. 2012;6:e1814. - PMC - PubMed
    1. Gething PW, Patil AP, Smith DL, Guerra CA, Elyazar IR, Johnston GL, Tatem AJ, Hay SI. A new world malaria map: Plasmodium falciparum endemicity in 2010. Malar J. 2011;10:378. - PMC - PubMed
    1. Mueller I, Galinski MR, Tsuboi T, Arevalo-Herrera M, Collins WE, King CL. Natural acquisition of immunity to Plasmodium vivax: epidemiological observations and potential targets. Adv Parasitol. 2013;81:77–131. - PubMed
    1. Baird JK. Evidence and implications of mortality associated with acute Plasmodium vivax malaria. Clin Microbiol Rev. 2013;26:36–57. - PMC - PubMed