. 2016 Jul;106(1):75-92.
doi: 10.1002/jeab.215. Epub 2016 Jul 12.

Concurrent nonindependent fixed-ratio schedules of alcohol self-administration: Effects of schedule size on choice

Affiliations

Concurrent nonindependent fixed-ratio schedules of alcohol self-administration: Effects of schedule size on choice

Richard A Meisch et al. J Exp Anal Behav. 2016 Jul.

Abstract

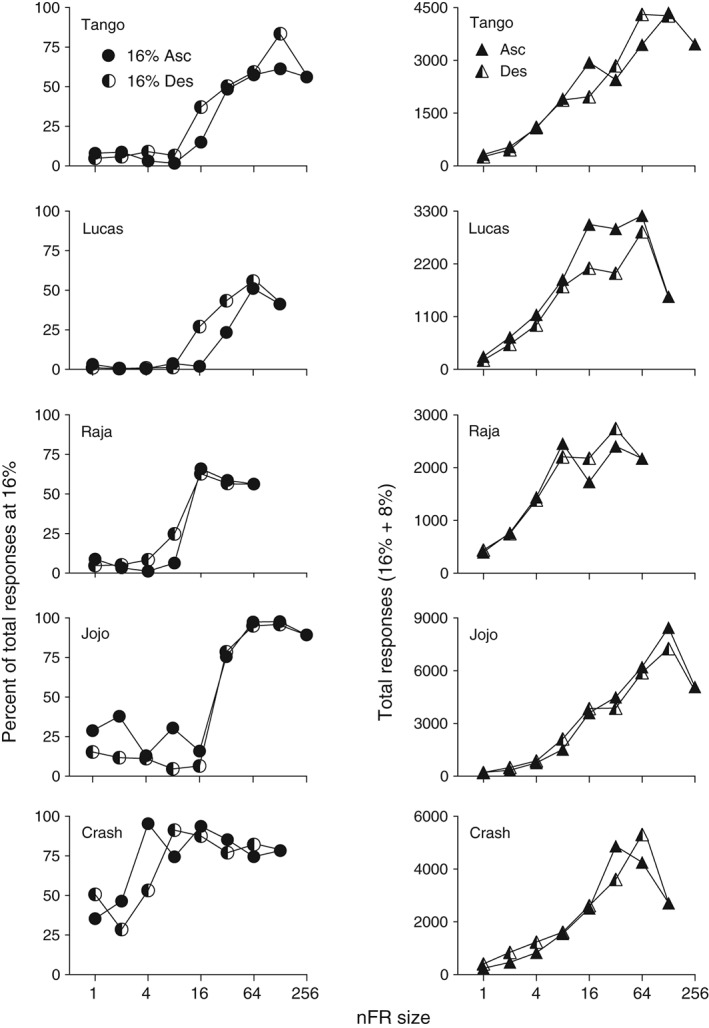
Choice behavior was studied under concurrent nonindependent fixed-ratio fixed-ratio (nFR) schedules of reinforcement, as these schedules result in frequent changeover responses. With these schedules, responses on either operandum count toward the completion of the ratio requirements of both schedules. Five monkeys were subjects, and two pairs of liquid reinforcers were concurrently available: 16% (w/v) and 0% ethanol or 16% and 8% ethanol. For each pair of reinforcers, the nFR sizes were systematically altered across sessions while keeping the schedule size equal for both liquids. Responding varied as a function of reinforcer pair and nFR size. With the 16% and 0% pair, higher response rates were maintained by 16% and were an inverted U-shape function of nFR size. With 16% and 8%, a greater number of responses initially occurred on the schedule that delivered 8% ethanol. However, as nFR size increased, preference reversed such that responses that delivered 16% ethanol were greater. When the nFR size was subsequently decreased, preference reverted back to 8%. Number of responses emitted per delivery was a dependent variable and, in behavioral economic terms, was the price paid for each liquid delivery. With 16% and 0%, changeover responses initially increased and then decreased as schedule size became larger. In contrast, with the 16% and 8% pair, changeover responses increased directly with schedule size. Responding under nFR schedules is sensitive to differences in reinforcer magnitude and demonstrates that relative reinforcing effects can change as a function of schedule size.

Keywords: alcohol self-administration; changeover responses; choice; mouth-contact response; nonindependent fixed-ratio schedules; preference reversal; rhesus monkeys; schedule size.


Figures

Figure 1
Figure 1
Responses are shown as a function of nFR schedule size for five monkeys. Panels on the left are for 16 and 0% ethanol (w/v) and panels on the right are for 16 and 8%. Each point is a mean of six consecutive sessions of stable behavior. Disconnected points at FR 1 represent redetermined values. Brackets denote the standard deviation (SD); absence of brackets at a point indicates the SD fell within the area occupied by the point. Note the different ordinate scales for each monkey.
Figure 2
Figure 2
Percent of all responses (16% + 8%) comprised by responses on the spout that delivered 16% ethanol (w/v) (left panels), and total responses per session (16% + 8%) (right panels). Filled symbols represent means for the ascending series of nFR sizes; half‐filled symbols indicate values for the descending series. Each point is a mean of six consecutive sessions of stable behavior. Note the different ordinate scales for each monkey in the right column.
Figure 3
Figure 3
Liquid deliveries are shown as a function of nFR schedule size for five monkeys. Panels on the left are for 16 and 0% ethanol (w/v) and panels on the right are for 16 and 8%. Each point is a mean of six consecutive sessions of stable behavior. Disconnected points at FR 1 represent redetermined values. Brackets denote the standard deviation (SD); absence of brackets at a point indicates the SD fell within the area occupied by the point. Note the different ordinate scales for each monkey.
Figure 4
Figure 4
Responses per delivery as a function of nFR size for five monkeys. Panels on the left are for 16 and 0% ethanol (w/v) and panels on the right are for 16 and 8%. Each point is a mean of six consecutive sessions of stable behavior. Brackets denote the standard deviation (SD); absence of brackets at a point indicates the SD fell within the area occupied by the point. Note the different ordinate scales for each monkey.
Figure 5
Figure 5
Response rates, as concurrent nFR schedule size increased, are plotted in relation to the dependent variable of responses emitted per delivery. The responses per session are the same as in Figure 1. However, the abscissa is different: It shows the mean number of responses per delivery. Panels on the left are for 16 and 0% ethanol (w/v) and panels on the right are for 16 and 8%. Each point is a mean of six consecutive sessions of stable behavior. Disconnected points at FR 1 represent redetermined values. Brackets denote the standard deviation (SD); absence of brackets at a point indicates the SD fell within the area occupied by the point. Note the different ordinate scales for each monkey.
Figure 6
Figure 6
Changeover responses as a function of nFR size for five monkeys. Panels on the left are for 16 and 0% ethanol (w/v) and panels on the right are for 16 and 8%. Each point is a mean of six consecutive sessions of stable behavior. Disconnected points at FR 1 represent redetermined values. Brackets denote the standard deviation (SD); absence of brackets at a point indicates the SD fell within the area occupied by the point. Note the different ordinate scales for each monkey.
Figure 7
Figure 7
Percent of the nFR requirement completed for each liquid as a function of nFR size. The percent was calculated by dividing the number of responses by the total number of responses that would have been necessary in the absence of changeover responses. Panels on the left are for 16 and 0% ethanol (w/v) and panels on the right are for 16 and 8%. Each point is a mean of six consecutive sessions of stable behavior.
Figure 8
Figure 8
Mean percent responses (left panels) and mean percent deliveries (right panels) plotted as a percent of values obtained at FR 1, with 16% and 0% ethanol concurrently available. Each point is a mean of six consecutive sessions of stable behavior. Note that the range of the ordinates is from 10 to 10,000 for responses and from 1 to 1,000 for deliveries.

Similar articles

Cited by

References

    1. Banks, M. L. , Hutsell, B. A. , Blough, B. E. , Poklis, J. L. , & Negus, S. S. (2015). Preclinical assessment of lisdexamfetamine as an agonist medication candidate for cocaine addiction: Effects in rhesus monkeys trained to discriminate cocaine or to self‐administer cocaine in a cocaine versus food choice procedure. International Journal of Neuropsychopharmacology, 18, 1–10. - PMC - PubMed
    1. Bickel, W. K. , & Madden, G. J. (1999). A comparison of measures of relative reinforcing efficacy and behavioral economics: Cigarettes and money in smokers. Behavioural Pharmacology, 10, 627–637. - PubMed
    1. Carr, K. D. (2002). Augmentation of drug reward by chronic food restriction: Behavioral evidence and underlying mechanisms. Physiology & Behavior, 76, 353–364. - PubMed
    1. Carroll, M. E. , & Meisch R. A. (1984). Enhanced drug‐reinforced behavior due to food deprivation In Thompson T., Dews P. B., & Barrett J. E. (Eds.) Advances in behavioral pharmacology (Vol. 4, pp. 47–88). New York: Academic Press.
    1. Davison, M. , & McCarthy, D. (1988). The matching law: A research review. Hillsdale, NJ: Erlbaum.

LinkOut - more resources