. 2016 Jul 9:2016:baw105.
doi: 10.1093/database/baw105. Print 2016.

FANTOM5 transcriptome catalog of cellular states based on Semantic MediaWiki

Affiliations

FANTOM5 transcriptome catalog of cellular states based on Semantic MediaWiki

Imad Abugessaisa et al. Database (Oxford). .

Abstract

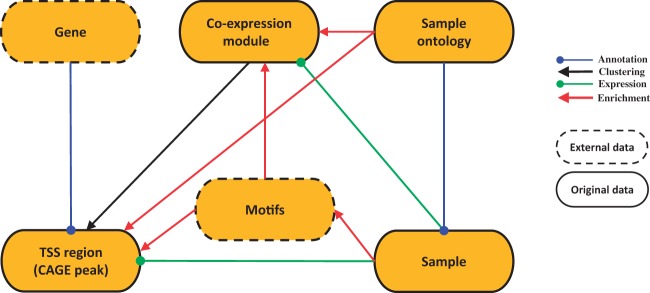
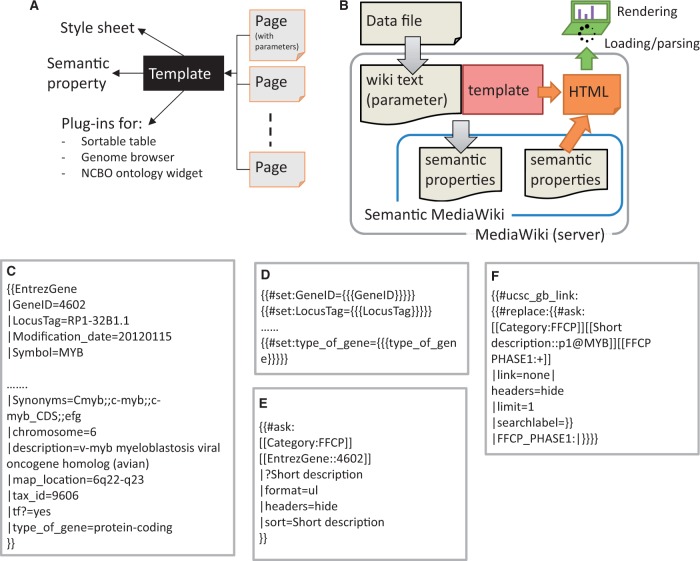
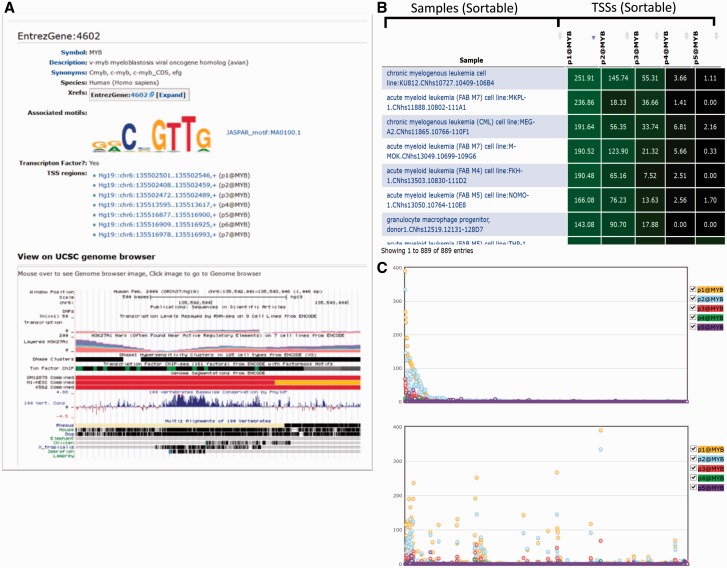
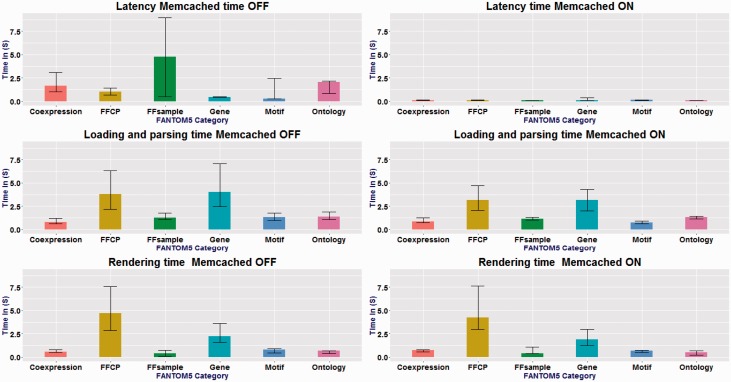
The Functional Annotation of the Mammalian Genome project (FANTOM5) mapped transcription start sites (TSSs) and measured their activities in a diverse range of biological samples. The FANTOM5 project generated a large data set; including detailed information about the profiled samples, the uncovered TSSs at high base-pair resolution on the genome, their transcriptional initiation activities, and further information of transcriptional regulation. Data sets to explore transcriptome in individual cellular states encoded in the mammalian genomes have been enriched by a series of additional analysis, based on the raw experimental data, along with the progress of the research activities. To make the heterogeneous data set accessible and useful for investigators, we developed a web-based database called Semantic catalog of Samples, Transcription initiation And Regulators (SSTAR). SSTAR utilizes the open source wiki software MediaWiki along with the Semantic MediaWiki (SMW) extension, which provides flexibility to model, store, and display a series of data sets produced during the course of the FANTOM5 project. Our use of SMW demonstrates the utility of the framework for dissemination of large-scale analysis results. SSTAR is a case study in handling biological data generated from a large-scale research project in terms of maintenance and growth alongside research activities.Database URL: http://fantom.gsc.riken.jp/5/sstar/.


Figures

Figure 1.
Figure 1.
SSTAR data model. SSTAR data model consists of six classes, those represents the main ‘categories’ in SMW. The oval represents a class and the kind of the data stored. Relationship between any two categories is represented as an arrow. The direction of the arrow indicates which of the two classes stores the relationship (indicated by the end of the arrow) as a class attribute. The head and color of the arrow indicates the type of relationship.
Figure 2.
Figure 2.
Implementation scheme of data model with SMW template. (A) Template dependencies. Each page in SSTAR use one or more template from SMW, the template points to different style sheets, calls semantic property and SSTAR plug-ins to deliver particular function. (B) Data flow from depositing the data file in MediaWiki server to render the page into the client. (C) Code snippet showing template call (EntrezGene) with the semantic properties to generate the page with EntrezGene:4602 http://fantom.gsc.riken.jp/5/sstar/EntrezGene:4602. (D) Statements in the ‘EntrezGene’ template to store template parameters as semantic properties. The statements will add the semantic properties ‘GeneID’, ‘LocusTag’ and ‘type_of_gene’. (E) An example of inline semantic query, retrieving the association between two categories (gene and CAGE peaks) and show the result in an unnumbered list. (F) An example of the inline semantic query modified to call SSTAR ucsc_gb_link function to provide the genomic view of the FFCP in UCSC genome browser.
Figure 3.
Figure 3.
Graphical representation of a gene (MYB). (A) Result of the search for MYB gene in SSTAR, with its associated Motifs and list of TSS regions. The user is able to get UCSC genome browser view of the MYB gene. (B) The table shows the expression of five TSS regions associated with MYB. (C) The graphical representation of the B) in which X-axis represents individual samples and y-axis represents expression intensities.
Figure 4.
Figure 4.
Measurements of page-timing. x-axis shows FANTOM5 categories and the y-axis is the different timing in seconds. Memcached ON and OFF, for the six categories: n = 87, n = 1003, n = 3011, n = 52, n = 16 and n = 10 . The box denotes the median. The bars on each column show the 25 and 75 percentiles. Latency time changed drastically between cache-on and cache-off. No change in the loading and parsing time and rendering time for all categories.

References

    1. Metzker M.L. (2010) Sequencing technologies - the next generation. Nat. Rev. Genet., 11, 31–46. - PubMed
    1. Kawamoto S., Yoshii J., Mizuno K. et al. (2000) BodyMap: a collection of 3' ESTs for analysis of human gene expression information. Genome Res., 10, 1817–1827. - PMC - PubMed
    1. Kawai J., Shinagawa A., Shibata K. et al. (2001) Functional annotation of a full-length mouse cDNA collection. Nature, 409, 685–690. - PubMed
    1. Okazaki Y., Furuno M., Kasukawa T. et al. (2002) Analysis of the mouse transcriptome based on functional annotation of 60,770 full-length cDNAs. Nature, 420, 563–573. - PubMed
    1. Su A.I., Wiltshire T., Batalov S. et al. (2004) A gene atlas of the mouse and human protein-encoding transcriptomes. Proc. Natl. Acad. Sci. U S A, 101, 6062–6067. - PMC - PubMed