. 2016 Aug 15;143(16):2994-3001.
doi: 10.1242/dev.139188. Epub 2016 Jul 11.

Shh and ZRS enhancer colocalisation is specific to the zone of polarising activity

Affiliations

Shh and ZRS enhancer colocalisation is specific to the zone of polarising activity

Iain Williamson et al. Development. .

Abstract

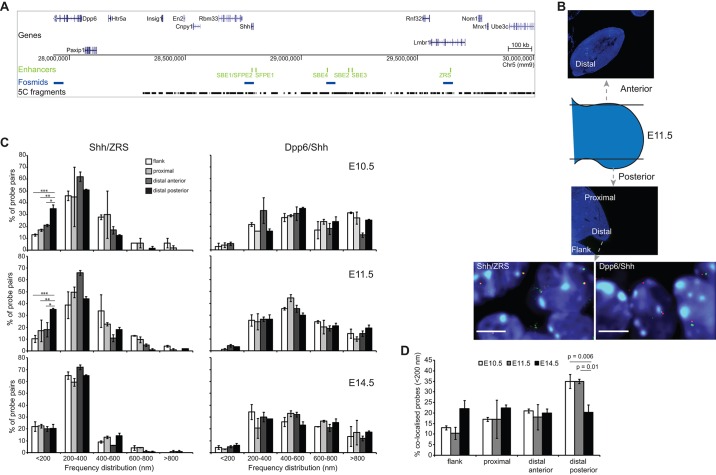
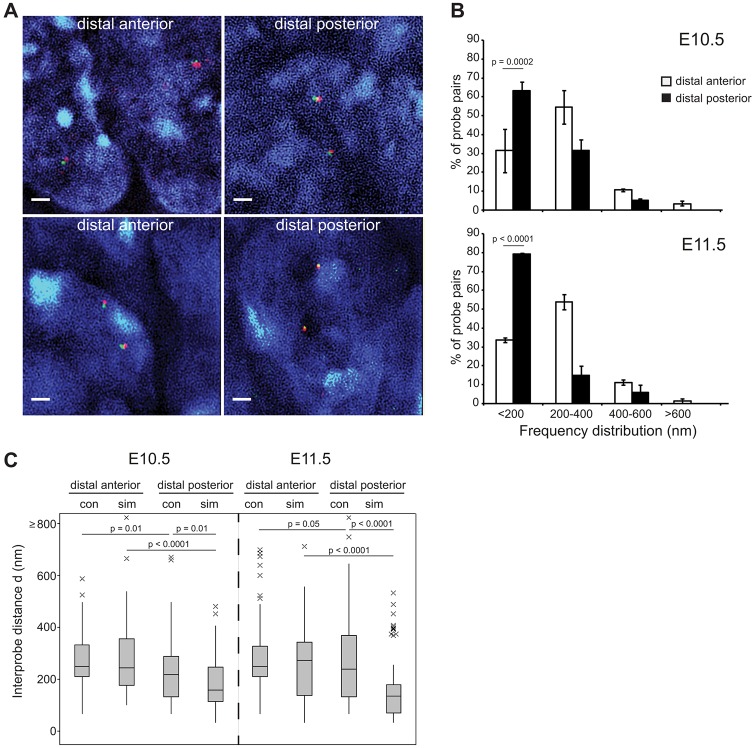
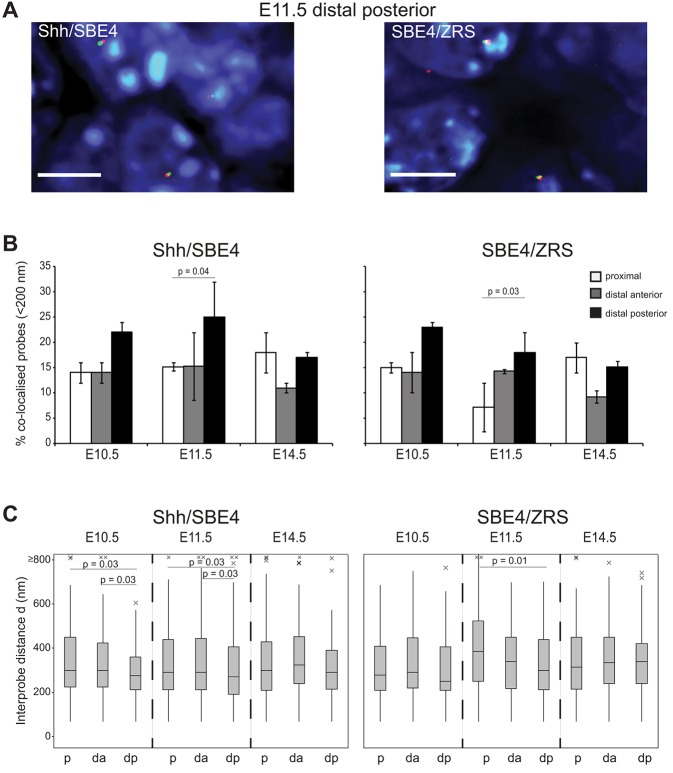
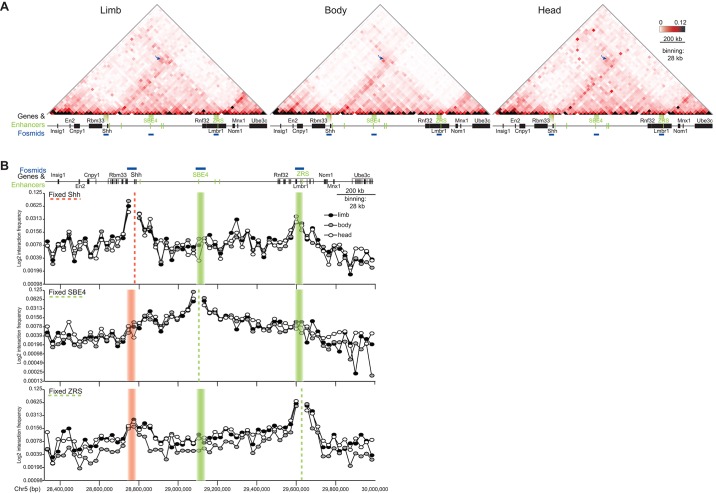
Limb-specific Shh expression is regulated by the (∼1 Mb distant) ZRS enhancer. In the mouse, limb bud-restricted spatiotemporal Shh expression occurs from ∼E10 to E11.5 at the distal posterior margin and is essential for correct autopod formation. Here, we have analysed the higher-order chromatin conformation of Shh in expressing and non-expressing tissues, both by fluorescence in situ hybridisation (FISH) and by chromosome conformation capture (5C). Conventional and super-resolution light microscopy identified significantly elevated frequencies of Shh/ZRS colocalisation only in the Shh-expressing regions of the limb bud, in a conformation consistent with enhancer-promoter loop formation. However, in all tissues and at all developmental stages analysed, Shh-ZRS spatial distances were still consistently shorter than those to a neural enhancer located between Shh and ZRS in the genome. 5C identified a topologically associating domain (TAD) over the Shh/ZRS genomic region and enriched interactions between Shh and ZRS throughout E11.5 embryos. Shh/ZRS colocalisation, therefore, correlates with the spatiotemporal domain of limb bud-specific Shh expression, but close Shh and ZRS proximity in the nucleus occurs regardless of whether the gene or enhancer is active. We suggest that this constrained chromatin configuration optimises the opportunity for the active enhancer to locate and instigate the expression of Shh.

Keywords: 5C; Chromosome loop; Enhancer; Limb development; Super-resolution microscopy.


Conflict of interest statement

The authors declare no competing or financial interests.

Figures

Fig. 1.
Fig. 1.
ZRS-Shh proximity in the ZPA at E10.5 and E11.5. (A) Location of genes over a 2 Mb murine genomic locus containing Shh, with the position of tissue-specific Shh enhancers shown below in green. The bottom two tracks show the locations to which the fosmid probes used for FISH hybridise (blue) and the 3C fragments amplified for 5C (black). (B) Schematic indicating the position and plane of the tissue sections taken through the anterior and posterior parts of the E11.5 forelimb bud. Distal and proximal parts of the posterior limb bud and the distal anterior limb bud are shown, as is the flank mesoderm. Below are images of nuclei from E11.5 ZPA tissue sections showing Shh/ZRS and Shh/Dpp6 probe pairs. Scale bars: 5μm. (C) Frequency distributions of FISH inter-probe distances (d) in 200 nm bins, between Shh and ZRS (left column), or Shh and Dpp6 probes (right column) in proximal and distal (anterior and posterior) regions of the murine forelimb bud and adjacent flank at E10.5, E11.5 and E14.5 (n=70-130 alleles). For E10.5 and E11.5 sections, distal posterior limb is the ZPA. Error bars represent s.e.m. obtained from two or three different tissue sections from one or two embryos. The statistical significance between data sets was examined by Fisher's exact tests: *P<0.05, **P<0.01, ***P<0.001. (D) Comparison of the proportion of colocalised Shh/ZRS probe pairs (<200 nm) across the three temporal developmental stages for distal anterior and posterior and proximal forelimb tissue and flank tissue. Error bars represent s.e.m. obtained from two or three different tissue sections. The statistical significance between data sets was examined by Fisher's exact tests.
Fig. 2.
Fig. 2.
Super-resolution imaging identifies the majority of Shh-ZRS probes as colocalised in ZPA tissue. (A) Nuclei captured by super-resolution SIM imaging from the distal forelimb of E10.5 (top row) and E11.5 (bottom row) embryos after FISH with Shh and ZRS probe pairs. Scale bars: 1 μm. (B) Frequency distributions of Shh-ZRS inter-probe distances (d) measured from SIM images in 200 nm bins, in distal anterior and distal posterior regions of the murine forelimb at E10.5 and E11.5. n=67-100 (alleles). Error bars represent s.e.m. obtained from two different tissue sections from one embryo. The statistical significance between data sets was examined by Fisher's exact tests. (C) Boxplots show the distribution of Shh-ZRS inter-probe distances (d in nm) in E10.5 and E11.5 distal anterior and distal posterior limb tissue captured by conventional (con) and structured illumination (sim) microscopy. Line, median; box, interquartile range; whiskers, 95% range. The statistical significance between data sets was examined by Mann–Whitney U tests.
Fig. 3.
Fig. 3.
The Shh-ZRS regulatory domain is maintained in a compact chromatin conformation in expressing and non-expressing tissue. (A) Images of representative nuclei from E11.5 ZPA tissue showing FISH signals for Shh/SBE4 and SBE4/ZRS probe pairs. Scale bars: 5 μm. (B) Comparison of the proportion of colocalised Shh/SBE4 and SBE4/ZRS probe pairs (<200 nm) across the three temporal developmental stages for proximal and distal anterior and posterior (ZPA in E10.5 and E11.5 sections) forelimb tissue (n=70-100 alleles). Error bars represent s.e.m. obtained from two or three different tissue sections from one or two embryos. The statistical significance between data sets was examined by Fisher's exact tests. (C) Boxplots showing the distribution of interprobe distances (d) in nanometres between Shh/SBE4 and SBE4/ZRS in E10.5, E11.5 and E14.5 proximal (p), distal anterior (da) and posterior (dp) forelimb. The statistical significance between data sets was examined by Mann–Whitney U tests.
Fig. 4.
Fig. 4.
5C-seq identifies enriched interactions between Shh and ZRS in E11.5 embryos. (A) Heat maps showing 5C data from cells of the limbs, bodies and heads of E11.5 embryos, across the 1.7-Mb Shh region shown in Fig. 1. Heat-map intensities represent the average of interaction frequency for each window, colour-coded according to the scale shown. Interaction frequencies were normalised based on the total number of sequence reads in the 5C data set and the data shown is binned over 28-kb windows. Arrows indicate interaction frequencies between windows containing Shh and ZRS. Data for biological replicates are in Fig. S3A and unprocessed normalised data are shown in Fig. S4. (B) Virtual 4C analysis obtained by extracting 5C interactions with viewpoints fixed at Shh, SBE4 and ZRS. Dashed lines indicate the position of the fixed viewpoint from the Shh genomic region (pink) or regulatory elements (green). Data from limbs are in black filled circles, bodies in grey filled circles and heads in unfilled circles. Genome coordinates on chromosome 5 (Chr5) are from the mm9 assembly of the mouse genome.

References

    1. Amano T., Sagai T., Tanabe H., Mizushina Y., Nakazawa H. and Shiroishi T. (2009). Chromosomal dynamics at the Shh locus: limb bud-specific differential regulation of competence and active transcription. Dev. Cell 16, 47-57. 10.1016/j.devcel.2008.11.011 - DOI - PubMed
    1. Anderson E., Devenney P. S., Hill R. E. and Lettice L. A. (2014). Mapping the Shh long-range regulatory domain. Development 141, 3934-3943. 10.1242/dev.108480 - DOI - PMC - PubMed
    1. Belmont A. (2014). Large-scale chromatin organization: the good, the surprising, and the still perplexing. Curr. Opin. Cell Biol. 26, 69-78. 10.1016/j.ceb.2013.10.002 - DOI - PMC - PubMed
    1. Benabdallah N. S. and Bickmore W. A. (2015). Regulatory domains and their mechanisms. Cold Spring Harb. Symp. Quant. Biol. 80, 45-51. 10.1101/sqb.2015.80.027268 - DOI - PubMed
    1. Berlivet S., Paquette D., Dumouchel A., Langlais D., Dostie J. and Kmita M. (2013). Clustering of tissue-specific sub-TADs accompanies the regulation of HoxA genes in developing limbs. PLoS Genet. 9, e1004018 10.1371/journal.pgen.1004018 - DOI - PMC - PubMed

Publication types