. 2016 Jul 26;113(30):E4367-76.
doi: 10.1073/pnas.1521083113. Epub 2016 Jul 11.

Disruptions of network connectivity predict impairment in multiple behavioral domains after stroke

Affiliations

Disruptions of network connectivity predict impairment in multiple behavioral domains after stroke

Joshua Sarfaty Siegel et al. Proc Natl Acad Sci U S A. .

Abstract

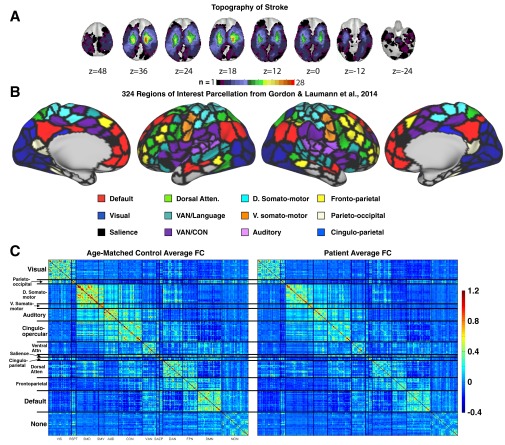
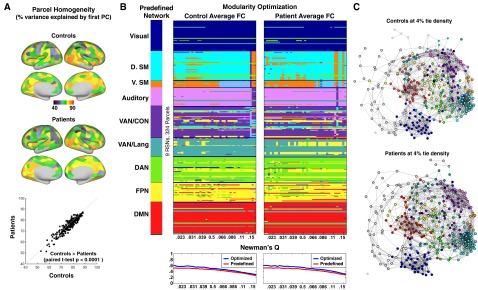
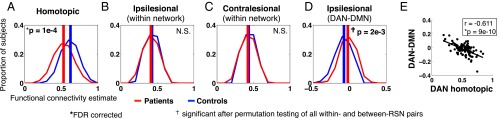
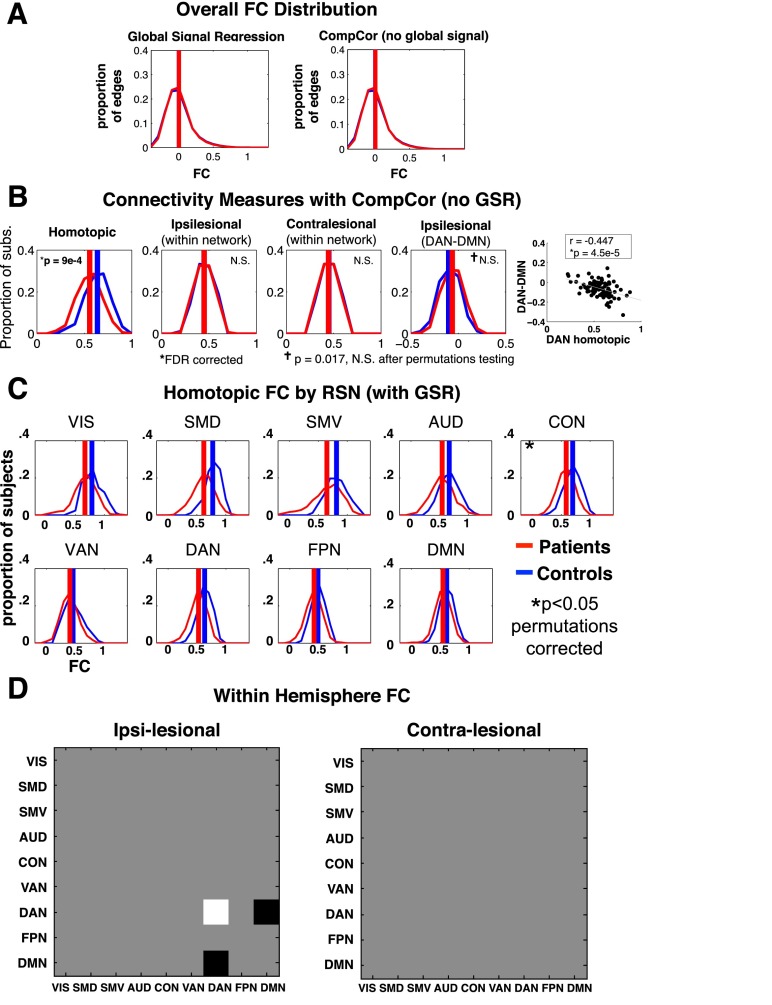
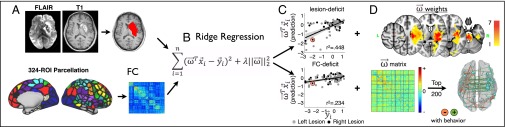
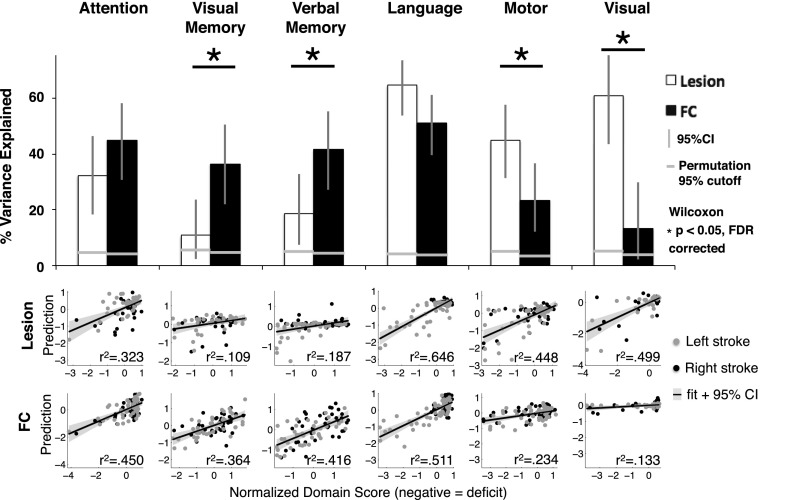
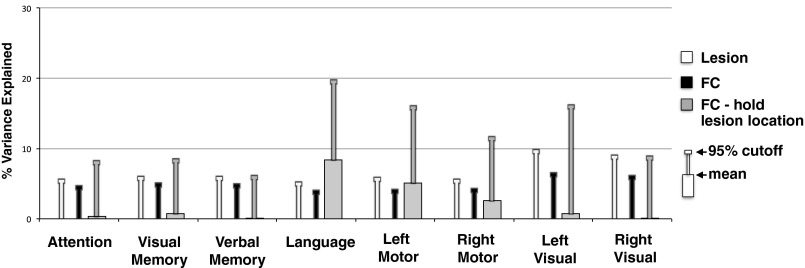
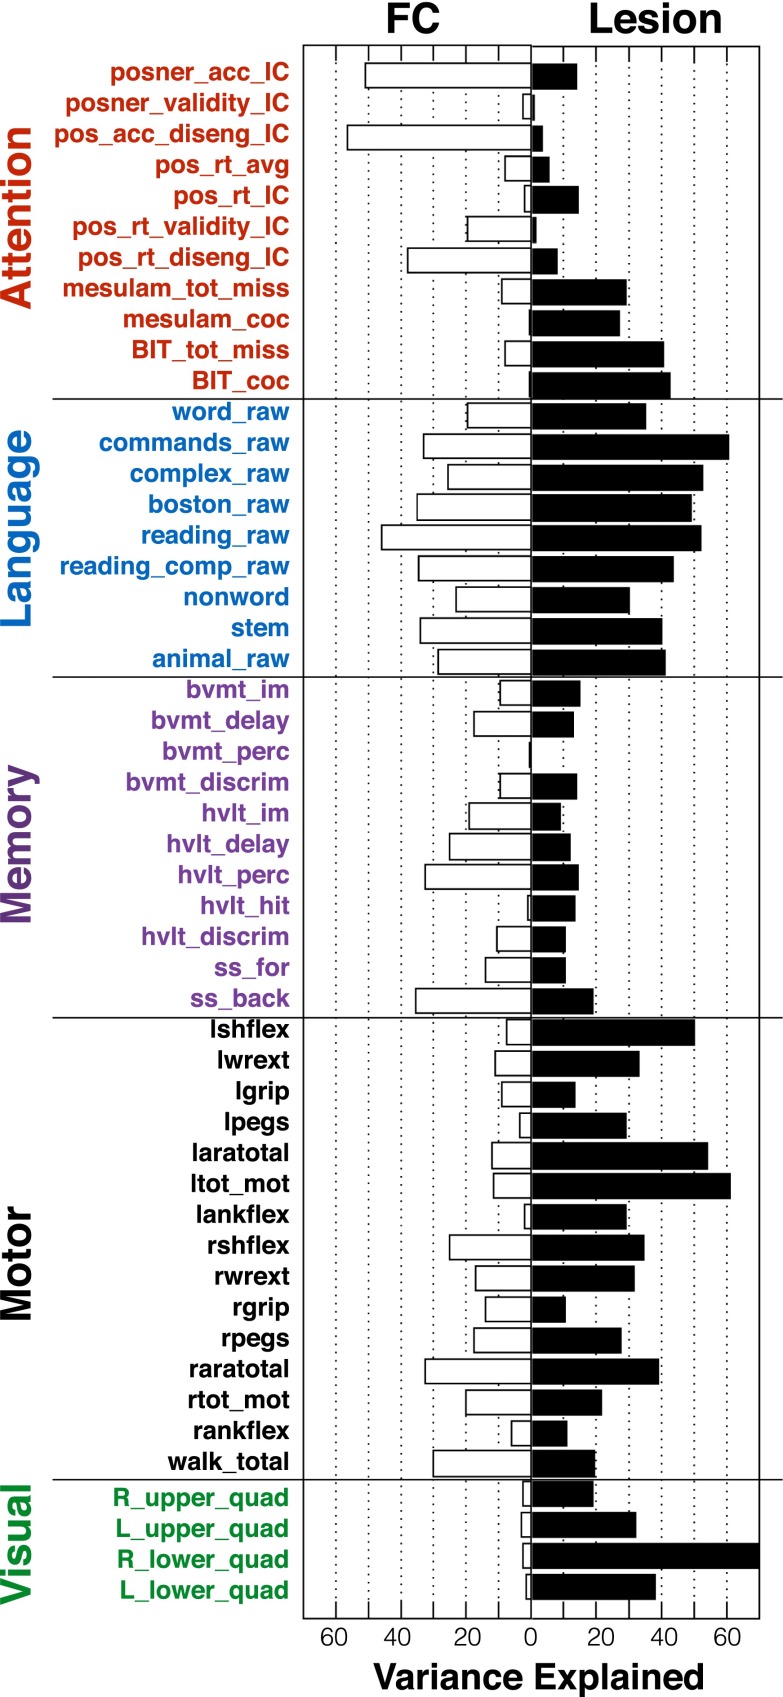
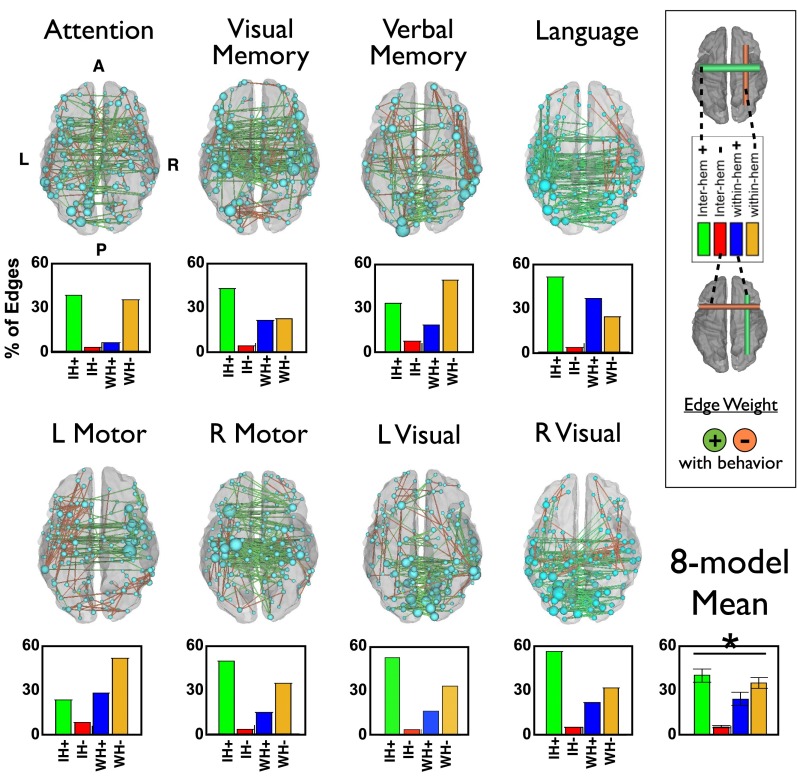
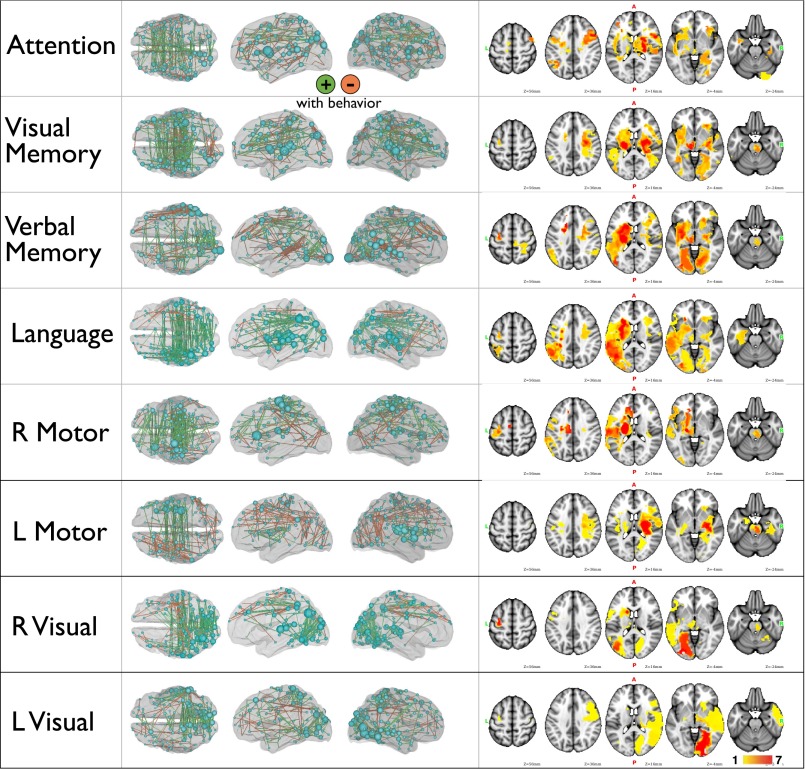
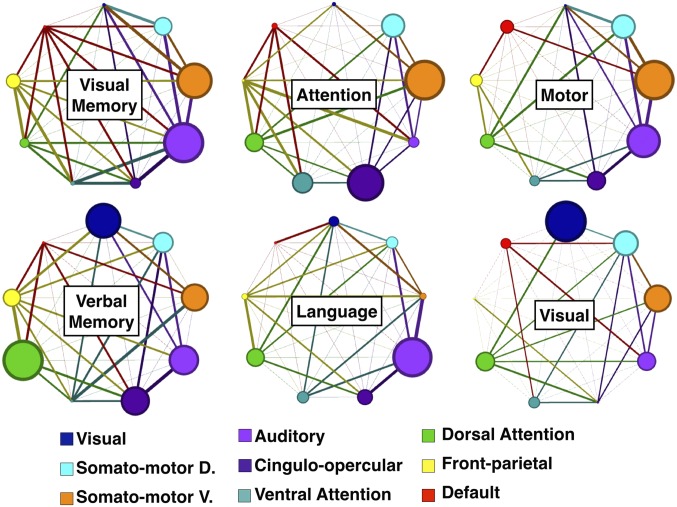
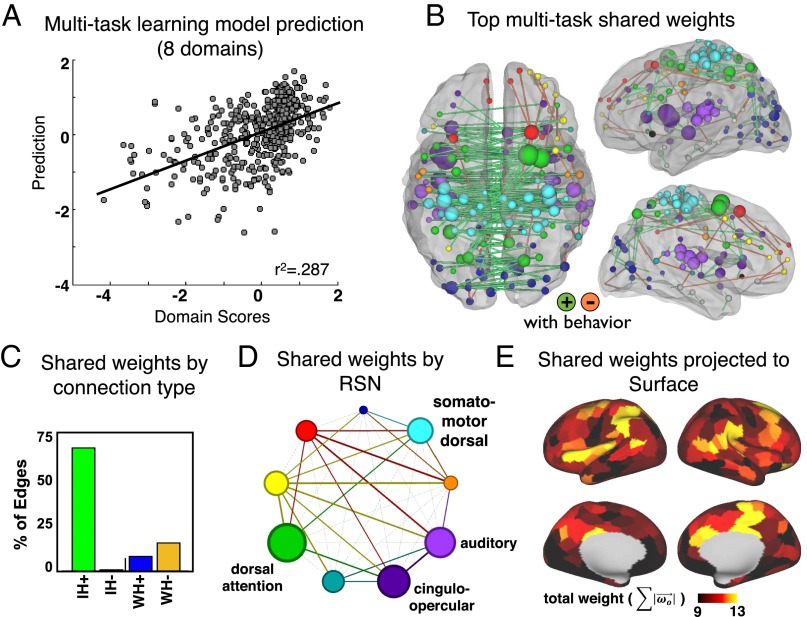
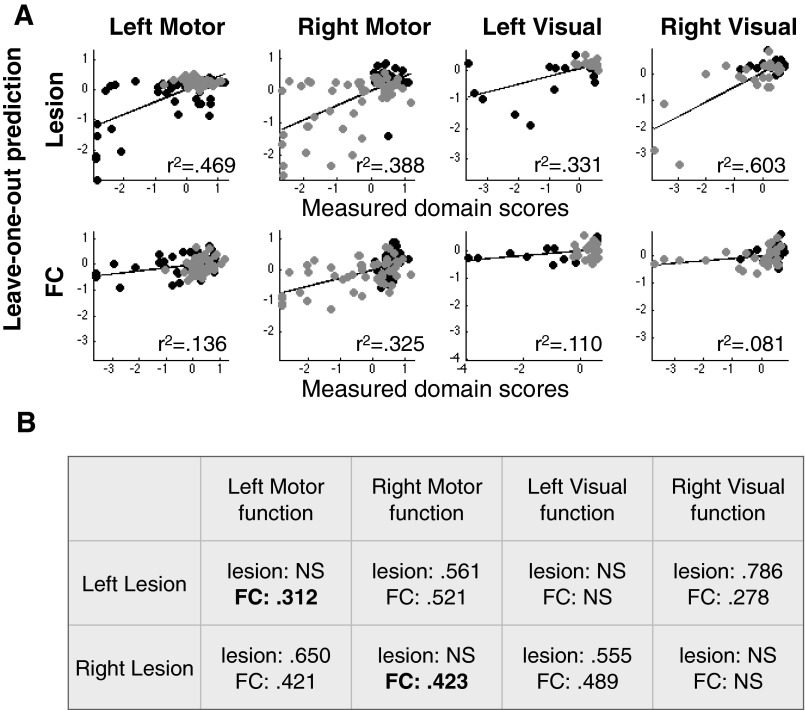
Deficits following stroke are classically attributed to focal damage, but recent evidence suggests a key role of distributed brain network disruption. We measured resting functional connectivity (FC), lesion topography, and behavior in multiple domains (attention, visual memory, verbal memory, language, motor, and visual) in a cohort of 132 stroke patients, and used machine-learning models to predict neurological impairment in individual subjects. We found that visual memory and verbal memory were better predicted by FC, whereas visual and motor impairments were better predicted by lesion topography. Attention and language deficits were well predicted by both. Next, we identified a general pattern of physiological network dysfunction consisting of decrease of interhemispheric integration and intrahemispheric segregation, which strongly related to behavioral impairment in multiple domains. Network-specific patterns of dysfunction predicted specific behavioral deficits, and loss of interhemispheric communication across a set of regions was associated with impairment across multiple behavioral domains. These results link key organizational features of brain networks to brain-behavior relationships in stroke.

Keywords: functional connectivity; interhemispheric; language; memory; stroke.


Conflict of interest statement

The authors declare no conflict of interest.

Figures

Fig. S1.
Fig. S1.
Lesion and FC visualization. (A) Topography of stroke. Lesion overlay map in atlas space for 132 stroke patients. Lesion distribution is representative of a larger source population. (B) The 324 region on interest parcellation from Gordon et al. (25). Regions are color coded by RSN membership. (C) Average Fisher z-transformed FC matrices are shown for age-matched controls (n = 27) and stroke patients (n = 100) excluding regions that overlap lesions.
Fig. S2.
Fig. S2.
Parcel homogeneity and community (RSN) modularity of the Gordon et al. (25) parcellation in controls and stroke patients. (A) Homogeneity of each parcel, calculated as the percent of the variance in functional connectivity patterns explained by the parcel’s first PCA eigenvariate. Regional variability is highly consistent between patients and controls. (Lower) Homogeneity is compared between controls and patients for every parcel. Patients show a small but consistent reduction in parcel homogeneity (control: mean = 0.70.8, SD = 8.3; pat: mean = 69.4, SD = 8.3; paired t test: t-stat = 8.0, P < 0.0001). (B) The leftmost column provides predefined community assignment based on Gordon et al. Here, as in later RSN-based analyses, RSNs with fewer than seven regions are excluded. Modularity optimization was initialized with predefined community labels and run at a range of tie densities (0.02:0.15) in controls and patients. Below each visualization of modularity optimization is a plot of Newman’s Q at every tie density for predefined community assignments (red) and optimized community assignments (blue). Optimal assignments show marginally greater modularity for the nine major RSNs. (C) Spring embedded graphs at 4% tie density. Areas are color coded based on predefined community assignment.
Fig. 1.
Fig. 1.
Stroke preferentially affects homotopic connections. Red curves represent the distribution of within-RSN FC estimates over stroke patients (n = 100); blue curves represent the distribution of within-RSN FC over controls (n = 27). (A) FC between homotopic region pairs (the same location on opposite hemispheres) is averaged for each subject (pat: mean = 0.53, SD = 0.11; control: mean = 0.63, SD = 0.090; two-tailed t test: P = 4.0 × 10⁻⁵). (B) FC between all within-network ipsilesional region pairs is averaged for each subject. Intrahemispheric connections on a randomly chosen hemisphere are averaged in controls. (pat: mean = 0.41, SD = 0.064; control: mean = 0.43, SD = 0.046; two-tailed t test: P = 0.26). (C) FC between all within-network contralesional region pairs is averaged for each subject (pat: mean = 0.42, SD = 0.058; control: mean = 0.44, SD = 0.036; two-tailed t test: P = 0.32). P values for A–C are based on two-tailed t test of overall within-network FC are corrected for three comparisons. (D) FC between all DAN-DMN between-network ipsilesional region pairs is averaged for each subject. (pat: mean = −0.024, SD = 0.077; control: mean = −0.078, SD = 0.075; two-tailed t test: P = 0.0021). DAN-DMN was the only network pair that showed a significant ipsilesional connectivity difference after multiple comparison correction with permutations (Fig. S3D). (E) Ipsilesional DAN-DMN FC is compared with homotopic FC between DAN nodes to show that within-hemisphere segregation of task positive and task negative RSNs relates to across-hemisphere integration. P value is FDR corrected for eight comparisons.
Fig. S3.
Fig. S3.
Stroke preferentially affects homotopic connections. Functional connectivity changes are investigated without global signal regression, and within and between all RSN pairs. (A) Red curves represent the distribution of FC estimates for all 324-choose-2 edges averaged over all patients (n = 100); blue curves represent FC over all controls (n = 27). (B) Group FC comparisons using the same statistical analysis and multiple comparison correction as Fig. 1 A–E, but with CompCor functional connectivity processing (SI Experimental Procedures). (C) Homotopic FC distributions for patients and controls are shown for each RSN with at least 8 parcels (9 out of 13 RSNs). (D) Intranetwork and internetwork FC differences were assessed within hemisphere. Black squares indicate patients > controls; white indicate patients < controls. C and D are jointly corrected for multiple comparisons using 10,000 permutations of group labels and 99 stroke-control t tests (45 ipsilesional, 45 contralesional, and 9 homotopic). VIS (38 ROIs), SMD (37 ROIs); SMV (8 ROIs); auditory network (AUD) (23 ROIs); CON (39 ROIs); VAN (23 ROIs); DAN (32 ROIs); frontoparietal control network (FPN) (24 ROIs); DMN (40 ROIs).
Fig. S4.
Fig. S4.
Group and individual homotopic FC differences are not explained by head motion, eyes open, or hemodynamic lag. (Left) Root mean square framewise displacement (FD) was not significantly different in patients (red dots) compared with controls (blue dots) and shows no significant correlation with homotopic FC in the stroke patients. (Middle) Percent of frames with eyes open was not significantly different in patients than controls and shows no significant relationship to homotopic FC in the stroke patients. (Right) After excluding 15 subjects with excessive hemodynamic lags, lag laterality was still significantly different in patients than controls (Wilcoxon rank sum test; P = 0.0021), however lag laterality showed no significant relationship with homotopic FC in the stroke patients.
Fig. 2.
Fig. 2.
Prediction of behavioral deficits on the basis of structural and functional imaging. (A) Experimental procedures for manual lesion segmentation (Upper), and for region of interest (ROI)-based functional connectivity estimation. (B) Ridge regression was applied using either lesion or functional connectivity to predict deficit for a left-out patient. A ridge regression function using lesion/FC to explain deficit is trained for n − 1 subjects. For each patient, this function generates a prediction of deficit in each domain based on data, and a beta weight matrix that can be projected back on to the brain. (C) Predicted deficit scores were compared with measured scores for each patient to determine model accuracy. (D) Beta weights used to predict left motor deficit with either the lesion (Upper) or the FC matrix (Lower) are projected back on to the brain.
Fig. 3.
Fig. 3.
Lesion-deficit and FC-deficit model accuracies vary by domain. The bar graph shows percent of variance explained across the six behavioral domains. White bars are lesion-deficit models, black bars are FC-deficit models. Lesion location predicts deficit significantly better in motor and visual domains. FC predicts deficit significantly better in the visual memory, and verbal memory domains. Statistical comparison between lesion-deficit and FC-deficit models (indicated by asterisks) were performed using a Wilcoxon signed rank test of prediction error and were FDR corrected. Horizontal gray lines represent P = 0.05 cutoffs for the null model generated by permuting domain scores 10,000 times for each domain. All models perform significantly better than chance. The scatter plots show the comparison between predicted and measured scores from lesion-deficit models (Upper) and FC-deficit models (Lower). Behavior scores are a composite of multiple tests in each domain and are on a z-normalized (mean = 0, SD = 1) scale. Motor and visual deficits were predicted separately for each hemisphere and the contralateral side, but combined for visualization.
Fig. S5.
Fig. S5.
Permutation testing. Average variance explained and 95% cutoff from 10,000 permutations of each prediction model: lesion-deficit models (white), FC-deficit models (black), and FC-deficit models with lesion location retained (gray). Lesion-deficit and FC-deficit models were generated by randomly permuting behavioral scores. The FC–hold lesion location models was generated by holding values within lesioned connections to zero, and then selecting all other FC values at random from the distribution of values for patients with no lesion. Note that with lesion information included, language and motor FC-deficit null models show substantial mean prediction, suggesting that FC models in these domains are picking up implicit structural information. Domains predicted by FC better than lesion (memory, attention) show very little influence.
Fig. S6.
Fig. S6.
FC- and lesion-based prediction of individual performance measures. To assess whether conclusions based on domain scores generalized to individual performance measures, we generated FC- and lesion-deficit prediction models for each measure. For some measures, the FC prediction was far worse than the domain score (e.g., bvmt_perc—brief visuospatial memory test percent correct). However, for measures that showed good prediction accuracy, the domain differences observed in the domain scores (e.g., that memory is better explained by FC and motor is better explained by lesion) appears to generalize to the raw scores. Full names of performance measures can be found in Table S1.
Fig. 4.
Fig. 4.
Most predictive connections and nodes for each FC-deficit model. (Left) The top 200 connections driving each FC-behavior model are projected back on to a semitransparent cerebrum (PALS atlas). Green connections indicate positive weights (increased FC predicts better performance), and orange connections indicate negative weights (increased FC predicts worse performance). The subset of the 324 parcels included in the top 200 weights are displayed as spheres, sized according to their contribution to the model. (Lower) Weights from each FC-behavior model are divided into four groups: interhemispheric positive, interhemispheric negative, intrahemispheric positive, and intrahemispheric negative. Bars indicate the average contribution of each of the four groups. The average across models is shown at the bottom right. An ANOVA indicates a significant difference in contribution of the four connection types (P = 1.6 × 10⁻⁶).
Fig. S7.
Fig. S7.
FC-deficit and lesion-deficit maps. (Left) The top 200 connections driving each FC-behavior model are projected back onto a semitransparent cerebrum (PALS atlas). Green connections indicate positive weights (increased FC predicts better performance); orange connections indicate negative weights (increased FC predicts worse performance). Also displayed are the 324 nodes, sized according to their contribution to the model. (Right) Lesion-deficit model weights projected on to a Montreal Neurological Institute brain atlas. Weights are normalized to have a mean of 0 and SD of 1.
Fig. 5.
Fig. 5.
Network view of FC-deficit domain models. Positive weights are divided up by RSN to determine network influence. RSNs with at least 8 parcels are included (9 out of 13 RSNs). Node sizes are proportional to the contribution of within-network connections. Edge thicknesses are proportional to the weighting of between-network connections. Grayed edges [e.g., DMN-visual network (VIS) in the attention model] indicate no between-network weights. Network diagrams are generated using Gephi (68).
Fig. 6.
Fig. 6.
Multitask learning shared weights. (A) The MTL model explains 28.7% variance across all domains. (B) The top 200 weights for the MTL shared features are visualized in the brain. (C) Weights are divided into four groups: interhemispheric positive, interhemispheric negative, intrahemispheric positive, and intrahemispheric negative. (D) Weights visualized by RSN. Node sizes are proportional to the average contribution of all within-network connections. Edge thicknesses are proportional to the average weighting of all between-network connections. (E) Shared weights are projected to the 324 surface parcels.
Fig. S8.
Fig. S8.
Motor and visual pattern deviation results separated by lesioned hemisphere. (A) Motor and visual function were predicted separately for the left and right hemisphere lesion and then combined to determine prediction accuracy. (B) Prediction accuracy is calculated separately for right lesion and left lesion patients. Note that left motor deficit is predicted for the ipsilesional hand, the FC-deficit significantly predicts ipsilesional function for both the left and right, but lesion-deficit model does not.

References

    1. Carrera E, Tononi G. Diaschisis: Past, present, future. Brain. 2014;137(Pt 9):2408–2422. - PubMed
    1. von Monakow C. 1914. Die Lokalisation im Grosshirn: und der Abbau der Funktion durch kortikale Herde [Localization in the Cerebrum and the Degeneration of Functions Through Conical Sources] (Bergmann, Wiesbaden, Germany). German.
    1. Alstott J, Breakspear M, Hagmann P, Cammoun L, Sporns O. Modeling the impact of lesions in the human brain. PLOS Comput Biol. 2009;5(6):e1000408. - PMC - PubMed
    1. Corbetta M. Functional connectivity and neurological recovery. Dev Psychobiol. 2012;54(3):239–253. - PubMed
    1. Fornito A, Zalesky A, Breakspear M. The connectomics of brain disorders. Nat Rev Neurosci. 2015;16(3):159–172. - PubMed

Publication types

MeSH terms

LinkOut - more resources