. 2016 Jul 26;113(30):E4276-85.
doi: 10.1073/pnas.1600537113. Epub 2016 Jul 8.

Pathological ribonuclease H1 causes R-loop depletion and aberrant DNA segregation in mitochondria

Affiliations

Pathological ribonuclease H1 causes R-loop depletion and aberrant DNA segregation in mitochondria

Gokhan Akman et al. Proc Natl Acad Sci U S A. .

Abstract

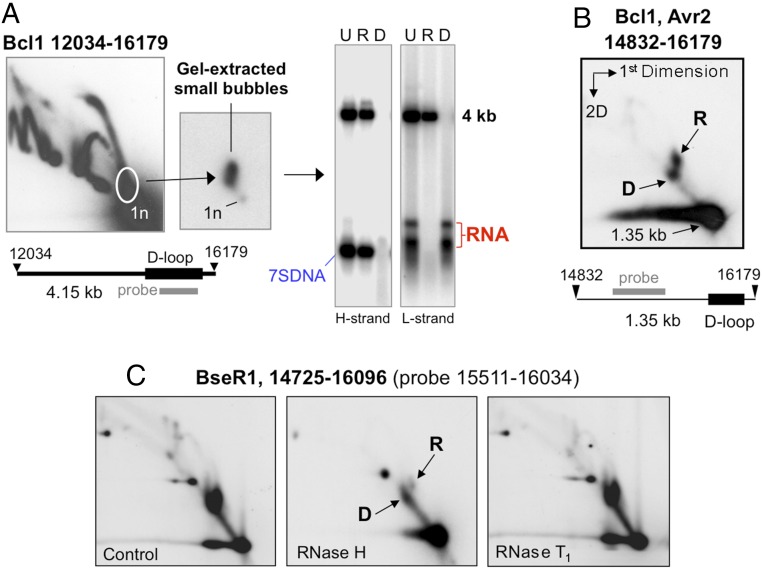
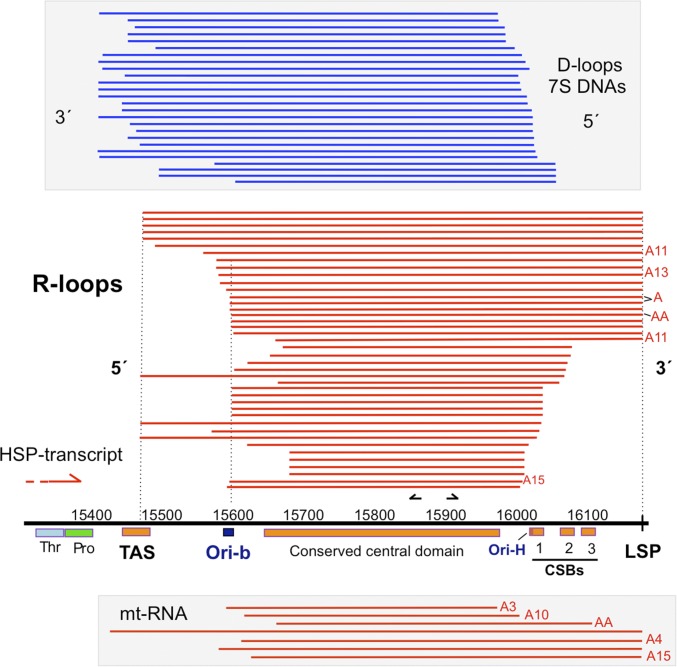
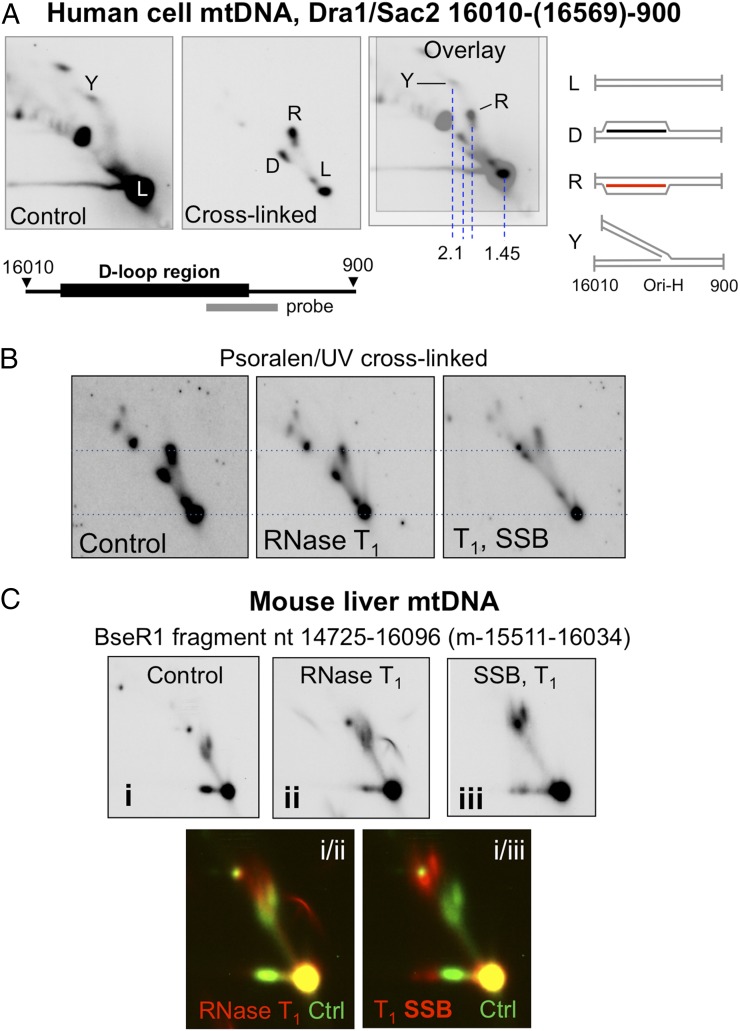
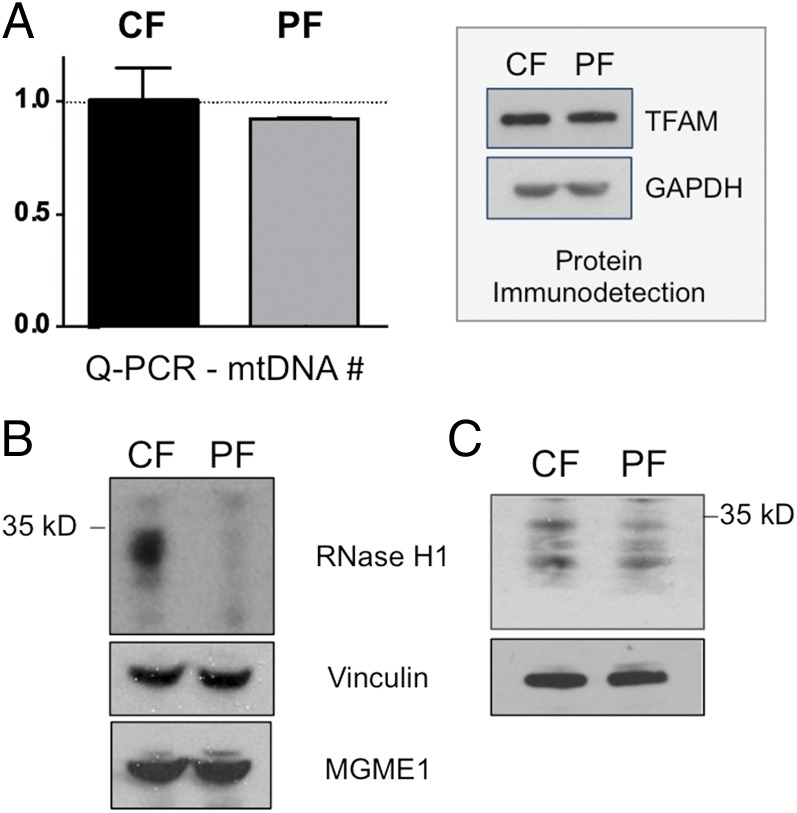
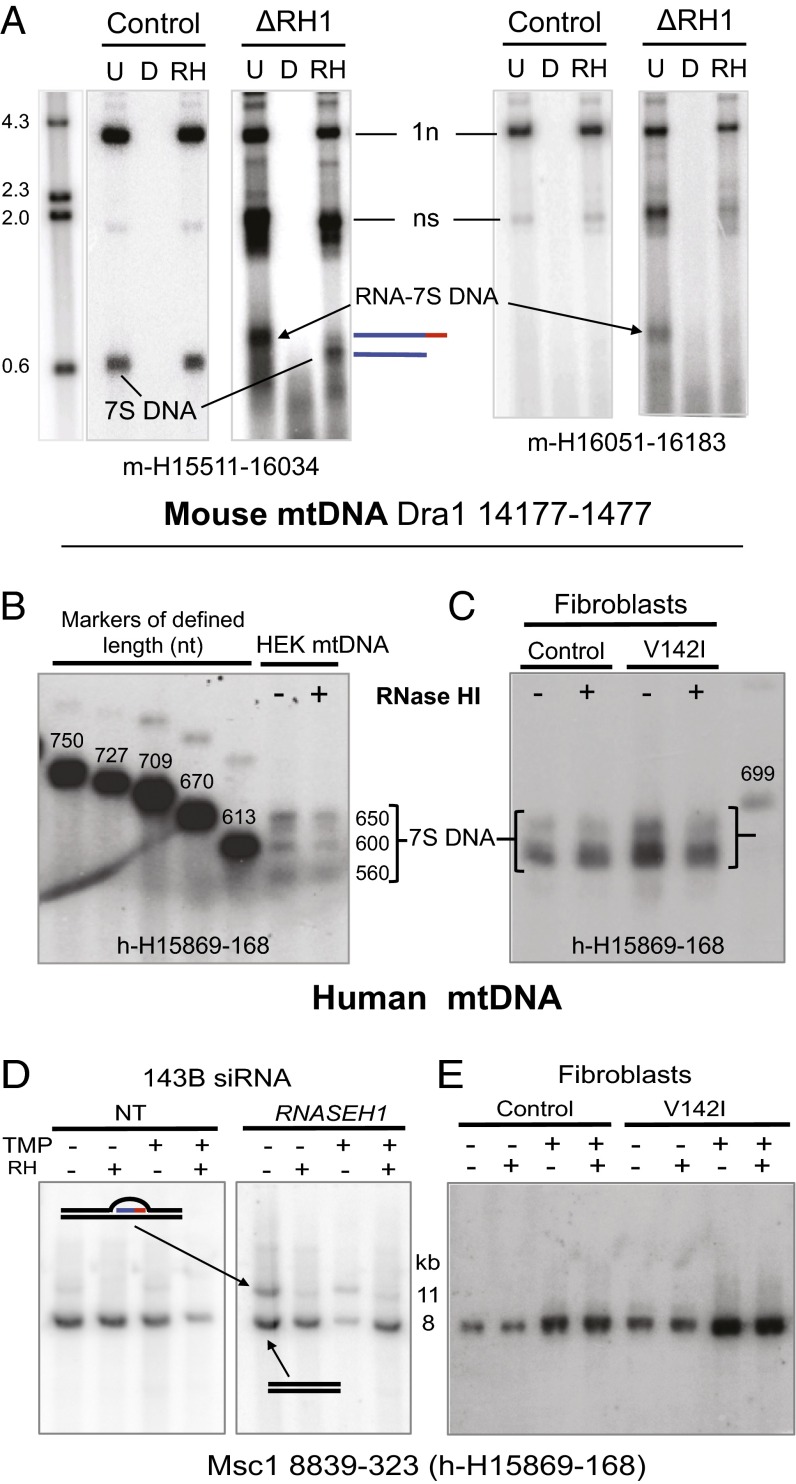
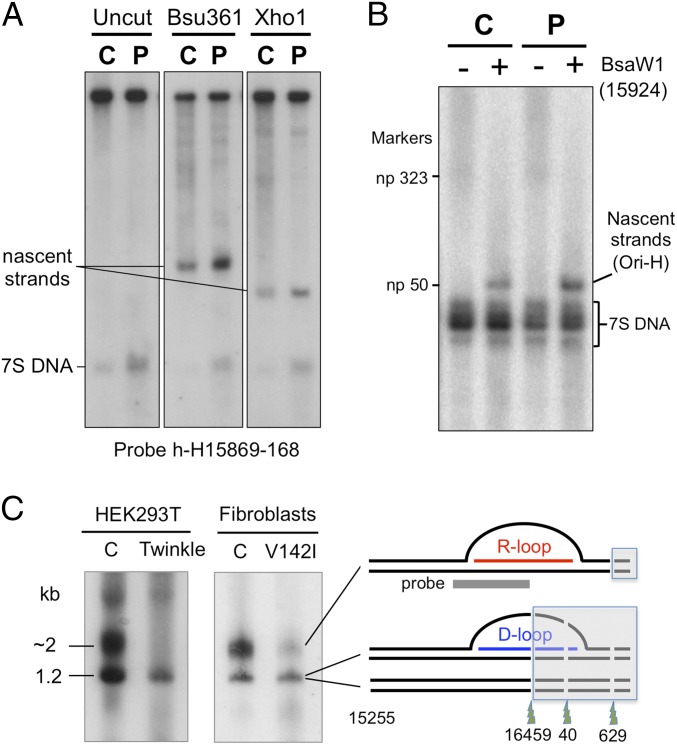
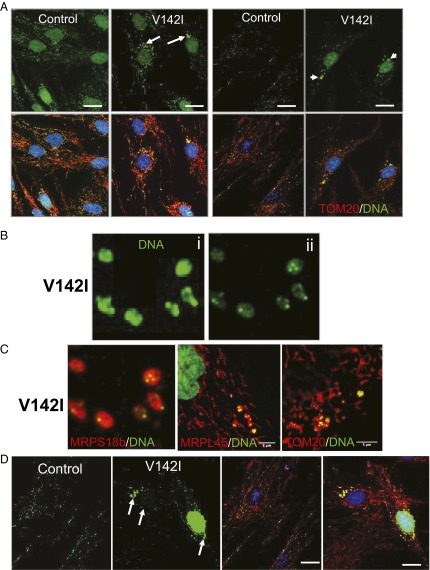
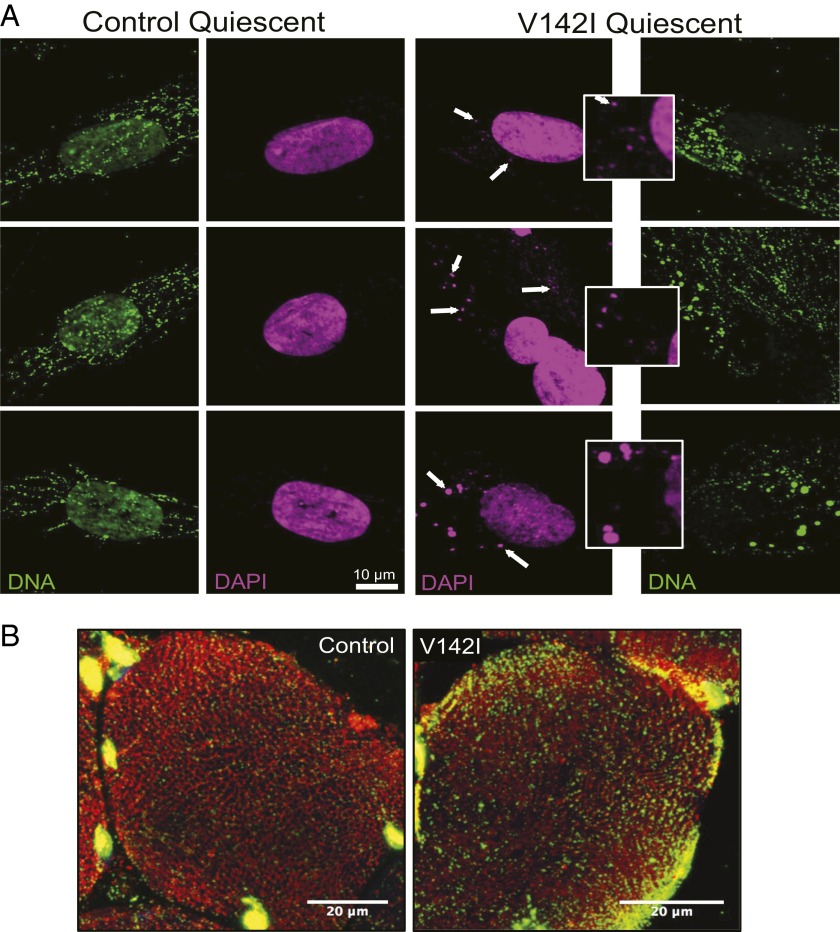
The genetic information in mammalian mitochondrial DNA is densely packed; there are no introns and only one sizeable noncoding, or control, region containing key cis-elements for its replication and expression. Many molecules of mitochondrial DNA bear a third strand of DNA, known as "7S DNA," which forms a displacement (D-) loop in the control region. Here we show that many other molecules contain RNA as a third strand. The RNA of these R-loops maps to the control region of the mitochondrial DNA and is complementary to 7S DNA. Ribonuclease H1 is essential for mitochondrial DNA replication; it degrades RNA hybridized to DNA, so the R-loop is a potential substrate. In cells with a pathological variant of ribonuclease H1 associated with mitochondrial disease, R-loops are of low abundance, and there is mitochondrial DNA aggregation. These findings implicate ribonuclease H1 and RNA in the physical segregation of mitochondrial DNA, perturbation of which represents a previously unidentified disease mechanism.

Keywords: DNA segregation; R-loop; RNase H1; mitochondrial DNA; mitochondrial disease.


Conflict of interest statement

The authors declare no conflict of interest.

Figures

Fig. 1.
Fig. 1.
Many molecules of murine mtDNA contain a mitochondrial R-loop complementary to the 7S DNA of the mitochondrial D-loop. (A) Purified mouse mtDNA (SI Appendix, Fig. S2) was digested with Bcl1 and fractionated by 2D-AGE before gel extraction of the material close to the base of the initiation arc (circled on a representative blot, hybridized to probe np 15,551–16,034). Repeated 2D-AGE of the gel-extracted nucleic acids confirmed that the majority were more massive than the linear restriction fragment, and heat denaturation and repeated 1D-AGE of samples, untreated (U), treated with RNase HI (R), or DNase (D) as previously (18), revealed an L-strand RNA complementary to 7S DNA. (B) A double digestion of mouse mtDNA to create a smaller CR-containing fragment reveals two discrete species, D and R, well separated from the linear 1.35-kb fragment. (C) 2D-AGE of BseR1-digested mouse mtDNA and enzyme treatments indicate species R is more sensitive to Eco-RNase HI than species D, although both are largely resistant to RNase T1.
Fig. 2.
Fig. 2.
Mapping of the mouse mitochondrial R-loop. RNAs recovered from Bcl1-digested mouse liver mtDNA fractionated by 2D-AGE (Fig. 1A and main text) or from undigested purified mouse liver mtDNA were DNase-treated, circularized, converted to DNA by RT-PCR, cloned, and sequenced. The lengths of the R-loops (red lines) are inferred from the junctions (SI Appendix, Table S1) and are aligned to the CR of murine mtDNA. Circularized RT-PCR applied to purified mouse mitochondrial RNA (mt-RNA) yielded a small number of clones (red lines at the bottom of the figure). Circularized PCR, cloning, and sequencing were used to map the ends of gel-extracted 7S DNAs (blue lines). Short black arrows mark the approximate position of the primers used for RT-PCR. A, adenine residues added posttranscriptionally to the 3′ end of the RNAs; CSB, conserved sequence block; LSP, light strand promoter; Ori-b and Ori-H, origins of replication; Pro, tRNA proline gene; TAS, termination-associated sequence; Thr, tRNA threonine gene.
Fig. 3.
Fig. 3.
Interstrand nucleic acid cross-linking stabilizes mitochondrial D-loops and R-loops in cultured human cells, and both are mobility shifted by SSB. (A) Human 143B osteosarcoma cells were psoralen/UV cross-linked or left untreated (control), and the isolated DNA was digested with Sac2 and Dra1 before 2D-AGE and blot hybridization to a probe spanning np 16,341–151 that detects the D-loop region (np 16,107–191). An overlay shows the mobility of species D and R relative to a recognized species on the replication fork arc (Y). Vertical dashed blue lines indicate the mobility of various species in the first-dimension electrophoresis step that is indicative of their mass. Interpretations of the structures of the nucleic acids appear to the right of the gel images: L or 1n, linear duplex mtDNA fragment; Y, replication fork; D-loop, 1n + 7S DNA; R-loop, 1n + LC-RNA (see text for details). The slower mobility of the R-loop in the second dimension compared with the D-loop might reflect a general feature that distinguishes the two types of triple-stranded molecule (i.e., the different properties of molecules with a third strand of RNA as opposed to DNA), or it might indicate a more complex arrangement of LC-RNA that includes segments of RNA–RNA pairing as well as RNA/DNA hybrid. (B and C) Species D and R of human (B) and mouse (C) mtDNA are mobility shifted by incubation with SSB. RNase T1 was applied before SSB incubation to remove any RNA tails that might have accentuated the mobility shift. The probe for mouse mtDNA spanned np 15,511–16,034. Merged false-color images [green (C, i) merged with red (C, ii or C, iii)] at the foot of the panel C provide a direct comparison of the effect of SSB on the mobility of D- and R-loops.
Fig. 4.
Fig. 4.
V142I RNase H1 protein is unstable, but the mutant protein does not appreciably alter mtDNA copy number. (A) Quantitative PCR to a fragment of a nuclear and a mitochondrial gene (SI Appendix) was used to determine the relative abundance of mtDNA in patient-derived (PF) V142I RNase H1 fibroblasts (V142I) compared with three control human fibroblast lines (CF); data are shown as the mean ± SEM from three independent experiments. (Inset) A representative immunoblot for TFAM and the reference protein GAPDH. (B and C) Immunoblots of proteins from control and patient-derived fibroblasts stored frozen (B) or freshly prepared (C): RNase H1, MGME1 [a mitochondrial endonuclease (Atlas Antibodies)], and vinculin (a reference protein). Proteins were fractionated by 4–12% (wt/vol) SDS/PAGE.
Fig. 5.
Fig. 5.
7S DNA molecules are persistently attached to their primer RNA in murine cells lacking RNase H1, but there is no evidence of primer retention in human cells with V142I RNase H1. (A) MEF mtDNA from cells treated for 8 d without (control) or with 4HT to excise the Rnaseh1 gene (ΔRH1) was digested with Dra1 and left untreated (U) or treated with DNase (D) or Eco-RNase HI (RH); denatured in 80% formamide, 15 min at 85 °C; and separated by 1D-AGE (1% Tris-borate). The λ-Hind3 DNA ladder was run in parallel to provide size markers. Southern hybridization with a riboprobe to the 5′ end of the H-strand (H15,511–16,034) detected the full-length H-strand of 3.6 kb (1n) and nascent strands (ns) (described in detail in ref. 15) and 7S DNA. 7S DNA without a primer is not detected by m-H16,051–16,183 but is detected by m-H15,511–16,034 (albeit only in ΔRH1 samples). Line drawings appear to the right of the gel image to denote 7S DNA with and without an RNA primer; red line, RNA; blue lines, DNA. (B) 7S DNAs of the human mitochondrial D-loop range from ∼560–650 nt in HEK cells and lack a RNA primer in human cells with wild-type (control) or mutant (V142I) RNase H1. (C) Sucrose gradient-purified mtDNAs of HEK cells and fibroblasts were separated by 1D-AGE [2% agarose, sodium borate (46)] after treatment with (+) or without (−) Eco-RNase HI and denaturation in 80% formamide, 15 min at 85 °C and were hybridized with a riboprobe complementary to nt 15,869–168 of human H-strand mtDNA. The mtDNA was run in parallel with a series of markers of defined length (SI Appendix). (D and E) DNA was extracted from whole 143B cells after 6 d of siRNA [nontargeting (NT) or targeting RNASEH1] (D) and from control or patient-derived (V1421) fibroblasts (E). DNA was digested with Msc1, fractionated by 1D-AGE (1% Tris-acetate-EDTA), and blot hybridized to the indicated probe. Cells were subjected to UV/psoralen cross-linking before isolation of nucleic acid and Msc1 and RNase HI (RH) digestion, as indicated. The compositions of the 8- and 11-kb species are interpreted in the line drawings. The 11-kb band has a blocked site at np 323 resulting from the R-loop. Red lines indicate RNA, and black lines indicate DNA.
Fig. 6.
Fig. 6.
V142I RNase H1 has opposite effects on the abundance of mitochondrial D-loops and R-loops. (A) Whole-cell DNA from control (C) and V142I RNase H1 (P) fibroblasts was denatured in 80% (vol/vol) formamide for 15 min at 85 °C and fractionated by 1D-AGE. Where indicated, samples were digested with Bsu361 or Xho1. After blot transfer, nascent H-strands and 7S DNA were detected by hybridization to probe h-H15,869–168. (B) Equivalent DNA samples were denatured after digestion with BsaW1 to shorten the nascent strands and allow higher-resolution mapping on 2% (wt/vol) agarose, sodium borate gels (15, 46); under these conditions nascent strands with retained primers would resolve above the np 323 marker (SI Appendix, Fig. S6C). (C) Ban2- and Acc1-digested whole-cell DNAs of control HEK cells (C) or cells expressing Twinkle DNA helicase (Twinkle) and from control (C) or V142I RNase H1 (V142I) fibroblasts were subjected to 1% agarose, 1D-AGE and blot hybridized to h-H15,869–168. HEK cell DNA was psoralen/UV cross-linked before extraction (SI Appendix).
Fig. 7.
Fig. 7.
V142I RNase H1 causes mtDNA aggregation and disruption of mitochondrial morphology. (A) Confocal single optical images of primary human fibroblasts from a control and from the index case with V142I RNase H1 labeled with antibodies to DNA stained green; the outer mitochondrial membrane protein, translocase of outer membrane 20 (TOM20), and the mitochondrial ribosomal proteins MRPS18b and MRPL45, stained red. DNA in the mitochondria produces colocalization of green and red (yellow). In some cases nuclear DNA was stained with DAPI (blue). White arrows indicate the mtDNA clusters observed in the patient-derived cells. (B, i) A raw confocal optical section of a region of a V142I patient fibroblast depicting antibody staining against mtDNA (green). (ii) The reconstruction of i treated with a custom deconvolution algorithm to extend the resolution and showing that the large mtDNA foci comprise multiple smaller units of similar-sized particles. (C) Such particles colocalize (yellow) with staining for antibodies against the mitochondrial ribosomal subunits MRPS18b and MRPL45 and the outer mitochondrial membrane protein TOM20. (D) Single confocal optical section of V142I RNaseH1 and control fibroblasts treated with 20 µM BrdU. Replicating DNA is visualized with antibodies against BrdU (green), and mitochondria are visualized with anti-Tom20 (red); cell nuclei are stained with DAPI (blue). Images show clustering of the BrdU signal in V142I RNaseH1 fibroblasts cells to the DNA clustering in other panels and in SI Appendix, Fig. S3. (Scale bars: 20 µm in A and D; 5 µm in C.)
Fig. 8.
Fig. 8.
V142I RNase H1 quiescent cells and muscle display mtDNA aggregation. Confocal optical images of quiescent human fibroblasts (A) and a 12-μm transverse section of muscle (B) from a control and from the index case with V142I RNase H1. Samples were labeled with antibodies to DNA (green) and the outer mitochondrial membrane protein TOM20 (red) and were stained with DAPI (magenta). White arrows and zoomed images highlight some of the mtDNA clusters observed in the patient-derived cells stained with DAPI. (B) Tom20 and DNA merged images; for individual components, DAPI staining, and additional muscle fibers see SI Appendix, Fig. S10.
Fig. 9.
Fig. 9.
V142I RNase H1 impairs mitochondrial translation and respiration. (A) One-hour [35S]methionine labeling of nascent mitochondrial polypeptides in control (CF) or V142I RNase H1 patient (PF) fibroblasts, fractionated by 12% SDS/PAGE. Tentative polypeptide assignments are identified to the left of the gel: ND1-6, cyt b, COX1-3 and A6, A8 are subunits of respiratory chain complexes I, III, and IV and ATP synthase, respectively. The panel shows two of four experiments. The pair of samples to the right was derived from cells grown to full confluence. V142I cells displayed a 34% decrease in mitochondrial translation compared with the two control cell lines analyzed, based on quantitation of the indicated bands (*). (B) Mitochondrial oxygen consumption rate (OCR) was measured using a Seahorse flux analyzer before (basal) and after the addition of the uncoupler carbonyl cyanide 4-(trifluoromethoxy)phenylhydrazone (FCCP, Sigma; maximal), having subtracted the nonmitochondrial (rotenone-insensitive) OCR. The data represent the mean ± SEM of four independent experiments, each performed in duplicate. Statistical analysis was performed using an unpaired two-tailed Student's t test. Maximal respiration of the V142I (P) cells was significantly lower than that of the control (C) cells (P = 0.018).

References

    1. Area-Gomez E, Schon EA. Mitochondrial genetics and disease. J Child Neurol. 2014;29(9):1208–1215. - PubMed
    1. Kasamatsu H, Vinograd J. Unidirectionality of replication in mouse mitochondrial DNA. Nat New Biol. 1973;241(108):103–105. - PubMed
    1. Yasukawa T, Yang MY, Jacobs HT, Holt IJ. A bidirectional origin of replication maps to the major noncoding region of human mitochondrial DNA. Mol Cell. 2005;18(6):651–662. - PubMed
    1. Fish J, Raule N, Attardi G. Discovery of a major D-loop replication origin reveals two modes of human mtDNA synthesis. Science. 2004;306(5704):2098–2101. - PubMed
    1. Chang DD, Clayton DA. Precise assignment of the light-strand promoter of mouse mitochondrial DNA: A functional promoter consists of multiple upstream domains. Mol Cell Biol. 1986;6(9):3253–3261. - PMC - PubMed

Publication types