. 2016 Sep;57(9):1644-58.
doi: 10.1194/jlr.M066522. Epub 2016 Jul 8.

Niemann-Pick type C2 deficiency impairs autophagy-lysosomal activity, mitochondrial function, and TLR signaling in adipocytes

Affiliations

Niemann-Pick type C2 deficiency impairs autophagy-lysosomal activity, mitochondrial function, and TLR signaling in adipocytes

Hong Guo et al. J Lipid Res. 2016 Sep.

Abstract

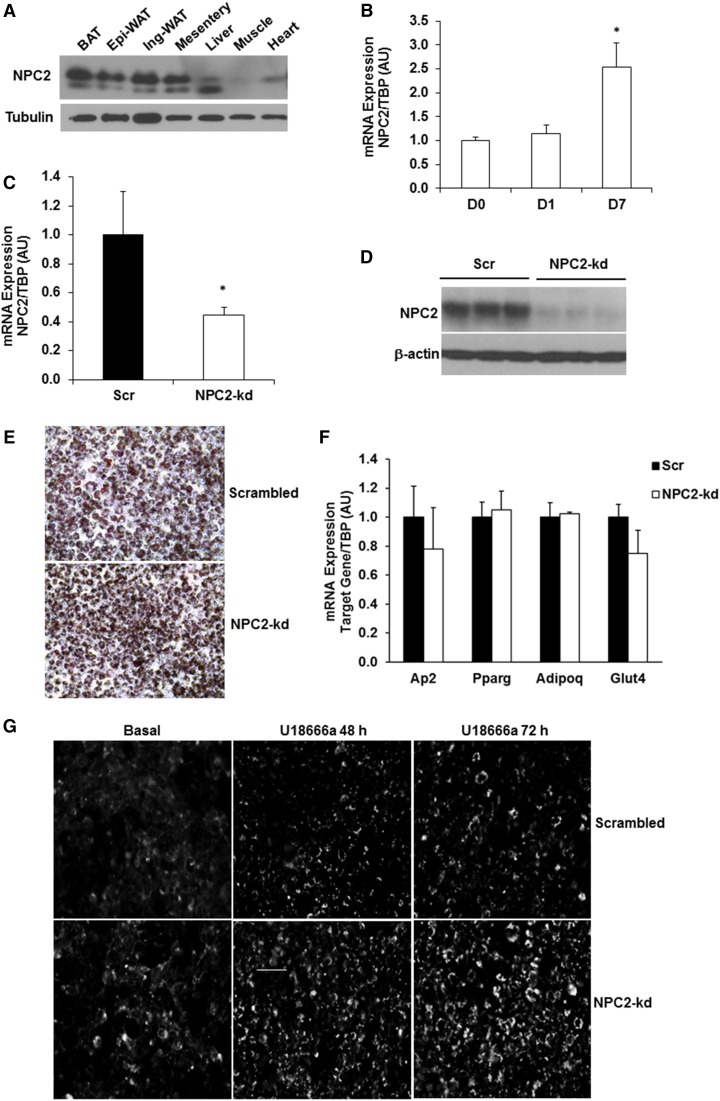
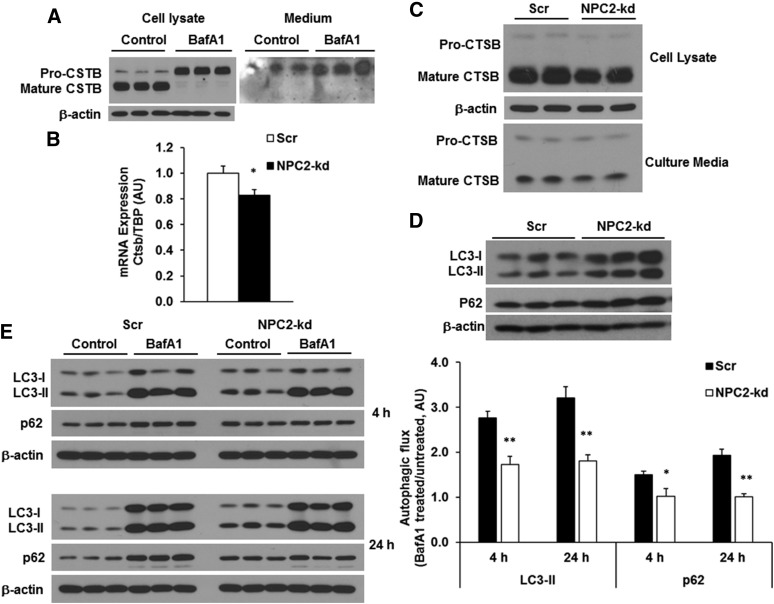
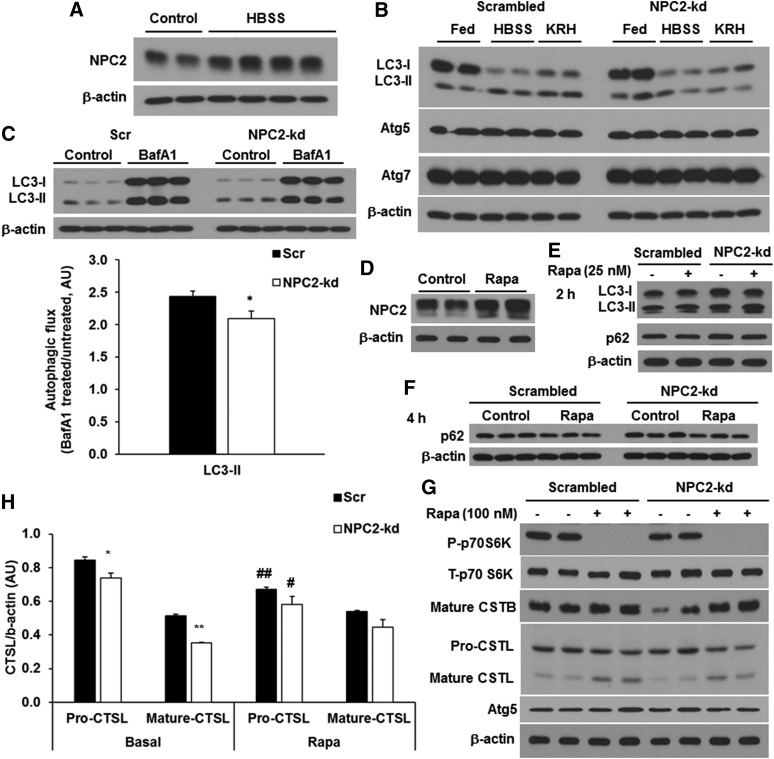
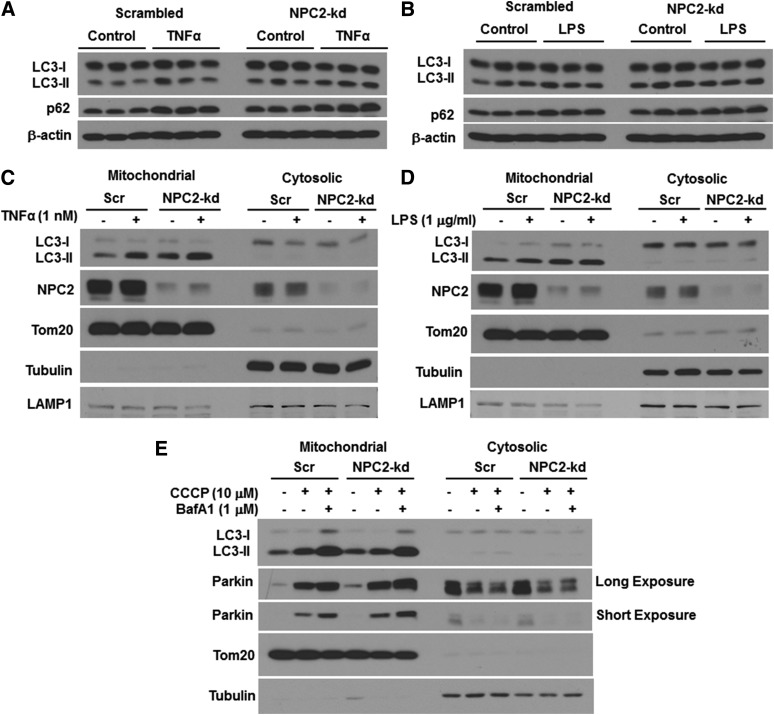
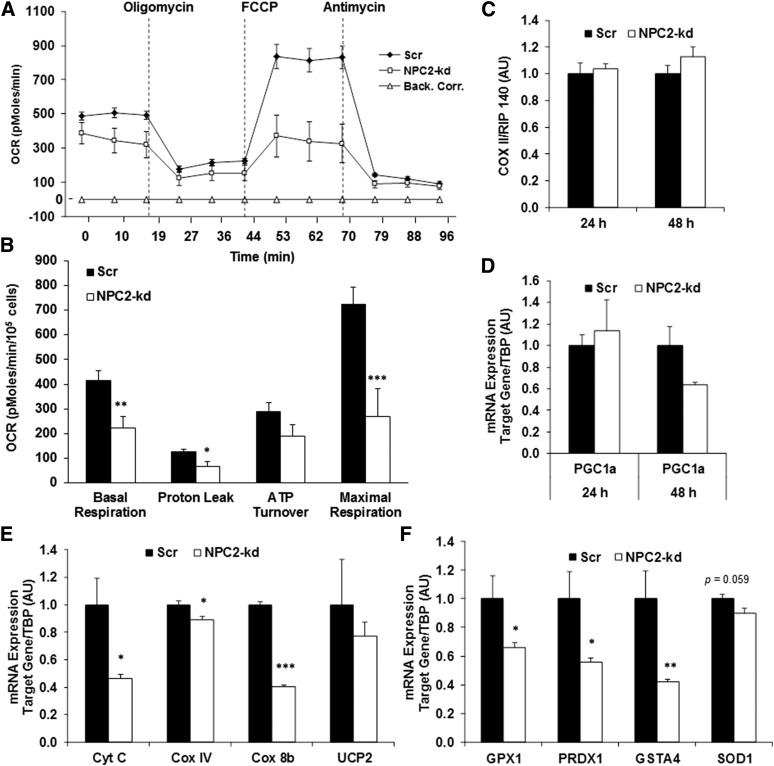
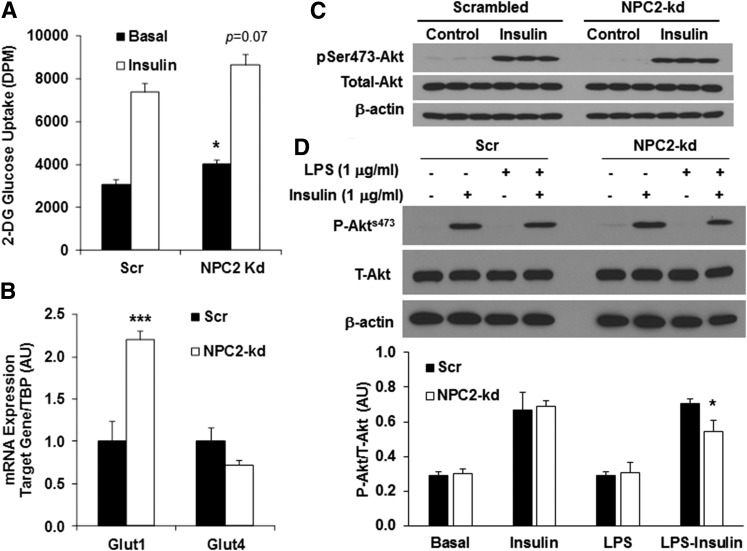
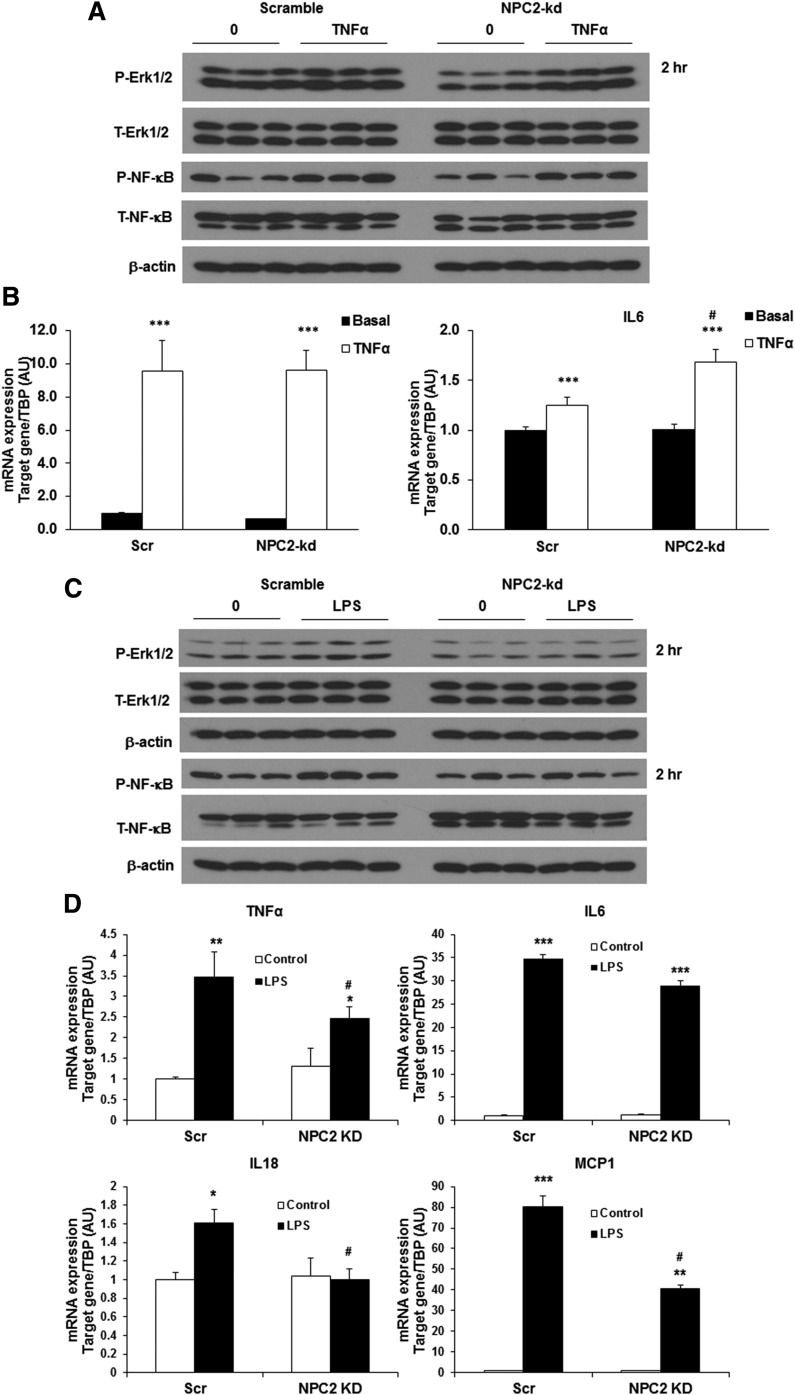
In this study, we investigated the role and mechanism of Niemann-Pick type C (NPC)2 in regulating lysosomal activity, mitophagy, and mitochondrial function in adipocytes. We found that knocking down NPC2 impaired lysosomal activity, as evidenced by the reduced mature cathepsin B, the increased accumulation of light chain 3 (LC3) and p62, and the decreased autophagic flux. In NPC2-knockdown (kd) adipocytes, the starvation-induced conversion of LC3-I to LC3-II was abolished. More interestingly, the majority of NPC2 was found in the mitochondrial fraction, and NPC2 deficiency led to impaired autophagic flux and decreased induction of LC3-II in the mitochondrial fraction during mitochondrial stress. Moreover, cellular respiration profiling revealed that NPC2-kd adipocytes had significantly decreased basal/maximal respiration and mitochondrial gene expression compared with scrambled cells, suggesting mitochondrial dysfunction. Additionally, we found that the mitochondrial recruitment of LC3-II induced by lipopolysaccharide (LPS), but not TNFα, was blunted in NPC2-kd adipocytes. Most intriguingly, NPC2-kd selectively diminished LPS-induced NFκB and ERK1/2 phosphorylation and the expression of pro-inflammatory genes, indicating that toll-like receptor signaling activation is impaired in the absence of NPC2. Our results suggest that NPC2 is in a mitochondrially associated autophagosome and plays an important role in regulating mitophagy, mitochondrial quality control, and mitochondrial function.

Keywords: Niemann-Pick disease; inflammation; mitochondria; obesity • lysosome; toll-like receptor.


Figures

Fig. 1.
Fig. 1.
NPC2 kd in 3T3-L1 adipocytes. A: NPC2 protein expression in different tissues. B: The gene expression of Npc2 in 3T3-L1 cells during differentiation. C: Npc2 mRNA expression in 3T3-L1 adipocytes was quantified by quantitative PCR. D: Protein expression of NPC2 in 3T3-L1 adipocytes by Western blot. E: Oil Red O staining of 3T3-L1 cells on day 8 of differentiation. F: Adipogenic gene expression in 3T3-L1 adipocytes on day 8 of differentiation (n = 4 in each group). G: Filipin III fluorescence image of scrambled and NPC2-kd adipocytes treated with 10 μg/ml U18666a for 48 and 72 h, respectively. Images were acquired using the automatic fluorescence microscope at 20× magnification. Scale bar = 50 μm. Data are expressed relative to the value for scrambled (Scr) cells. The values are mean ± SEM. *P < 0.001 versus scrambled cells. Ap2, adipocyte P2; PPARg, peroxisome proliferator-activated receptor gamma; Adipoq, adiponectin; Glut4, glucose transporter type 4.
Fig. 2.
Fig. 2.
Effect of NPC2 kd on lysosomal activity and autophagic flux. A: The protein expression of CTSB in the cell lysate and culture media from the differentiated 3T3-L1 adipocytes treated with 100 nM BafA1 for 24 h. B: The gene expression of CTSB in scrambled and NPC2-kd adipocytes. C: The protein expression and secretion of CTSB from the cells incubated with 10% FBS-culture media for 24 h. D: Autophagic markers LC3 and p62 in scrambled and NPC2-kd adipocytes. E: Autophagic flux measured in the cells incubated with 10% FBS-culture media for 4 and 24 h, respectively. The autophagic flux was determined by calculating the ratio of the densitometry of LC3-II and p62 levels in BafA1-treated cells after normalization by β-actin to that in untreated cells, respectively. The values of gene expression are mean ± SEM; the values of protein expression are mean ± SD. *P < 0.05; **P < 0.01; versus scrambled (Scr) cells. AU, arbitrary units.
Fig. 3.
Fig. 3.
Effect of NPC2 kd on autophagy induction. A: The expression of NPC2 in the differentiated 3T3-L1 adipocytes incubated with HBSS (containing 5 mM glucose) for 4 h. B: The expression of autophagic markers, LC3 and Atg proteins, in NPC2-kd adipocytes incubated with culture media, HBSS (containing 5 mM glucose), and KRH buffer (containing 2.5 mM glucose) for 4 h. C: Autophagic flux measured in the cells incubated in serum-free culture media for 24 h. The autophagic flux was determined by calculating the ratio of the densitometry of LC3-II and p62 levels in BafA1-treated cells after normalization by β-actin to that in untreated cells, respectively. D: The expression of NPC2 in the differentiated 3T3-L1 adipocytes incubated with 100 nM of rapamycin for 48 h. E: LC3 and p62 expression by rapamycin treatment for 2 h. F: The expression of p62 by rapamycin treatment for 4 h. G: Scrambled or NPC2-kd cells were incubated with rapamycin in DMEM containing 25 mM of glucose, 10% of FBS, and 1 μg/ml of insulin for 48 h. H: Western blot analysis of CTSL in scrambled or NPC2-kd cells incubated with rapamycin in DMEM containing 25 mM of glucose, 10% of FBS, and 1 μg/ml of insulin for 48 h. The values are mean ± SD. *P < 0.05, **P < 0.01 versus scrambled cells; #P < 0.05, ##P < 0.01 versus basal. Rapa, rapamycin; AU, arbitrary units.
Fig. 4.
Fig. 4.
Effect of NPC2 kd on inflammation-induced autophagy and mitophagy. LC3 and p62 protein levels in adipocytes treated with 1 nM of TNFα for 4 h (A) and 1 μg/ml of LPS for 4 h (B). LC3 and NPC2 protein levels in the mitochondrial fraction of adipocytes treated with 1 nM of TNFα for 4 h (C) and 1 μg/ml of LPS for 4 h (D). E: Parkin and LC3 protein levels in the mitochondrial fraction of adipocytes treated with 10 μM of CCCP and/or 1 μM of BafA1 for 4 h. Tom 20, tubulin, and LAMP1 serve as the markers of mitochondrial, cytosolic, and lysosomal proteins, respectively. Scr, scrambled.
Fig. 5.
Fig. 5.
Effect of NPC2 kd on mitochondrial function. A, B: Cellular oxygen consumption in scrambled (Scr) and NPC2-kd adipocytes. Oxygen consumption rates (OCRs) were determined in Scr and NPC2-kd adipocytes [oligomycin, 2 μM; carbonyl cyanide 4-(trifluoromethoxy) phenylhydrazone (FCCP), 0.5 μM; antimycin, 4 μM]. C: mtDNA content in Scr and NPC2-kd adipocytes. D, E: The expression of genes involved in mitochondrial biogenesis and mitochondrial function in Scr and NPC2-kd adipocytes (n = 3). F: Antioxidant gene expression in Scr and NPC2-kd adipocytes (n = 3). The values are mean ± SEM. *P < 0.05; **P < 0.01; ***P < 0.001 versus Scr cells. Back. Corr., background correction.
Fig. 6.
Fig. 6.
Effect of NPC2 kd on insulin sensitivity. A: The 2-deoxyglucose uptake in scrambled (Scr) and NPC2-kd adipocytes in the basal and insulin-stimulated condition. B: Gene expression of glucose transporters, Glut1 and Glut4, in Scr and NPC2-kd adipocytes. C, D: Representative Western blots for phosphorylated Akt by insulin stimulation for 30 min in Scr and NPC2-kd adipocytes with and without LPS (1 μg/ml) preincubation for 24 h. The values of gene expression are mean ± SEM. The values of protein expression are mean ± SD. *P < 0.05; ***P < 0.001 versus Scr cells.
Fig. 7.
Fig. 7.
Effect of NPC2 kd on inflammation. A: Representative Western blots for phosphorylated p44/42 MAPK (Erk1/2) and NFκB p65 in scrambled (Scr) and NPC2-kd adipocytes treated with TNFα (1 nM) for 2 h. B: Gene expression of inflammatory cytokines in Scr and NPC2-kd adipocytes treated with TNFα (1 nM) for 48 h. C: Representative Western blots for phosphorylated p44/42 MAPK (Erk1/2) and NFκB p65 in Scr and NPC2-kd adipocytes treated with LPS (1 μg/ml) for 2 h. D: Gene expression of inflammatory cytokines in Scr and NPC2-kd adipocytes treated with LPS (1 μg/ml) for 48 h. The values are mean ± SEM. *P < 0.05, **P < 0.01, ***P < 0.001 versus basal levels; #P < 0.05, versus Scr cells.

Similar articles

Cited by

References

    1. Lionaki E., Markaki M., Palikaras K., and Tavernarakis N.. 2015. Mitochondria, autophagy and age-associated neurodegenerative diseases: new insights into a complex interplay. Biochim. Biophys. Acta. 1847: 1412–1423. - PubMed
    1. Mizushima N., and Komatsu M.. 2011. Autophagy: renovation of cells and tissues. Cell. 147: 728–741. - PubMed
    1. Koga H., Kaushik S., and Cuervo A. M.. 2011. Protein homeostasis and aging: the importance of exquisite quality control. Ageing Res. Rev. 10: 205–215. - PMC - PubMed
    1. Sengupta S., Peterson T. R., and Sabatini D. M.. 2010. Regulation of the mTOR complex 1 pathway by nutrients, growth factors, and stress. Mol. Cell. 40: 310–322. - PMC - PubMed
    1. Lee I. H., Cao L., Mostoslavsky R., Lombard D. B., Liu J., Bruns N. E., Tsokos M., Alt F. W., and Finkel T.. 2008. A role for the NAD-dependent deacetylase Sirt1 in the regulation of autophagy. Proc. Natl. Acad. Sci. USA. 105: 3374–3379. - PMC - PubMed

MeSH terms

Supplementary concepts

LinkOut - more resources