. 2016 Aug 26;291(35):18514-24.
doi: 10.1074/jbc.M116.723379. Epub 2016 Jul 11.

Collagen Accumulation in Osteosarcoma Cells lacking GLT25D1 Collagen Galactosyltransferase

Affiliations

Collagen Accumulation in Osteosarcoma Cells lacking GLT25D1 Collagen Galactosyltransferase

Stephan Baumann et al. J Biol Chem. .

Abstract

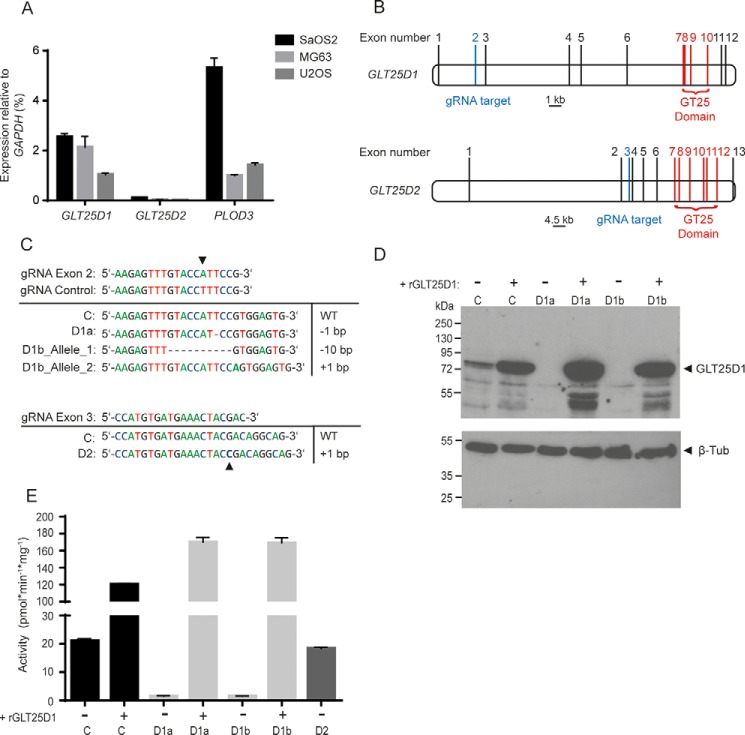
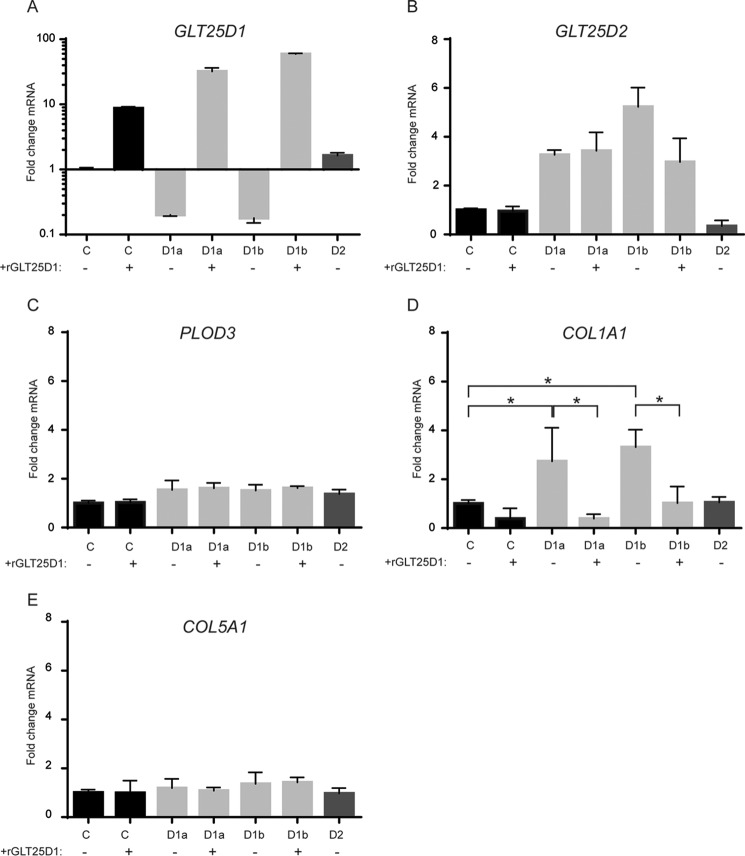
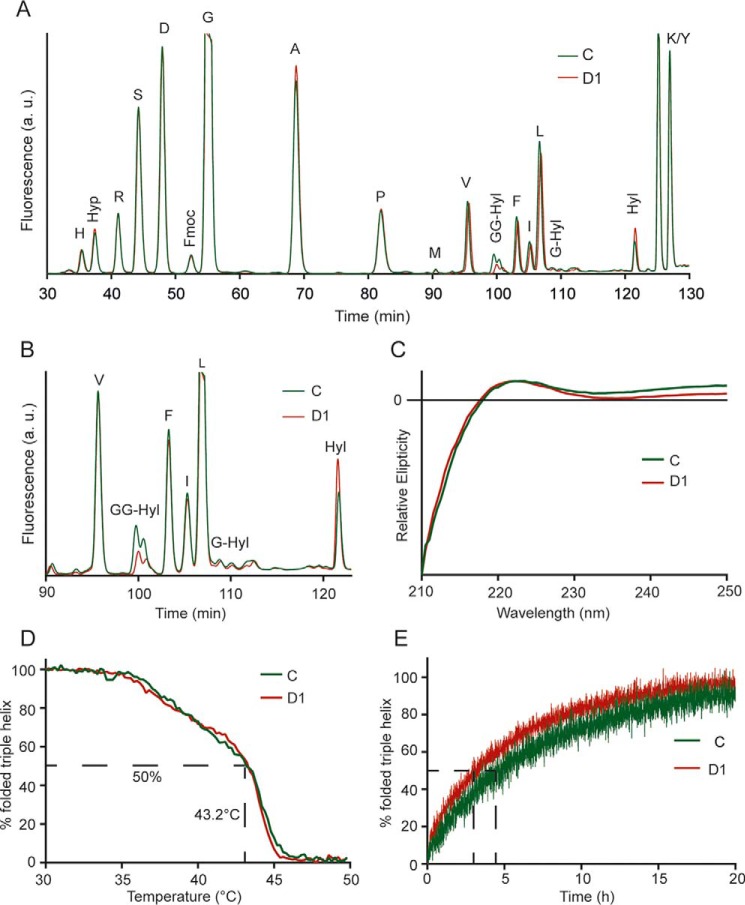
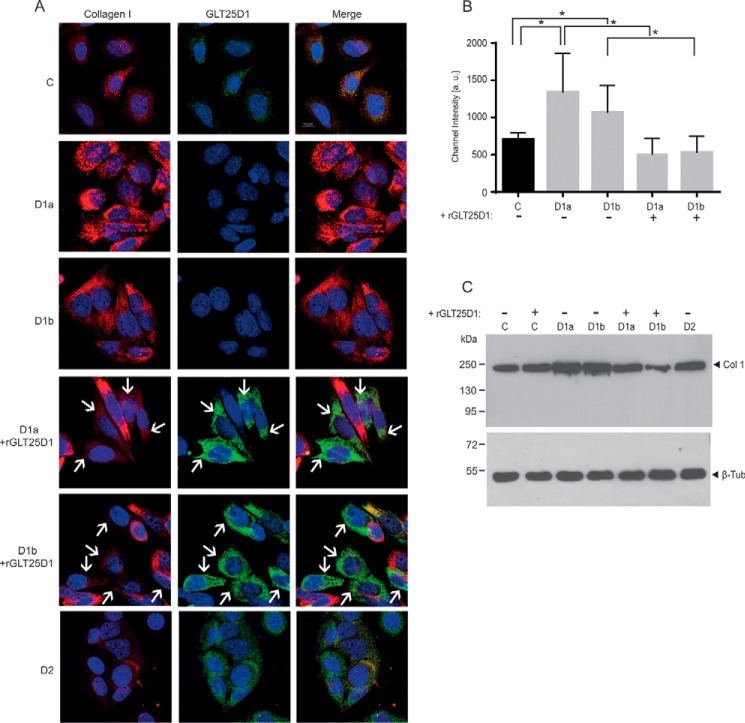
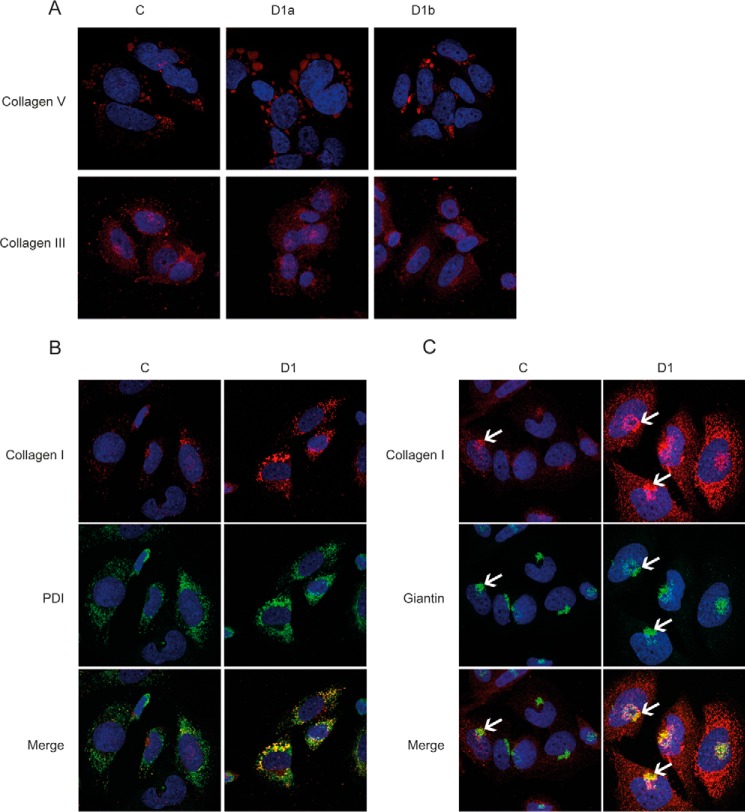
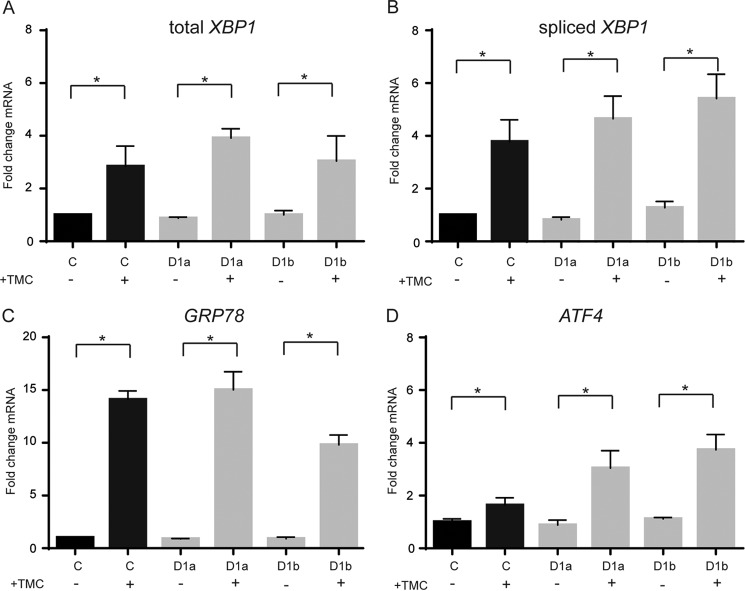
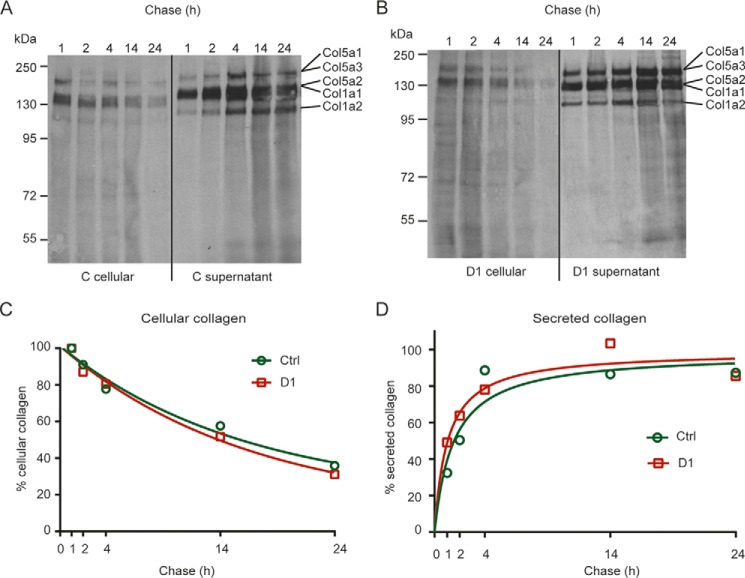
Collagen is post-translationally modified by prolyl and lysyl hydroxylation and subsequently by glycosylation of hydroxylysine. Despite the widespread occurrence of the glycan structure Glc(α1-2)Gal linked to hydroxylysine in animals, the functional significance of collagen glycosylation remains elusive. To address the role of glycosylation in collagen expression, folding, and secretion, we used the CRISPR/Cas9 system to inactivate the collagen galactosyltransferase GLT25D1 and GLT25D2 genes in osteosarcoma cells. Loss of GLT25D1 led to increased expression and intracellular accumulation of collagen type I, whereas loss of GLT25D2 had no effect on collagen secretion. Inactivation of the GLT25D1 gene resulted in a compensatory induction of GLT25D2 expression. Loss of GLT25D1 decreased collagen glycosylation by up to 60% but did not alter collagen folding and thermal stability. Whereas cells harboring individually inactivated GLT25D1 and GLT25D2 genes could be recovered and maintained in culture, cell clones with simultaneously inactive GLT25D1 and GLT25D2 genes could be not grown and studied, suggesting that a complete loss of collagen glycosylation impairs osteosarcoma cell proliferation and viability.

Keywords: CRISPR/Cas; collagen; endoplasmic reticulum (ER); glycosylation; osteosarcoma; protein trafficking (Golgi).


Figures

FIGURE 1.
FIGURE 1.
Characterization of GLT25D1 and GLT25D2 inactivation in osteosarcoma cell lines. A, real time PCR analysis of GLT25D1, GLT25D2, and PLOD3 relative to GAPDH expression levels in SaOS-2, MG63, and U2OS cells (means ± S.D., n = 3 independent experiments). B, representation of GLT25D1 and GLT25D2 gene structure. Lines mark exons, blue lines mark the guide RNA (gRNA) target region, and red lines mark the glycosyltransferase coding region. C, sequences of gRNAs targeting GLT25D1 and GLT25D2 and sequences of the targeted segment in cell clones transfected with control gRNA (row C), with gRNA targeting GLT25D1 (row D1a, clone 1; row D1b, clone 2), and GLT25D2 (row D2). D, Western blotting of GLT25D1 in GLT25D1-null cells with and without overexpression of GLT25D1 cDNA (rGLT25D1). One representative experiment is shown (total n = 3 independent experiments). E, galactosyltransferase activity in lysates of control (column C), GLT25D1-null (columns D1a and D1b), and GLT25D2-null (column D2) cells with and without GLT25D1 cDNA (rGLT25D1) overexpression (mean ± S.D., n = 3 independent experiments).
FIGURE 2.
FIGURE 2.
Transcription analysis of collagen and collagen modifying enzymes. Real time PCR analysis was performed on GLT25D1-null (bars D1a and D1b), GLT25D2-null (bars D2), and control (bars C) cell lines with and without GLT25D1 (rGLT25D1) overexpression. Primers specific for GLT25D1 (A), GLT25D2 (B), PLOD3 (C), COL1A1 (D), and Col5A1 (E) were used. Statistically significant differences as determined by two-tailed Student's t test (p < 0.05) are marked by asterisks (n = 3 independent experiments).
FIGURE 3.
FIGURE 3.
Analysis of collagen post-translational modifications and triple helical stability. A, amino acid analysis of collagens extracted from control (line C) and GLT25D1-null cells (line D1). Collagens were alkaline-hydrolyzed and Fmoc (N-(9-fluorenyl)methoxycarbonyl)-labeled before separation by HPLC. Hyp, hydroxyproline; GG-Hyl, glucosylgalactosyl-hydroxylysine; Hyl, hydroxylysine. B, zoom of region containing glycosylated Hyl. C, circular dichroism of collagens extracted from control (line C) and GLT25D1-null (line D1) cell lines. Spectra were recorded at 10 °C between 210 and 250 nm in a spectropolarimeter. D, thermal transition of control (line C) and GLT25D1-null (line D1) collagens in 0.1 m acetic acid. Temperature was raised from 30 to 50 °C with 0.5 °C/min. Tm value was calculated at 50% triple helical signal. One representative experiment is shown (total n = 3 independent experiments). E, refolding of control (line C) and GLT25D1-null (line D1) collagens in PBS. Collagens were denatured for 5 min at 50 °C prior to refolding at 20 °C.
FIGURE 4.
FIGURE 4.
Immunofluorescent analysis. A, collagen type I and GLT25D1 staining in control (row C), GLT25D1-null (rows D1a and D1b), and GLT25D2-null (row D2) cells with and without overexpression of GLT25D1 cDNA (+GLT25D1). White arrows mark cells expressing the transfected GLT25D1 cDNA. Scale bar equals 10 μm. B, quantification of collagen type I channel intensity based on 50 cells. Asterisks above bars indicate statistically significant differences based on two-tailed paired t test (p < 0.05). C, Western blotting of collagen type I in GLT25D1-null (columns D1a and D1b), GLT25D2-null (column D2), control (column C), and GLT25D1 cDNA (+rGLT25D1) overexpressing cells. One representative experiment is shown (total n = 3 independent experiments).
FIGURE 5.
FIGURE 5.
Immunofluorescent analysis of collagen type III and V and co-localization of collagen type I with ER and Golgi. A, immunofluorescent staining of control (column C) and GLT25D1-null (column D1) cells with anti-collagen type V and anti-collagen type III antibodies (red). B, co-localization of collagen type I (red) and the ER marker protein disulfide-isomerase (PDI, green). C, co-localization of collagen type I (red) and the Golgi marker giantin (green). White arrows point to Golgi and collagen type I-positive region.
FIGURE 6.
FIGURE 6.
Analysis of the unfolded protein response. A–D, real time PCR analysis of RNA extracted from control (bars C) and GLT25D1-null (bars D1) cells. Specific primers for XBP1 (A), spliced XPB1 (B), GRP78 (C), and ATF4 (D) were used with or without induction of the unfolded protein response using tunicamycin (TMC). Statistically significant differences as determined by two-tailed Student's t test (p < 0.05) are marked by asterisks (n = 3 independent experiments).
FIGURE 7.
FIGURE 7.
Analysis of collagen secretion. A–D, pulse-chase analysis of collagens from control (A) and GLT25D1-null (B) cells after pulse period of 4 h. C and D, collagen bands were quantified for cellular collagen (C) and for secreted collagens (D) using ImageJ. One representative experiment is shown (total n = 3 independent experiments).

References

    1. Myllyharju J., and Kivirikko K. I. (2004) Collagens, modifying enzymes and their mutations in humans, flies and worms. Trends Genet. 20, 33–43 - PubMed
    1. Kukkola L., Hieta R., Kivirikko K. I., and Myllyharju J. (2003) Identification and characterization of a third human, rat, and mouse collagen prolyl 4-hydroxylase isoenzyme. J. Biol. Chem. 278, 47685–47693 - PubMed
    1. Vranka J. A., Sakai L. Y., and Bächinger H. P. (2004) Prolyl 3-hydroxylase 1, enzyme characterization and identification of a novel family of enzymes. J. Biol. Chem. 279, 23615–23621 - PubMed
    1. Myllyharju J. (2008) Prolyl 4-hydroxylases, key enzymes in the synthesis of collagens and regulation of the response to hypoxia, and their roles as treatment targets. Ann. Med. 40, 402–417 - PubMed
    1. Spiro R. G. (1967) The structure of the disaccharide unit of the renal glomerular basement membrane. J. Biol. Chem. 242, 4813–4823 - PubMed

MeSH terms