. 2016 Jul;3(3):031411.
doi: 10.1117/1.NPh.3.3.031411. Epub 2016 Jun 21.

Cerebral blood flow and autoregulation: current measurement techniques and prospects for noninvasive optical methods

Affiliations

Cerebral blood flow and autoregulation: current measurement techniques and prospects for noninvasive optical methods

Sergio Fantini et al. Neurophotonics. 2016 Jul.

Abstract

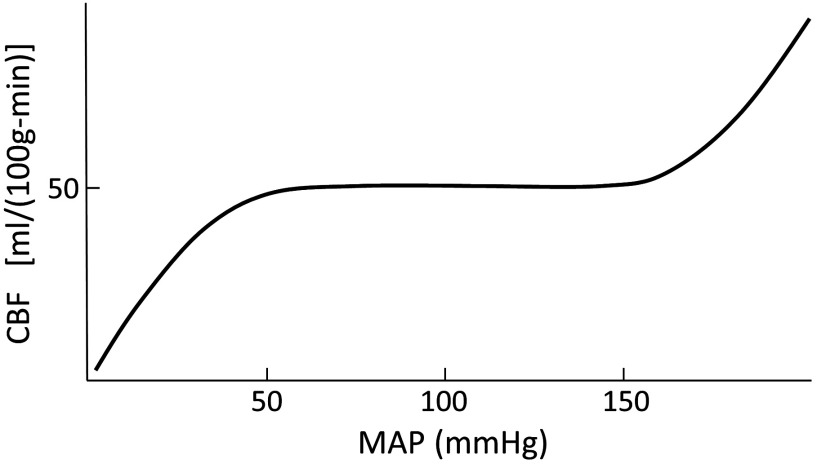
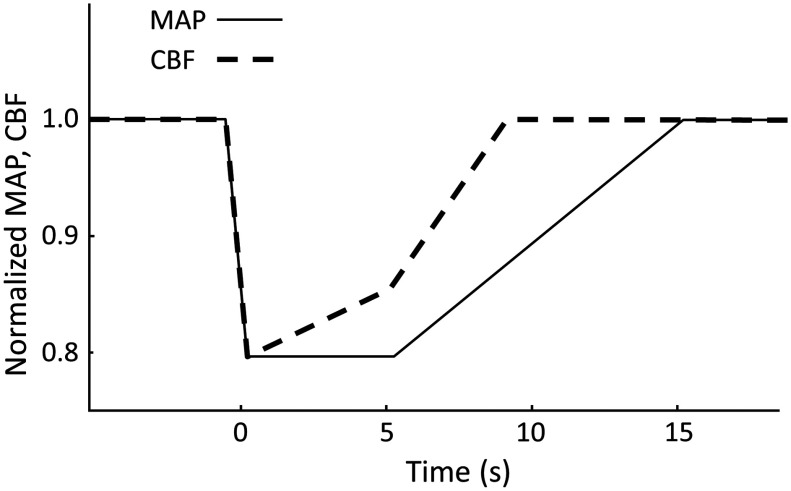
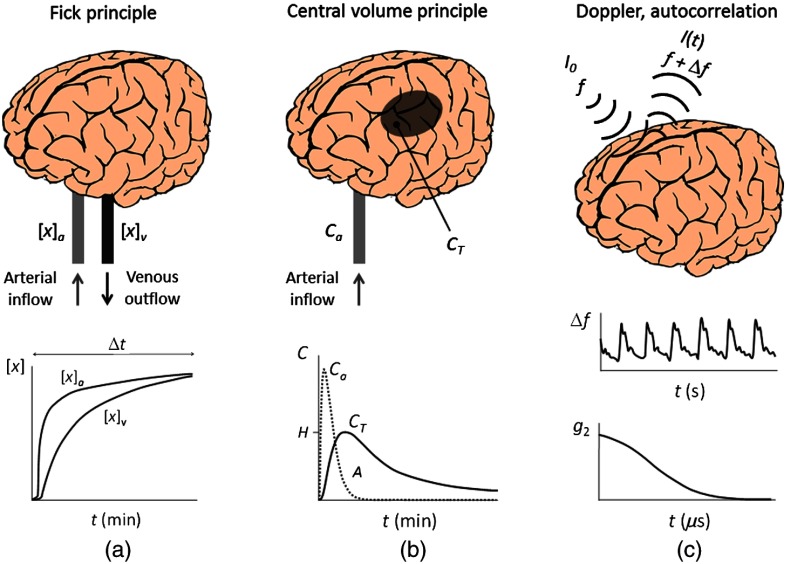
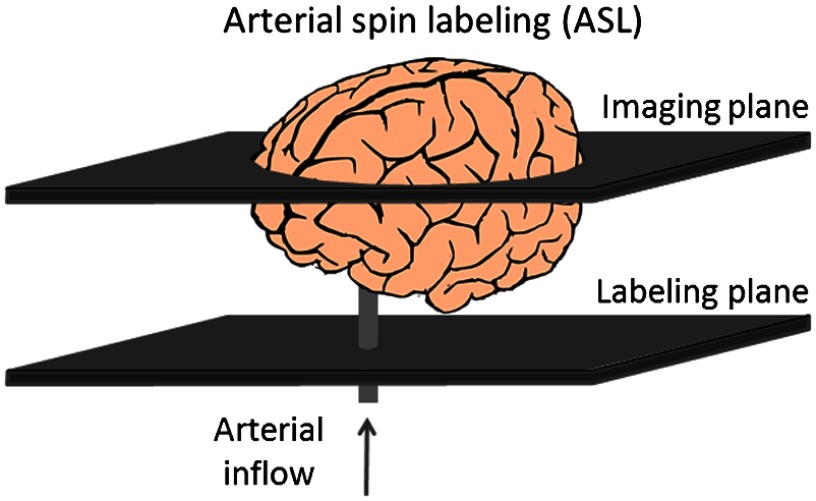
Cerebral blood flow (CBF) and cerebral autoregulation (CA) are critically important to maintain proper brain perfusion and supply the brain with the necessary oxygen and energy substrates. Adequate brain perfusion is required to support normal brain function, to achieve successful aging, and to navigate acute and chronic medical conditions. We review the general principles of CBF measurements and the current techniques to measure CBF based on direct intravascular measurements, nuclear medicine, X-ray imaging, magnetic resonance imaging, ultrasound techniques, thermal diffusion, and optical methods. We also review techniques for arterial blood pressure measurements as well as theoretical and experimental methods for the assessment of CA, including recent approaches based on optical techniques. The assessment of cerebral perfusion in the clinical practice is also presented. The comprehensive description of principles, methods, and clinical requirements of CBF and CA measurements highlights the potentially important role that noninvasive optical methods can play in the assessment of neurovascular health. In fact, optical techniques have the ability to provide a noninvasive, quantitative, and continuous monitor of CBF and autoregulation.

Keywords: Cerebral perfusion; autoregulation; coherent hemodynamics spectroscopy; computed tomography perfusion; diffuse correlation spectroscopy; laser Doppler flowmetry; near-infrared spectroscopy; perfusion magnetic resonance imaging; transcranial Doppler.


Figures

Fig. 1
Fig. 1
Static autoregulation. The classic static autoregulation curve shows a plateau of cerebral blood flow (CBF) versus mean arterial pressure (MAP) in the MAP range from about 50 mmHg to about 170 mmHg.
Fig. 2
Fig. 2
Dynamic autoregulation. Schematic illustration of the mean arterial pressure (MAP) and cerebral blood flow (CBF) transients induced by the fast release of pneumatic thigh cuffs (at time 0) for the assessment of dynamic autoregulation. MAP quickly drops and CBF passively follows this fast change. Then MAP remains at a value lower than at baseline for about 5 s, and during this time autoregulation mechanisms increase CBF toward its precuff-release value. After this initial 5  s period, baroreflex mechanisms increase MAP, and CBF changes reflect both MAP changes and autoregulatory effects.
Fig. 3
Fig. 3
Three basic approaches to the measurement of cerebral blood flow. (a) The Fick principle, (b) the central volume principle, and (c) the Doppler effect or autocorrelation methods. (a) A global CBF measurement is based on recording time traces of the arterial and venous blood concentrations ([x]a and [x]v, respectively) of a diffusible and physiologically inert intravascular tracer x over a time Δt that is sufficiently long to achieve equilibrium in the blood–brain tracer diffusion (in the case of the Kety–Schmidt method, the intravascular tracer was nitrous oxide (N2O), breathed continuously by the subject [see Sec. 3.2.1]). (b) A regional CBF measurement in a volume of interest VT is based on the measurement of the temporal dynamics of the arterial and tissue concentration (Ca and CT, respectively) of an intravascular bolus (H and A represent the peak value and the total area under the curve of the temporal trace of CT (this approach is the basis for a number of nuclear medicine [Sec. 3.3], X-ray [Sec. 3.4], and MRI techniques [Sec. 3.5]). (c) The Doppler effect applies to ultrasound or optical waves that interrogate the brain tissue at a certain frequency f, and results in a frequency shift (Δf) and in a decay rate for the normalized intensity autocorrelation function (g2) that are directly related to the speed of blood flow (these methods are employed by Doppler ultrasound [Sec. 3.6.1], laser Doppler flowmetry [Sec. 3.8.1], and diffuse correlation spectroscopy [Sec. 3.8.2]).
Fig. 4
Fig. 4
Arterial spin labeling (ASL). Schematic representation of the basic approach for blood flow measurement with arterial spin labeling MRI. The water in the arterial inflow to the brain is magnetically tagged in the labeling plane. In the imaging plane, the change in tissue magnetization is directly related to blood flow and yields a measure of CBF.
Fig. 5
Fig. 5
Transcranial Doppler ultrasound. (a) The location of the transtemporal window on the left side of a human subject. (b) A transcranial Doppler (TCD) probe placed against the left transtemporal window has access to the left MCA for measuring blood flow velocity. Reproduced from Ref.  with permission.
Fig. 6
Fig. 6
Thermal diffusion flowmetry. Schematic diagram of the thermal diffusion probe (TDP) showing the active, heated thermistor at the probe tip, which produces a thermal measurement field in the surrounding tissue. The size of the thermal measurement field is dependent on the tissue thermal properties and the perfusion: high perfusion produces a smaller thermal field. The diameter of the field (2r) is approximately 4 mm for typical values of thermal properties and perfusion. The passive thermistor, mounted 5 mm proximal to the probe tip, monitors the tissue baseline temperature variations. Reproduced from Ref.  with permission of Springer.
Fig. 7
Fig. 7
Diffuse correlation spectroscopy (DCS). (a) Schematic of typical DCS instrumentation that consists of a long-coherence length source coupled to a multimode fiber for light delivery to the tissue, photon-counting detector(s), and an auto-correlator board that computes the intensity of the autocorrelation function, g2(τ), based on photon arrival times (b), (c) Sample g2(τ) curves obtained over the frontal cortex in a subject under baseline conditions (black) and under hypercapnia (3% inspired carbon dioxide, gray). The increased decay rate of g2(τ) during hypercapnia reflects the increase in CBF by vasodilation. Reproduced from Ref.  with permission of the Society of Photo Optical Instrumentation Engineers (SPIE).
Fig. 8
Fig. 8
Finger photoplethysmography. A photoplethysmography sensor, which is an optical system featuring a light emitting diode (LED) and an optical detector (photodiode), is built within a finger inflatable cuff. The pressure in the finger cuff is adjusted by an air control unit placed around the wrist of a subject. When no pressure is applied in the cuff (left panel) the optical signal detected is sensitive to the arterial expansion and contraction at the cardiac rate and shows typical intensity fluctuations due to the systolic and diastolic phases of the heart cycle (“Pulse wave” in the figure). In other words the features of the optical signal reflect the dynamic changes in arterial blood volume. When the finger cuff is inflated by a fast pneumatic servo system to achieve arterial unloading at zero transmural pressure (i.e., the arterial pressure equals the cuff pressure) the optical signal flattens out (right panel). In this situation, there is no change in the arterial blood volume and the blood flows in and out of the arterial compartment are the same (“constant flow rate” in the figure). Reproduced from Ref.  with permission. Copyright © 2014 Elsevier Masson SAS. All rights reserved.

References

    1. Bélanger M., Allaman I., Magistretti P. J., “Brain energy metabolism: focus on astrocyte-neuron metabolic cooperation,” Cell Metab. 14, 724–738 (2011). 10.1016/j.cmet.2011.08.016 - DOI - PubMed
    1. Vavilala M. S., Lee L. A., Lam A. M., “Cerebral blood flow and vascular physiology,” Anesthesiol. Clin. N. Am. 20, 247–264 (2002). 10.1016/S0889-8537(01)00012-8 - DOI - PubMed
    1. Tzeng Y. C., Ainslie P. N., “Blood pressure regulation IX: cerebral autoregulation under blood pressure challenges,” Eur. J. Appl. Physiol. 114, 545–559 (2014). 10.1007/s00421-013-2667-y - DOI - PMC - PubMed
    1. Barber T. W., Brockway J. A., Higgins L. S., “The density of tissue in and about the head,” Acta. Neurol. Scandinav. 46, 85–92 (1970). 10.1111/ane.1970.46.issue-1 - DOI - PubMed
    1. Lassen N. A., “Normal average value of cerebral blood flow in younger adults is 50 ml/100 g/min,” J. Cereb. Blood Flow Metab. 5, 347–349 (1985). 10.1038/jcbfm.1985.48 - DOI - PubMed