

The phase of ongoing EEG oscillations predicts the amplitude of peri-saccadic mislocalization
- PMID: 27403937
- PMCID: PMC4941415
- DOI: 10.1038/srep29335
The phase of ongoing EEG oscillations predicts the amplitude of peri-saccadic mislocalization
Abstract
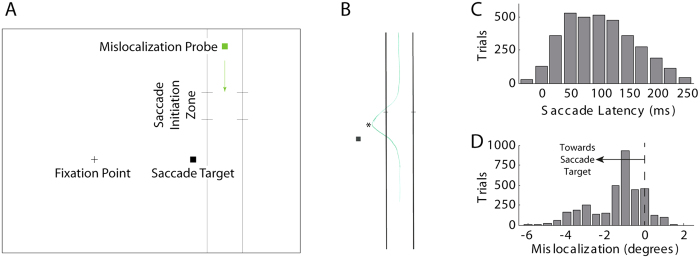
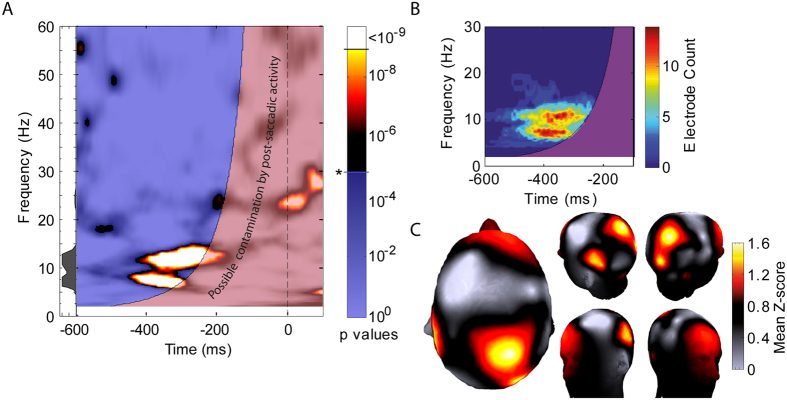
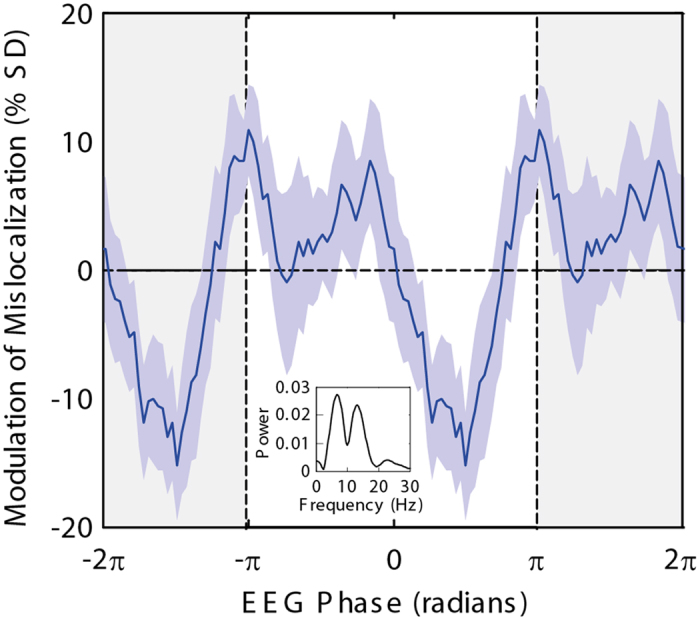
Our constant eye movements mean that updating processes, such as saccadic remapping, are essential for the maintenance of a stable spatial representation of the world around us. It has been proposed that, rather than continually update a full spatiotopic map, only the location of a few key objects is updated, suggesting that the process is linked to attention. At the same time, mounting evidence links attention to oscillatory neuronal processes. We therefore hypothesized that updating processes should themselves show oscillatory characteristics, inherited from underlying attentional processes. To test this, we carried out a combined psychophysics and EEG experiment in human participants, using a saccadic mislocalization task as a behaviourally measureable proxy for spatial updating, and simultaneously recording 64-channel EEG. We then used a time-frequency analysis to test for a correlation between oscillation phase and perceptual outcome. We found a significant phase-dependence of mislocalization in a time-frequency region from around 400 ms prior to saccade initiation and peaking at around 7 Hz, principally apparent over occipital electrodes. Thus the degree of perceived mislocalization is correlated with the phase of a theta-frequency oscillation prior to saccade onset. We conclude that spatial updating processes are indeed linked to rhythmic processes in the brain.
Figures
Similar articles
-
Using temporally aligned event-related potentials for the investigation of attention shifts prior to and during saccades.Neuropsychologia. 2016 Nov;92:129-141. doi: 10.1016/j.neuropsychologia.2016.03.035. Epub 2016 Apr 5. Neuropsychologia. 2016. PMID: 27059211
-
Decoding Remapped Spatial Information in the Peri-Saccadic Period.J Neurosci. 2024 Jul 24;44(30):e2134232024. doi: 10.1523/JNEUROSCI.2134-23.2024. J Neurosci. 2024. PMID: 38871460 Free PMC article.
-
Probing the dynamics of perisaccadic vision with EEG.Neuropsychologia. 2016 May;85:337-48. doi: 10.1016/j.neuropsychologia.2015.12.012. Epub 2015 Dec 18. Neuropsychologia. 2016. PMID: 26708242
-
Computational models of spatial updating in peri-saccadic perception.Philos Trans R Soc Lond B Biol Sci. 2011 Feb 27;366(1564):554-71. doi: 10.1098/rstb.2010.0229. Philos Trans R Soc Lond B Biol Sci. 2011. PMID: 21242143 Free PMC article. Review.
-
Remapping locations and features across saccades: a dual-spotlight theory of attentional updating.Curr Opin Psychol. 2019 Oct;29:211-218. doi: 10.1016/j.copsyc.2019.03.018. Epub 2019 Apr 4. Curr Opin Psychol. 2019. PMID: 31075621 Free PMC article. Review.
Cited by
-
Regularity is not a key factor for encoding repetition in rapid image streams.Sci Rep. 2019 May 3;9(1):6872. doi: 10.1038/s41598-019-39697-y. Sci Rep. 2019. PMID: 31053793 Free PMC article.
-
Coupling between the phase of a neural oscillation or bodily rhythm with behavior: Evaluation of different statistical procedures.Neuroimage. 2021 Aug 1;236:118050. doi: 10.1016/j.neuroimage.2021.118050. Epub 2021 Apr 19. Neuroimage. 2021. PMID: 33848619 Free PMC article.
-
Gamma Band Oscillations Reflect Sensory and Affective Dimensions of Pain.Front Neurol. 2022 Jan 10;12:695187. doi: 10.3389/fneur.2021.695187. eCollection 2021. Front Neurol. 2022. PMID: 35082742 Free PMC article.
-
The Virtual-Environment-Foraging Task enables rapid training and single-trial metrics of attention in head-fixed mice.Sci Rep. 2018 Nov 26;8(1):17371. doi: 10.1038/s41598-018-34966-8. Sci Rep. 2018. PMID: 30478333 Free PMC article.
-
Binding Mechanisms in Visual Perception and Their Link With Neural Oscillations: A Review of Evidence From tACS.Front Psychol. 2021 Mar 22;12:643677. doi: 10.3389/fpsyg.2021.643677. eCollection 2021. Front Psychol. 2021. PMID: 33828509 Free PMC article. Review.
References
-
- Irwin D. E. Memory for position and identity across eye movements. J. Exp. Psychol. Learn. Mem. Cogn. 18, 307–317 (1992).
-
- Kowler E., Anderson E., Dosher B. & Blaser E. The role of attention in the programming of saccades. Vision Res. 35, 1897–1916 (1995). - PubMed
-
- Prime S. L., Tsotsos L., Keith G. P. & Crawford J. D. Visual memory capacity in transsaccadic integration. Exp. Brain Res. 180, 609–628 (2007). - PubMed
Publication types
MeSH terms
LinkOut - more resources
Full Text Sources
Other Literature Sources
