

Timescale- and Sensory Modality-Dependency of the Central Tendency of Time Perception
- PMID: 27404269
- PMCID: PMC4942040
- DOI: 10.1371/journal.pone.0158921
Timescale- and Sensory Modality-Dependency of the Central Tendency of Time Perception
Abstract
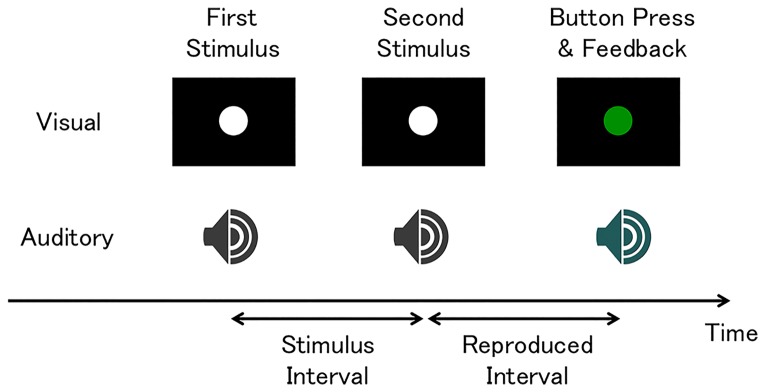
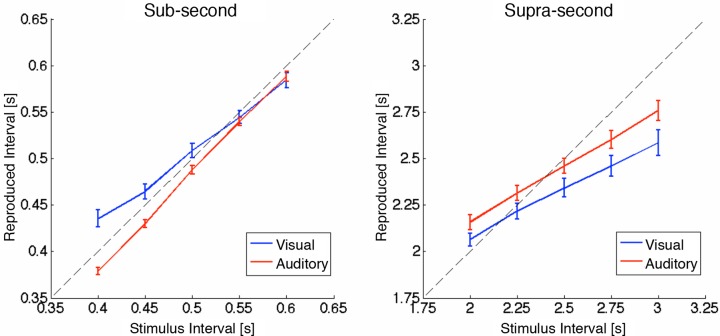
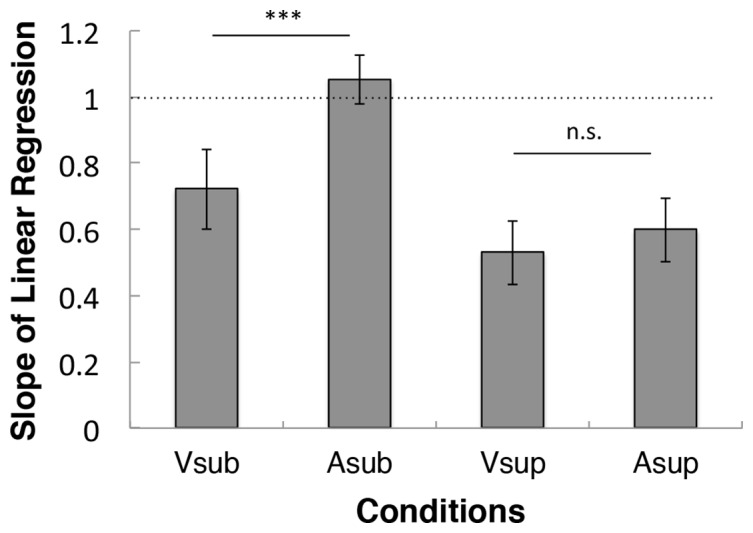
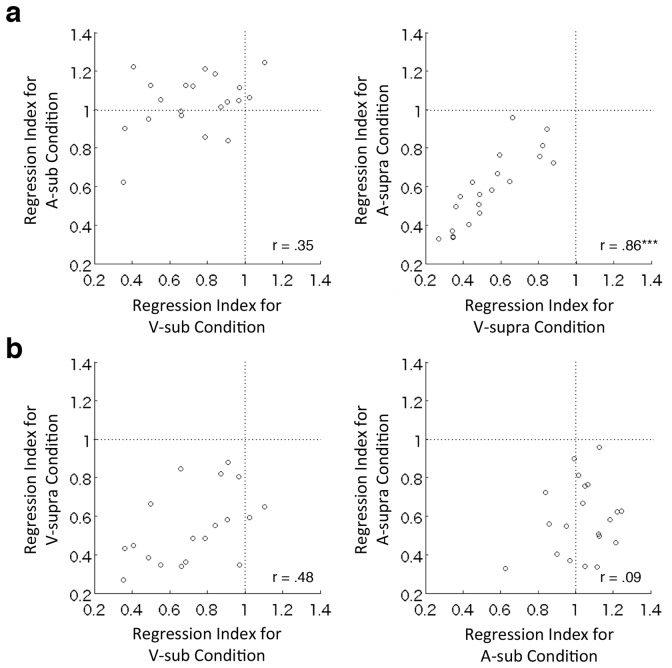
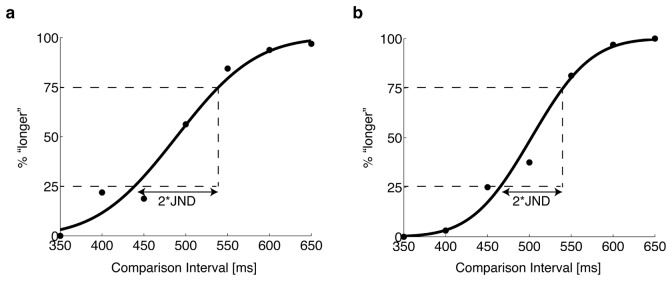
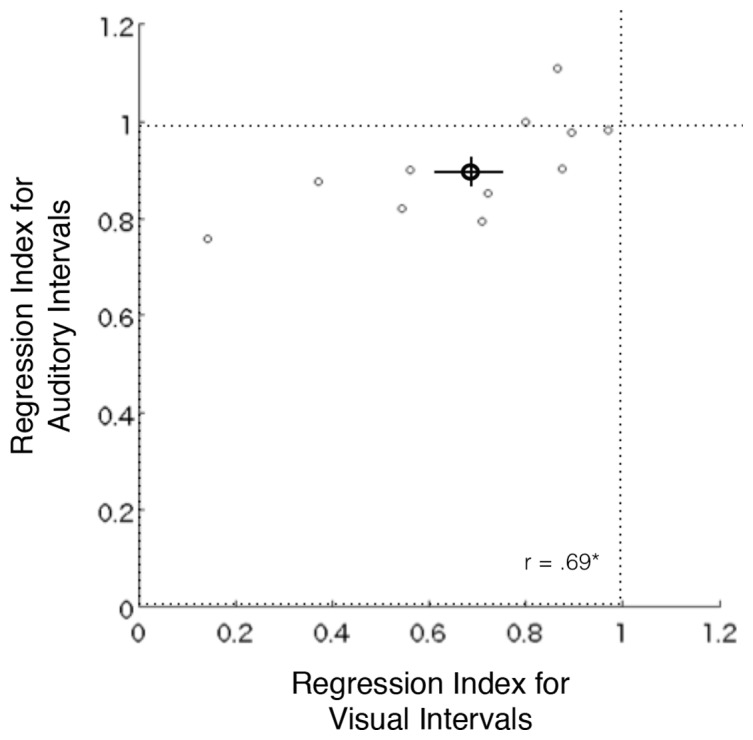
When individuals are asked to reproduce intervals of stimuli that are intermixedly presented at various times, longer intervals are often underestimated and shorter intervals overestimated. This phenomenon may be attributed to the central tendency of time perception, and suggests that our brain optimally encodes a stimulus interval based on current stimulus input and prior knowledge of the distribution of stimulus intervals. Two distinct systems are thought to be recruited in the perception of sub- and supra-second intervals. Sub-second timing is subject to local sensory processing, whereas supra-second timing depends on more centralized mechanisms. To clarify the factors that influence time perception, the present study investigated how both sensory modality and timescale affect the central tendency. In Experiment 1, participants were asked to reproduce sub- or supra-second intervals, defined by visual or auditory stimuli. In the sub-second range, the magnitude of the central tendency was significantly larger for visual intervals compared to auditory intervals, while visual and auditory intervals exhibited a correlated and comparable central tendency in the supra-second range. In Experiment 2, the ability to discriminate sub-second intervals in the reproduction task was controlled across modalities by using an interval discrimination task. Even when the ability to discriminate intervals was controlled, visual intervals exhibited a larger central tendency than auditory intervals in the sub-second range. In addition, the magnitude of the central tendency for visual and auditory sub-second intervals was significantly correlated. These results suggest that a common modality-independent mechanism is responsible for the supra-second central tendency, and that both the modality-dependent and modality-independent components of the timing system contribute to the central tendency in the sub-second range.
Conflict of interest statement
Figures
Similar articles
-
Supramodal representation of temporal priors calibrates interval timing.J Neurophysiol. 2017 Aug 1;118(2):1244-1256. doi: 10.1152/jn.01061.2015. Epub 2017 Jun 14. J Neurophysiol. 2017. PMID: 28615342 Free PMC article.
-
Visual-auditory differences in duration discrimination depend on modality-specific, sensory-automatic temporal processing: Converging evidence for the validity of the Sensory-Automatic Timing Hypothesis.Q J Exp Psychol (Hove). 2018 Nov;71(11):2364-2377. doi: 10.1177/1747021817741611. Epub 2018 Jan 1. Q J Exp Psychol (Hove). 2018. PMID: 30362412
-
Fast transfer of crossmodal time interval training.Exp Brain Res. 2014 Jun;232(6):1855-64. doi: 10.1007/s00221-014-3877-1. Epub 2014 Feb 26. Exp Brain Res. 2014. PMID: 24570386
-
Understanding time perception through non-invasive brain stimulation techniques: A review of studies.Behav Brain Res. 2020 Jan 13;377:112232. doi: 10.1016/j.bbr.2019.112232. Epub 2019 Sep 14. Behav Brain Res. 2020. PMID: 31526769
-
Interactive roles of the cerebellum and striatum in sub-second and supra-second timing: Support for an initiation, continuation, adjustment, and termination (ICAT) model of temporal processing.Neurosci Biobehav Rev. 2016 Dec;71:739-755. doi: 10.1016/j.neubiorev.2016.10.015. Epub 2016 Oct 20. Neurosci Biobehav Rev. 2016. PMID: 27773690 Review.
Cited by
-
Temporal Context affects interval timing at the perceptual level.Sci Rep. 2020 May 29;10(1):8767. doi: 10.1038/s41598-020-65609-6. Sci Rep. 2020. PMID: 32472083 Free PMC article.
-
Gender Differences in the Effect of Facial Attractiveness on Perception of Time.Front Psychol. 2019 Jun 4;10:1292. doi: 10.3389/fpsyg.2019.01292. eCollection 2019. Front Psychol. 2019. PMID: 31231284 Free PMC article.
-
The role of low-frequency rTMS in the superior parietal cortex during time estimation.Neurol Sci. 2019 Jun;40(6):1183-1189. doi: 10.1007/s10072-019-03820-8. Epub 2019 Mar 8. Neurol Sci. 2019. PMID: 30850896 Clinical Trial.
-
Disentangling the effects of modality, interval length and task difficulty on the accuracy and precision of older adults in a rhythmic reproduction task.PLoS One. 2021 Mar 17;16(3):e0248295. doi: 10.1371/journal.pone.0248295. eCollection 2021. PLoS One. 2021. PMID: 33730049 Free PMC article.
-
A purely visual adaptation to motion can differentiate between perceptual timing and interval timing.Proc Biol Sci. 2023 Jun 14;290(2000):20230415. doi: 10.1098/rspb.2023.0415. Epub 2023 Jun 7. Proc Biol Sci. 2023. PMID: 37282539 Free PMC article.
References
MeSH terms
LinkOut - more resources
Full Text Sources
Other Literature Sources
