. 2016 Jul 11;38(1):47-60.
doi: 10.1016/j.devcel.2016.06.009.

Rab10-Mediated Secretion Synergizes with Tissue Movement to Build a Polarized Basement Membrane Architecture for Organ Morphogenesis

Affiliations

Rab10-Mediated Secretion Synergizes with Tissue Movement to Build a Polarized Basement Membrane Architecture for Organ Morphogenesis

Adam J Isabella et al. Dev Cell. .

Abstract

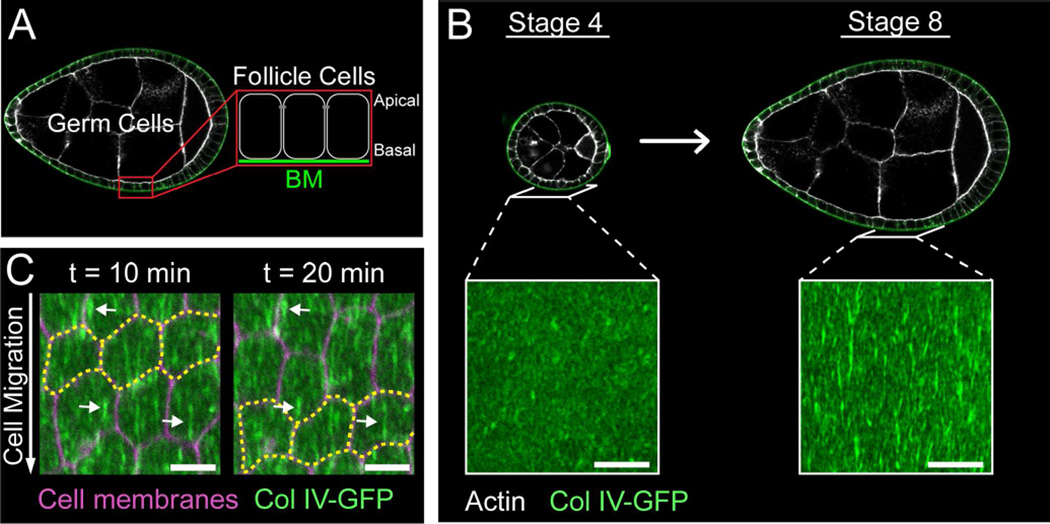
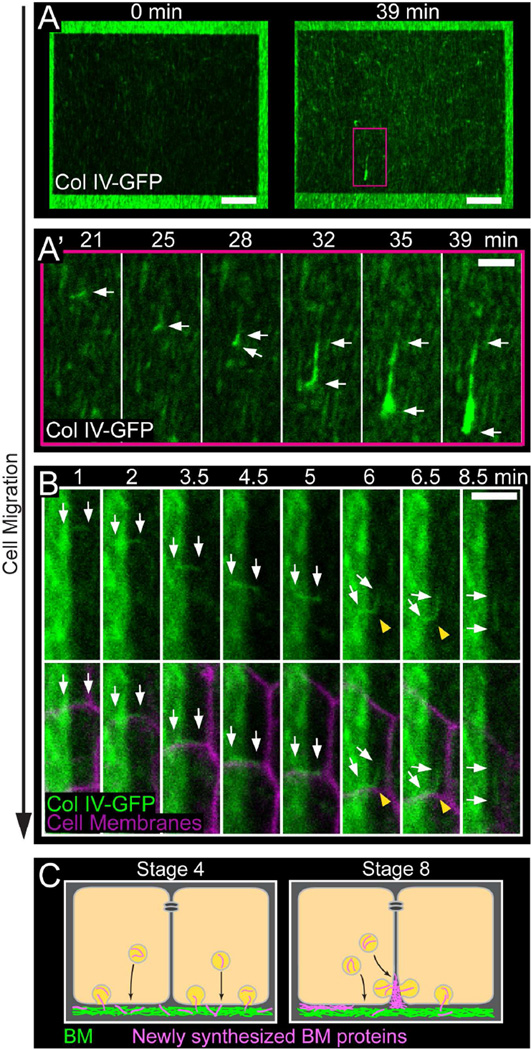
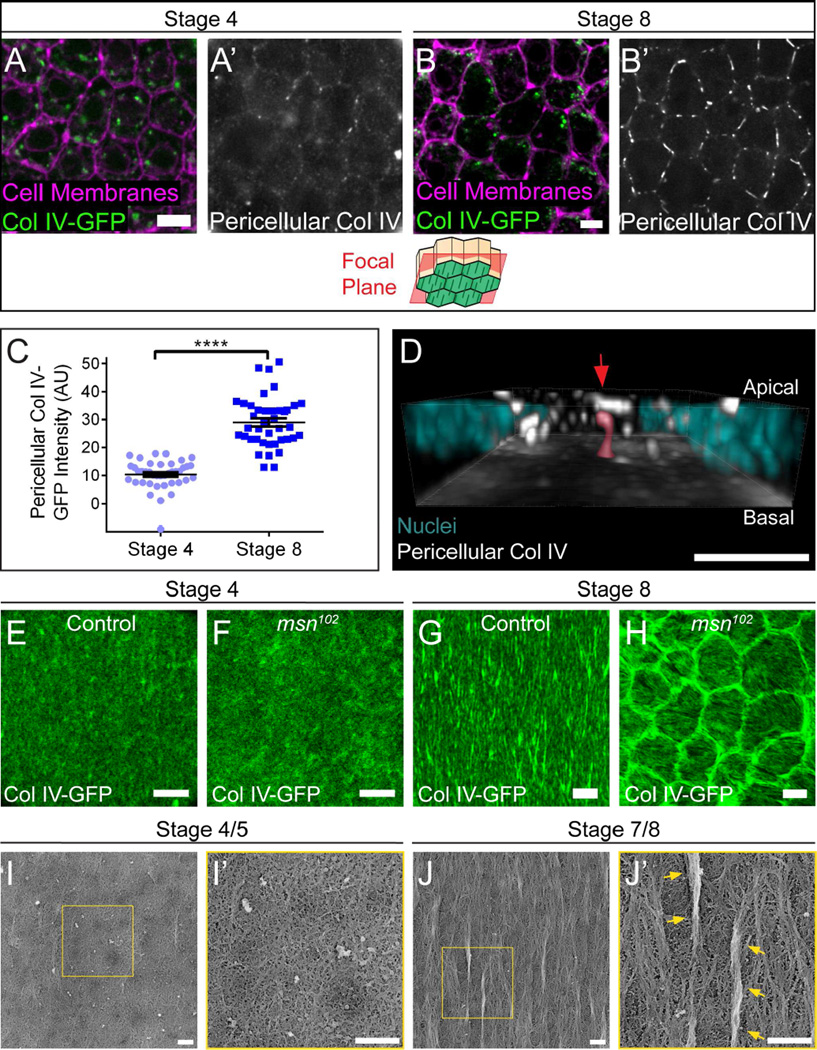
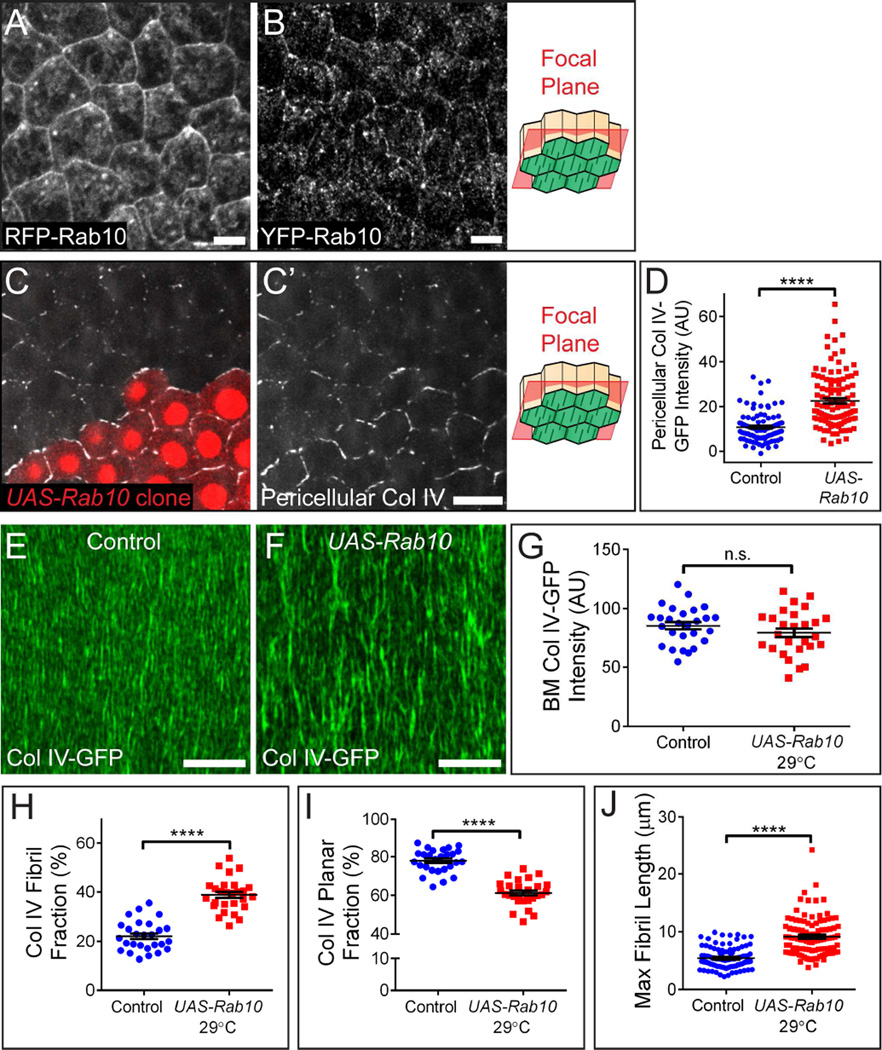
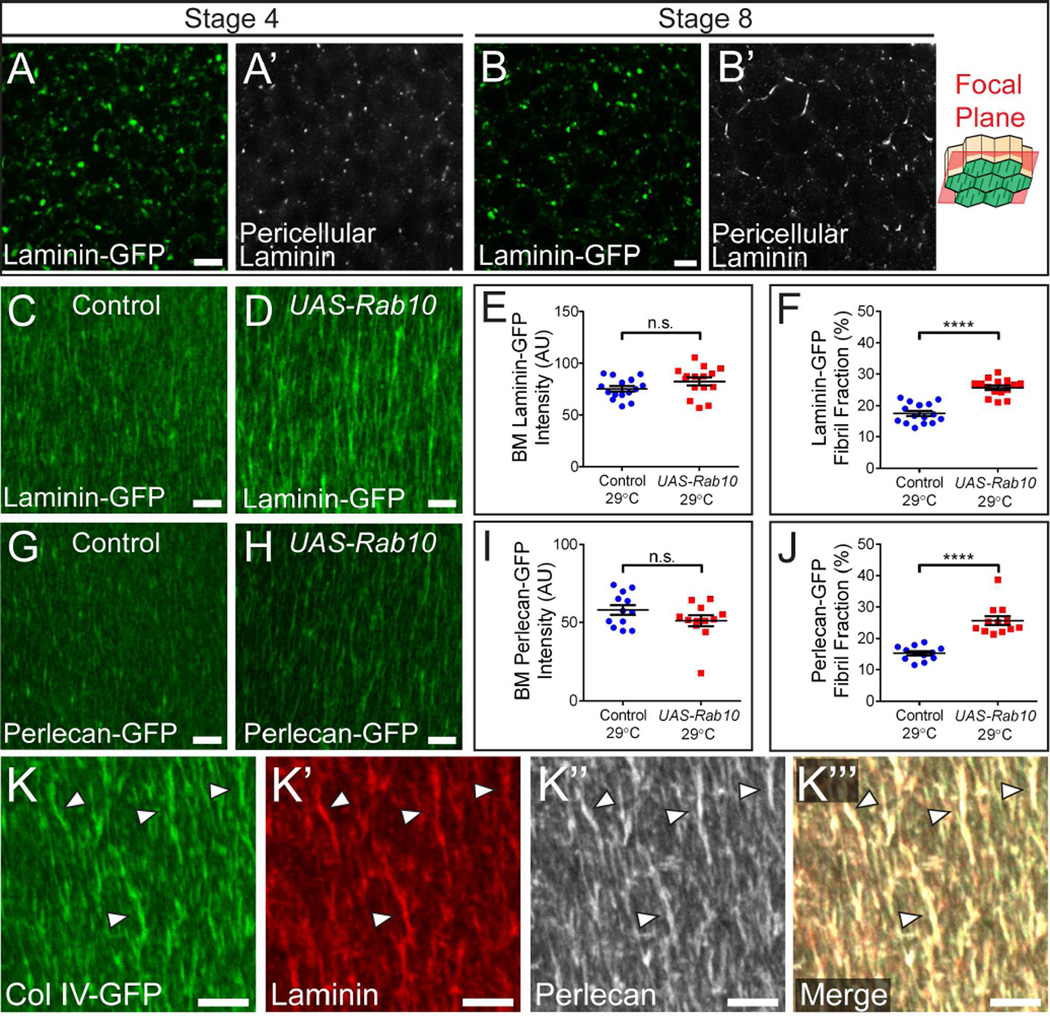
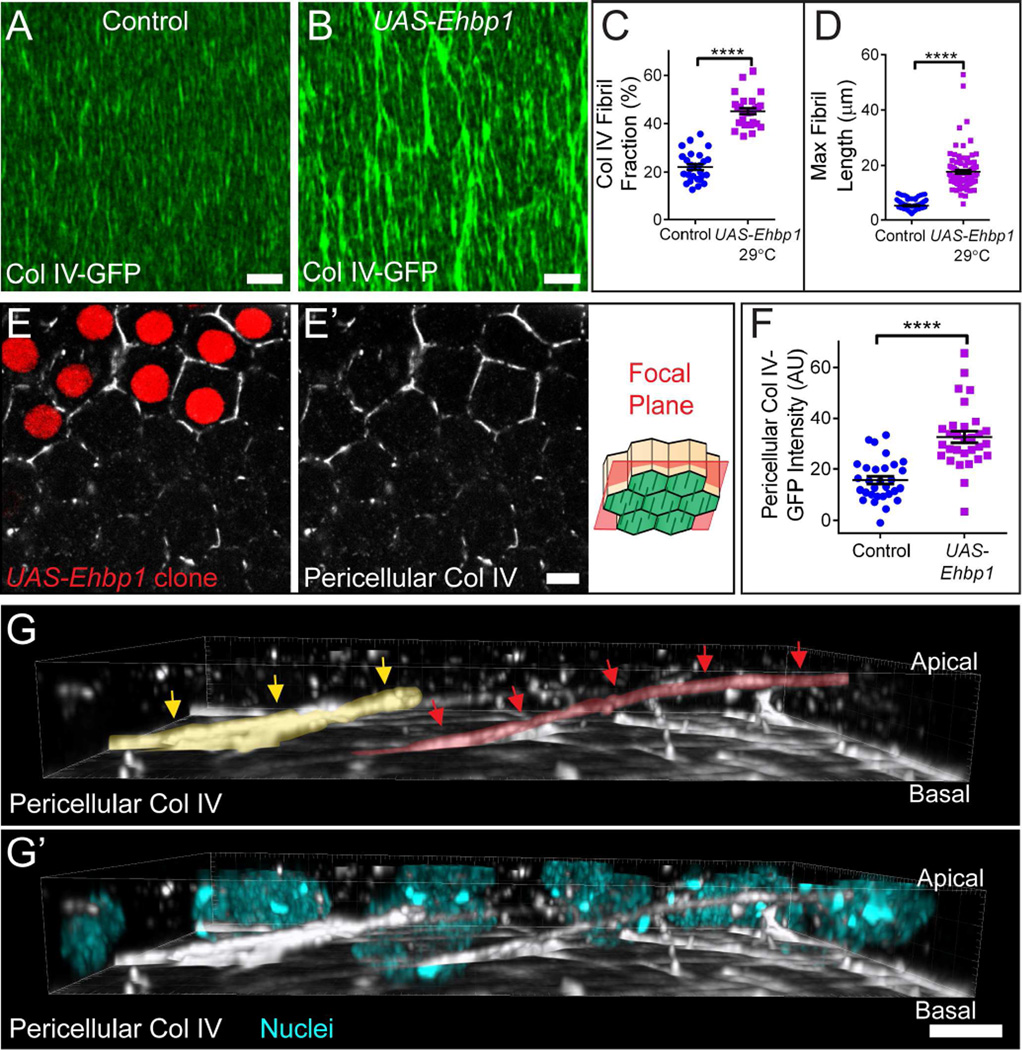
Basement membranes (BMs) are planar protein networks that support epithelial function. Regulated changes to BM architecture can also contribute to tissue morphogenesis, but how epithelia dynamically remodel their BMs is unknown. In Drosophila, elongation of the initially spherical egg chamber correlates with the generation of a polarized network of fibrils in its surrounding BM. Here, we use live imaging and genetic manipulations to determine how these fibrils form. BM fibrils are assembled from newly synthesized proteins in the pericellular spaces between the egg chamber's epithelial cells and undergo oriented insertion into the BM by directed epithelial migration. We find that a Rab10-based secretion pathway promotes pericellular BM protein accumulation and fibril formation. Finally, by manipulating this pathway, we show that BM fibrillar structure influences egg chamber morphogenesis. This work highlights how regulated protein secretion can synergize with tissue movement to build a polarized BM architecture that controls tissue shape.


Figures

Figure 1
Figure 1. Introduction to BM fibrils
(A) Egg chamber structure. (B) Stage 4 egg chambers are round and have BMs that are largely uniform in structure; stage 8 egg chambers are elongated and their BMs contain polarized fibrils. Scale bars = 10 µm. (C) Time-lapse of follicle cell migration. Follicle cells migrate along the stationary BM in the direction of fibril polarity. Yellow outline marks three cells moving over time; arrows mark three stationary fibrils over time. Stage 7. Scale bars = 5 µm. See also Figure S1.
Figure 2
Figure 2. Live imaging of BM fibril formation
(A) Still images from Movie S1 showing fibril incorporation into the BM. (A) First and last frames for Movie S1. The dark rectangle is the photobleached region. The pink box corresponds to the region shown in (A’). (A’) Montage showing an individual nascent fibril with full GFP fluorescence moving in the direction of cell migration and then incorporating into the BM. Arrows mark both ends of the nascent fibril. Scale bars = 10 µm (A), 3 µm (A’). (B) Montage from Movie S2 showing fibril incorporation into the BM. The dark portion on the right of each panel is the photobleached region. A nascent fibril travels with the migrating cell-cell interface until it is drawn away from this location and inserted into the BM. BM insertion causes the fibril to bend (yellow arrowheads) and then become properly aligned in the BM. Arrows mark both ends of the nascent fibril. Scale bar = 3 µm. (C) Model for BM fibril formation. Prior to fibril formation (represented by stage 4), we envision that new BM proteins (pink) exit through the basal surface and directly incorporate into the planar BM (green). During fibril formation (represented by stage 8), a portion of the BM traffic may be redirected to a basal region of the lateral surface. BM proteins would then aggregate in the pericellular space before being deposited in the BM as fibrils. Experiments performed at stage 7. See also Figure S2 and Movies S1 and S2.
Figure 3
Figure 3. BM fibrils form in the pericellular space between follicle cells
(A and B) Representative images of Col IV in the pericellular space. Staining non-permeabilized tissue expressing Col IV-GFP with a GFP antibody reveals pericellular Col IV (white) and does not label intracellular Col IV-GFP (green). The illustration shows the rough distance from the BM (green) at which the images were taken. Pericellular Col IV is low at stage 4 (A) but high at stage 8 (B). Scale bars = 5 µm. (C) Quantification of pericellular Col IV. Data represent mean ± s.e.m. t-test: **** = P<0.0001. (D) 3D reconstruction of the basal half of a stage 8 follicular epithelium, showing pericellular Col IV aggregates. The image is oriented with the BM down; most BM fluorescence has been removed to allow visualization of nascent fibrils. The highlighted nascent fibril (red highlight and arrow) contacts the BM and is likely in the process of BM incorporation. For animation of this 3D reconstruction, see Movie S4. Scale bar = 5 µm. (E–H) At stage 4, the BMs of non-migrating msn102 epithelia (F) show little difference from controls (E). However, at stage 8, the BMs of non-migrating msn102 epithelia (H) show ring-like aggregates around cells, which likely represent nascent fibrils that could not exit the pericellular space. Scale bars = 5 µm. (I–J) Platinum replica electron micrographs of the inner surface of de-cellularized follicular BMs. (I) Stage 4/5 BMs are primarily composed of an isotropic planar matrix. (J) Stage 7/8 BMs contain large linear aggregates that lie atop the planar matrix (arrows), as well as small polarized regions that appear to be integrated within the planar matrix. (I’ and J’) Blow-ups of the boxed regions in (I and J). Scale bars = 500 nm. See also Figure S3 and Movie S4.
Figure 4
Figure 4. Rab10 promotes BM fibril formation
(A and B) RFP-Rab10 produced from a UAS transgene (A) and endogenous YFP-Rab10 (B) both localize to lateral membranes. Antibody staining was used to enhance YFP-Rab10 signal. Scale bars = 5 µm. (C) Representative image showing that clonal UAS-Rab10 expression (red cells) increases pericellular Col IV relative to wild-type cells. Scale bars = 10 µm. (A–C) The illustrations show the rough distance from the BM (green) at which the images were taken. (D) Quantification of the condition shown in (C). (E and F) Representative images showing that UAS-Rab10 expression in all follicle cells at 29°C enhances the incorporation of Col IV into fibrils. Scale bars = 10 µm. (G) UAS-Rab10 does not alter Col IV-GFP levels in the BM. (H) UAS-Rab10 increases the fraction of BM Col IV-GFP contained within fibrils. (I) UAS-Rab10 decreases the fraction of BM Col IV-GFP in the planar matrix. (J) UAS-Rab10 increases maximum BM fibril length. (D and G–J) Data represent mean ± s.e.m. t-test: n.s. = P>0.05, **** = P<0.0001. Experiments performed at stage 8. See also Figure S4.
Figure 5
Figure 5. Rab10 also targets Laminin and Perlecan into BM fibrils
(A and B) Laminin is low in the pericellular space at stage 4 (A) but high at stage 8 (B). Scale bars = 5 µm. The illustration shows the rough distance from the BM (green) at which the images were taken. (C–D) Representative images showing that UAS-Rab10 expression in all follicle cells at 29°C enhances the incorporation of Laminin into fibrils. Scale bars = 5 µm. (E) UAS-Rab10 does not alter Laminin-GFP levels in the BM. (F) UAS-Rab10 increases the fibril fraction of Laminin-GFP. (G–H) Representative images showing that UAS-Rab10 expression in all follicle cells at 29°C enhances the incorporation of Perlecan into fibrils. Scale bars = 5 µm. (I) UAS-Rab10 does not alter Perlecan-GFP levels in the BM. (J) UAS-Rab10 increases the fibril fraction of Perlecan-GFP. (E,F, I and J) Data represent mean ± s.e.m. t-test: n.s. = P>0.05, **** = P<0.0001. (K) Col IV, Laminin, and Perlecan co-localize in individual fibrils (arrowhead). Scale bars = 5 µm. Experiments performed at stage 8 unless otherwise noted in figure.
Figure 6
Figure 6. Ehbp1 promotes BM fibril formation
(A and B) Representative images showing that UAS-Ehbp1 expression at 29°C in all follicle cells enhances BM fibril formation. Scale bars = 5 µm. (C and D) UAS-Ehbp1 expression increases BM fibril fraction (C) and maximum BM fibril length (D). Graphs use same control data as Figures 4H and J. (E) Representative image showing that clonal UAS-Ehbp1 expression (red cells) increases pericellular Col IV relative to neighboring wild-type cells. The illustration shows the rough distance from the BM (green) at which the images were taken. Scale bar = 5 µm. (F) Quantification of the condition shown in (E). (C, D, and F) Data represent mean ± s.e.m. t-test: **** = P<0.0001. (G–G’) 3D reconstruction of the basal 3/4 of the follicular epithelium, showing pericellular Col IV in the UAS-Ehbp1 condition. Extremely long pericellular aggregates can be seen, consistent with the long BM fibrils seen in (B and D). Two nascent fibrils are indicated by red and yellow arrows and highlights. Image is oriented with BM down; most BM fluorescence has been removed to allow visualization of nascent fibrils. For animation of this 3D reconstruction, see Movie S5. Scale bars = 5 µm. Experiments performed at stage 8. See also Figure S5 and Movie S5.
Figure 7
Figure 7. BM fibrils play an instructive role in egg chamber elongation
(A) UAS-Rab10 expression at 23°C increases the egg chamber’s aspect ratio. This effect is first seen at stage 7, suggesting that this BM structure augments elongation morphogenesis. n = 25–32 egg chambers/data point. (B and C) Representative images showing that 23°C UAS-Rab10 expression results in eggs that are longer and narrower than controls. (D and E) Representative images showing that 29°C UAS-Ehbp1 expression results in eggs that are shorter and wider than controls. (B–E) For each pair of eggs, the length and width of the control egg (orange lines) is mapped onto the experimental egg for reference. Scale bars = 50 µm. (F) UAS-Ehbp1 expression at 29°C reduces the egg’s aspect ratio. This effect is not seen until stage 12, suggesting that this BM structure is defective in maintaining the elongated state. n = 23–27 egg chambers/data point. (A and F) Data represent mean ± s.e.m. t-test: * = P<0.05, ** = P<0.01, *** = P<0.001, **** = P<0.0001. (G) Graph showing how egg aspect ratio changes as a function of Col IV fibril fraction. Fibril fractions of 30–33% increase egg aspect ratio compared to controls, whereas fibril fractions of 38% and above reduce it. Grey bars show control ranges for both measurements. X axis: n = 14–27 stage 8 egg chambers/condition. Y axis: n = 40–60 stage 14 egg chambers/condition. Both axes: data represent mean ± s.e.m. t-test values are in Figure S6F. Fibril fraction values represent same data shown in Figures 4H, 6C and S5A. (H) Proposed model for BM fibril formation. The images are stills from the animation shown in Movie S7. During fibril formation, Rab10 directs a portion of newly synthesized BM proteins to a basal region of the lateral plasma membrane for secretion. It may do so in competition with an unidentified pathway that directs BM protein secretion to the basal surface for incorporation into the planar matrix. Secretion to the lateral surface causes BM proteins to aggregate in the pericellular space between follicle cells. Directed follicle cell migration then inserts the nascent fibrils into the BM in the correct orientation. Cell migration direction is to the right. See also Figure S6 and Movies S7.

Comment in

  • Tissue Sculpting by Fibrils.
    Jayadev R, Sherwood DR. Jayadev R, et al. Dev Cell. 2016 Jul 11;38(1):1-3. doi: 10.1016/j.devcel.2016.06.028. Dev Cell. 2016. PMID: 27404350

References

    1. Adams DS, Keller R, Koehl MA. The mechanics of notochord elongation, straightening and stiffening in the embryo of Xenopus laevis. Development. 1990;110:115–130. - PubMed
    1. Aurich F, Dahmann C. A Mutation in fat2 Uncouples Tissue Elongation from Global Tissue Rotation. Cell Rep. 2016;14:2503–2510. - PubMed
    1. Babbey CM, Bacallao RL, Dunn KW. Rab10 associates with primary cilia and the exocyst complex in renal epithelial cells. Am. J. Physiol. Renal Physiol. 2010;299:F495–F506. - PMC - PubMed
    1. Bateman J, Reddy RS, Saito H, Van Vactor D. The receptor tyrosine phosphatase Dlar and integrins organize actin filaments in the Drosophila follicular epithelium. Curr. Biol. 2001;11:1317–1327. - PubMed
    1. Buszczak M, Paterno S, Lighthouse D, Bachman J, Planck J, Owen S, Skora AD, Nystul TG, Ohlstein B, Allen A, Wilhelm JE, Murphy TD, Levis RW, Matunis E, Srivali N, Hoskins RA, Spradling AC. The Carnegie Protein Trap Library: A Versatile Tool for Drosophila Developmental Studies. Genetics. 2007;175:1505–1531. - PMC - PubMed

Publication types

MeSH terms

Substances