

Advances in mapping malaria for elimination: fine resolution modelling of Plasmodium falciparum incidence
- PMID: 27405532
- PMCID: PMC4942778
- DOI: 10.1038/srep29628
Advances in mapping malaria for elimination: fine resolution modelling of Plasmodium falciparum incidence
Erratum in
-
Erratum: Advances in mapping malaria for elimination: fine resolution modelling of Plasmodium falciparum incidence.Sci Rep. 2016 Sep 14;6:32908. doi: 10.1038/srep32908. Sci Rep. 2016. PMID: 27624488 Free PMC article. No abstract available.
Abstract
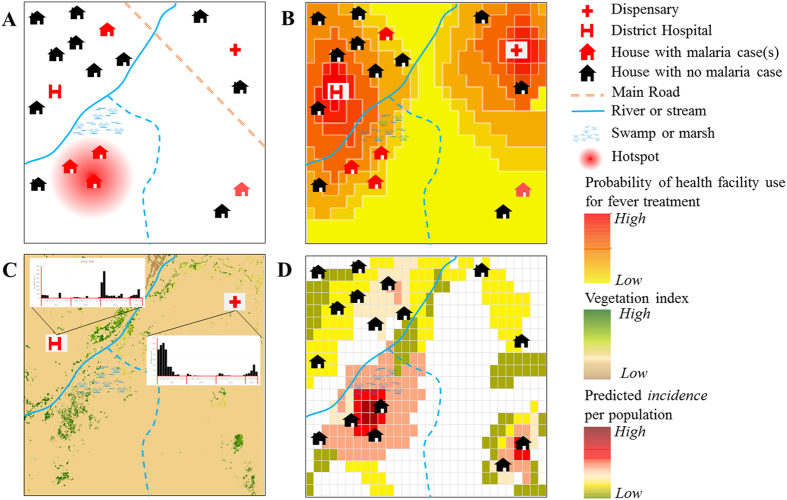
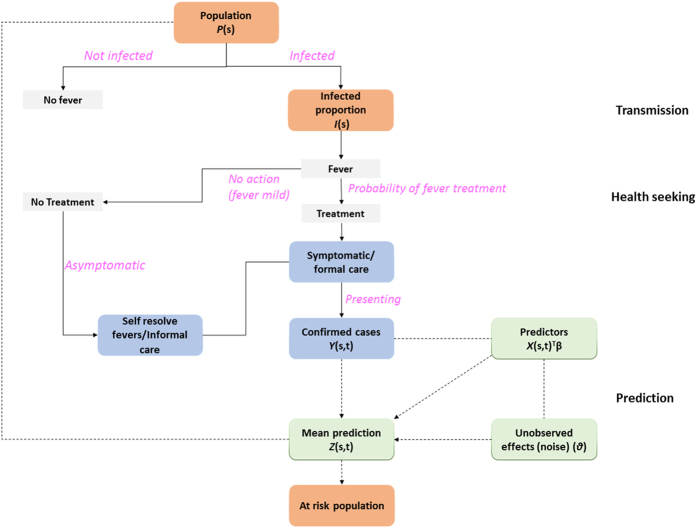
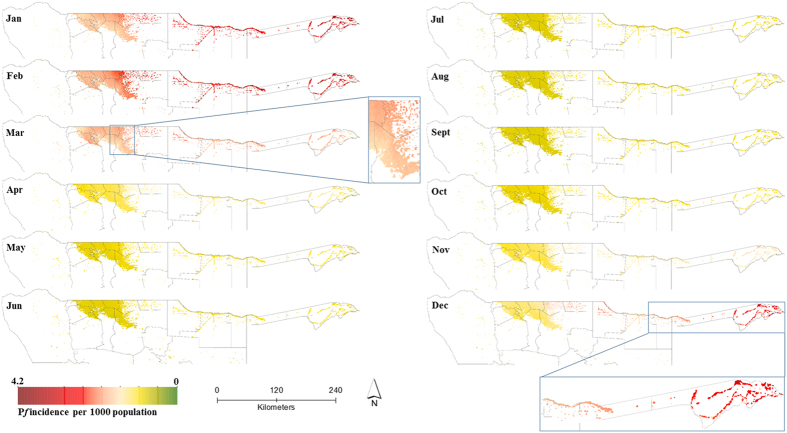
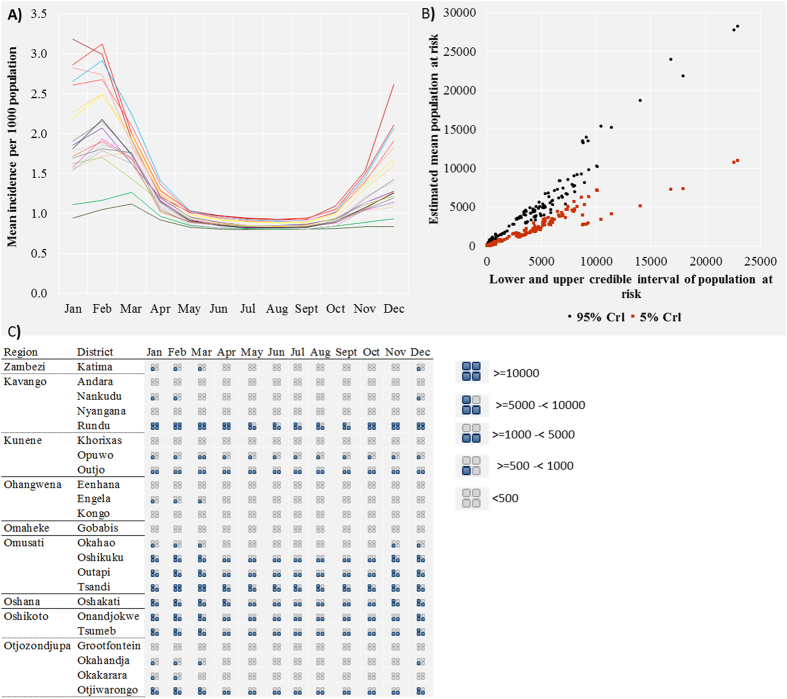
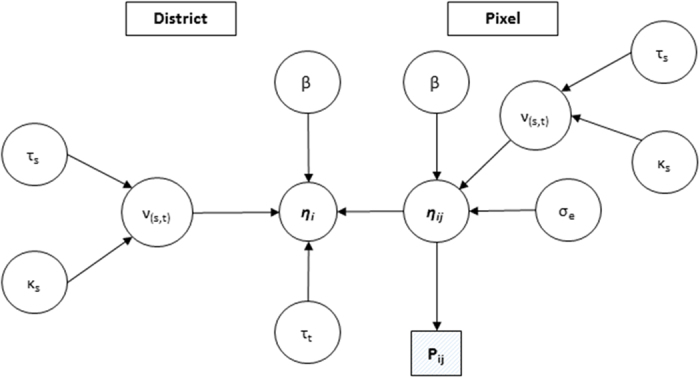
The long-term goal of the global effort to tackle malaria is national and regional elimination and eventually eradication. Fine scale multi-temporal mapping in low malaria transmission settings remains a challenge and the World Health Organisation propose use of surveillance in elimination settings. Here, we show how malaria incidence can be modelled at a fine spatial and temporal resolution from health facility data to help focus surveillance and control to population not attending health facilities. Using Namibia as a case study, we predicted the incidence of malaria, via a Bayesian spatio-temporal model, at a fine spatial resolution from parasitologically confirmed malaria cases and incorporated metrics on healthcare use as well as measures of uncertainty associated with incidence predictions. We then combined the incidence estimates with population maps to estimate clinical burdens and show the benefits of such mapping to identifying areas and seasons that can be targeted for improved surveillance and interventions. Fine spatial resolution maps produced using this approach were then used to target resources to specific local populations, and to specific months of the season. This remote targeting can be especially effective where the population distribution is sparse and further surveillance can be limited to specific local areas.
Figures
Similar articles
-
High-resolution spatio-temporal risk mapping for malaria in Namibia: a comprehensive analysis.Malar J. 2024 Oct 5;23(1):297. doi: 10.1186/s12936-024-05103-w. Malar J. 2024. PMID: 39367414 Free PMC article.
-
The receptive versus current risks of Plasmodium falciparum transmission in northern Namibia: implications for elimination.BMC Infect Dis. 2013 Apr 23;13:184. doi: 10.1186/1471-2334-13-184. BMC Infect Dis. 2013. PMID: 23617955 Free PMC article.
-
Estimation of malaria incidence in northern Namibia in 2009 using Bayesian conditional-autoregressive spatial-temporal models.Spat Spatiotemporal Epidemiol. 2013 Dec;7:25-36. doi: 10.1016/j.sste.2013.09.001. Epub 2013 Sep 17. Spat Spatiotemporal Epidemiol. 2013. PMID: 24238079 Free PMC article.
-
Estimating the global clinical burden of Plasmodium falciparum malaria in 2007.PLoS Med. 2010 Jun 15;7(6):e1000290. doi: 10.1371/journal.pmed.1000290. PLoS Med. 2010. PMID: 20563310 Free PMC article.
-
Changes in Malaria Epidemiology in Africa and New Challenges for Elimination.Trends Parasitol. 2017 Feb;33(2):128-140. doi: 10.1016/j.pt.2016.11.006. Epub 2016 Dec 6. Trends Parasitol. 2017. PMID: 27939610 Free PMC article. Review.
Cited by
-
Malaria Case Fatality Rate among Children under Five in Burkina Faso: An Assessment of the Spatiotemporal Trends Following the Implementation of Control Programs.Int J Environ Res Public Health. 2020 Mar 12;17(6):1840. doi: 10.3390/ijerph17061840. Int J Environ Res Public Health. 2020. PMID: 32178354 Free PMC article.
-
Micro-spatial distribution of malaria cases and control strategies at ward level in Gwanda district, Matabeleland South, Zimbabwe.Malar J. 2017 Nov 21;16(1):476. doi: 10.1186/s12936-017-2116-1. Malar J. 2017. PMID: 29162102 Free PMC article.
-
Sub-national stratification of malaria risk in mainland Tanzania: a simplified assembly of survey and routine data.Malar J. 2020 May 8;19(1):177. doi: 10.1186/s12936-020-03250-4. Malar J. 2020. PMID: 32384923 Free PMC article.
-
Travel patterns and demographic characteristics of malaria cases in Swaziland, 2010-2014.Malar J. 2017 Sep 8;16(1):359. doi: 10.1186/s12936-017-2004-8. Malar J. 2017. PMID: 28886710 Free PMC article.
-
Progress towards onchocerciasis elimination in Côte d'Ivoire: A geospatial modelling study.PLoS Negl Trop Dis. 2021 Feb 10;15(2):e0009091. doi: 10.1371/journal.pntd.0009091. eCollection 2021 Feb. PLoS Negl Trop Dis. 2021. PMID: 33566805 Free PMC article.
References
-
- Global Health Group. Atlas of malaria eliminating countries, (San Francisco, California, 2011). Available at: http://www.malariaeliminationgroup.org/sites/default/files/atlas/global/....pdf. (Date of access: 03/03/2014) (2011).
Publication types
MeSH terms
Grants and funding
LinkOut - more resources
Full Text Sources
Other Literature Sources
