. 2016 Sep;172(1):28-37.
doi: 10.1104/pp.16.00879. Epub 2016 Jul 12.

Long-Term Growth of Moss in Microfluidic Devices Enables Subcellular Studies in Development

Affiliations

Long-Term Growth of Moss in Microfluidic Devices Enables Subcellular Studies in Development

Carlisle S Bascom Jr et al. Plant Physiol. 2016 Sep.

Abstract

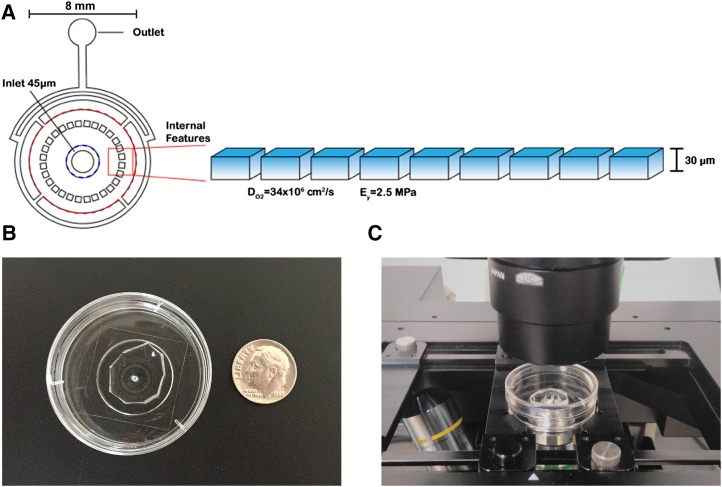
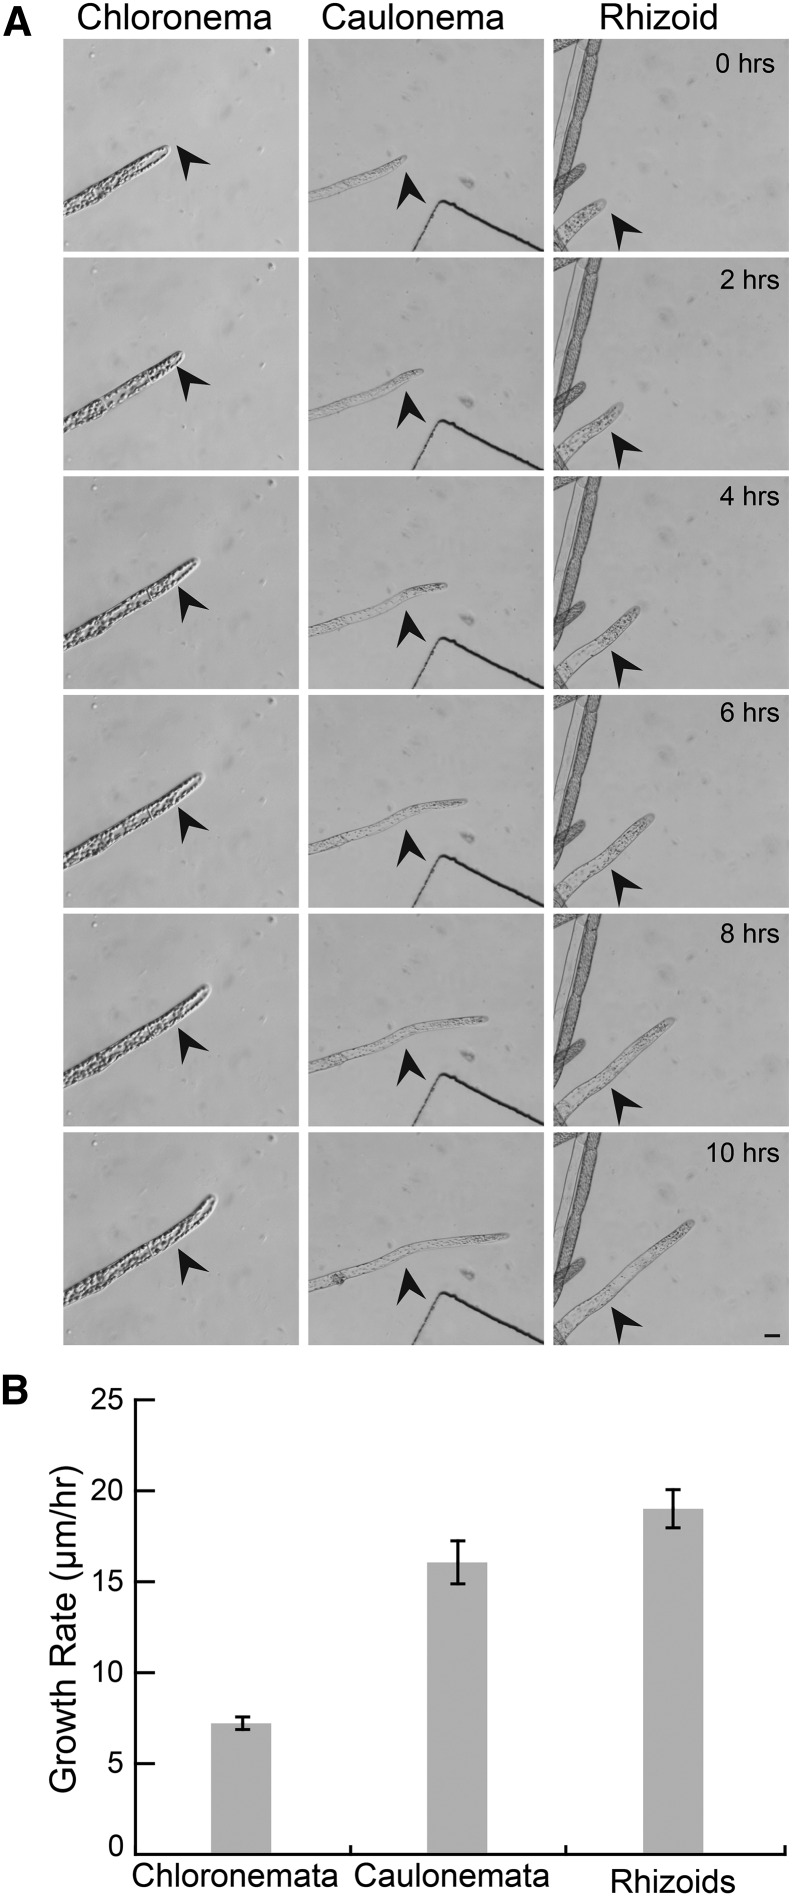
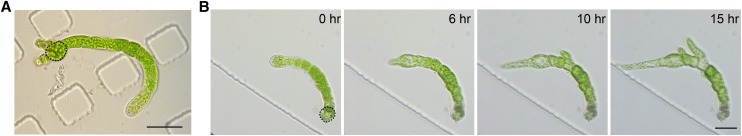
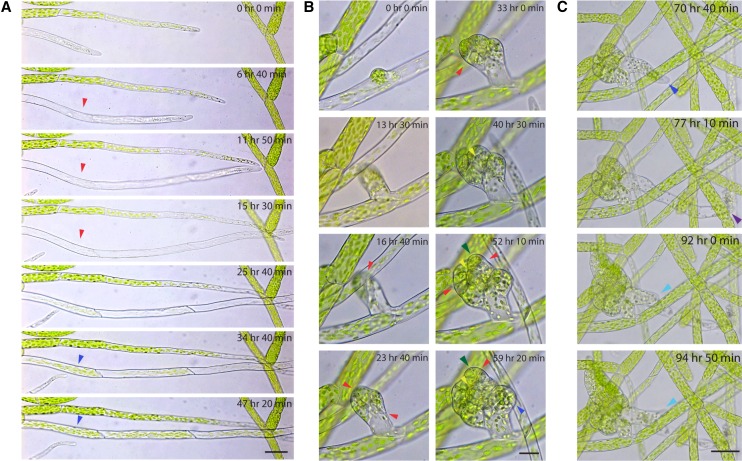
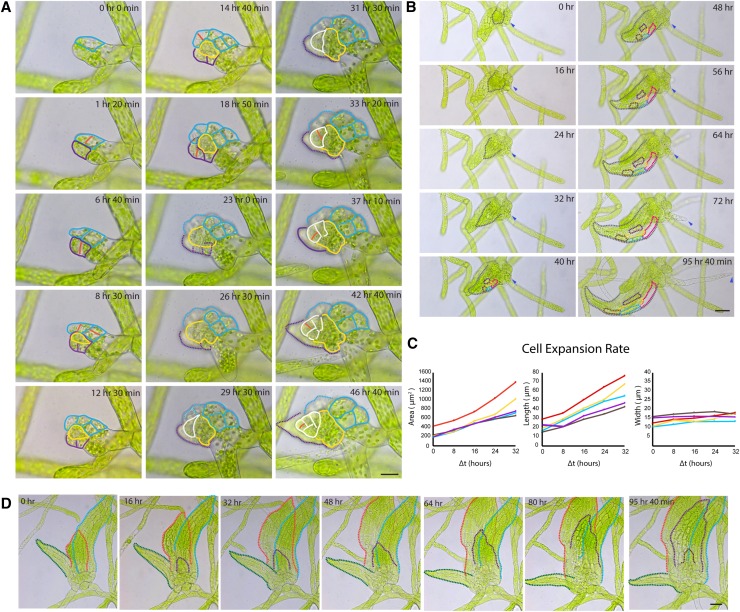
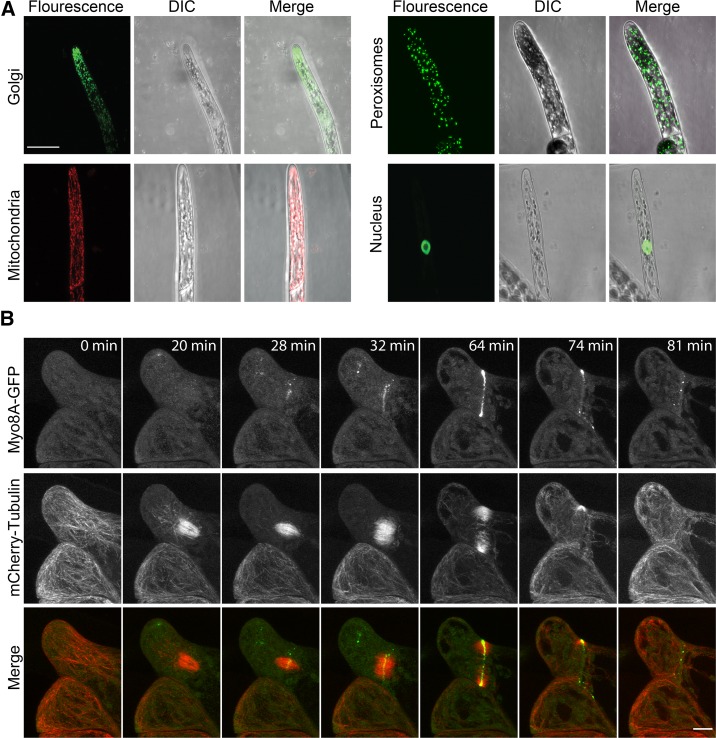
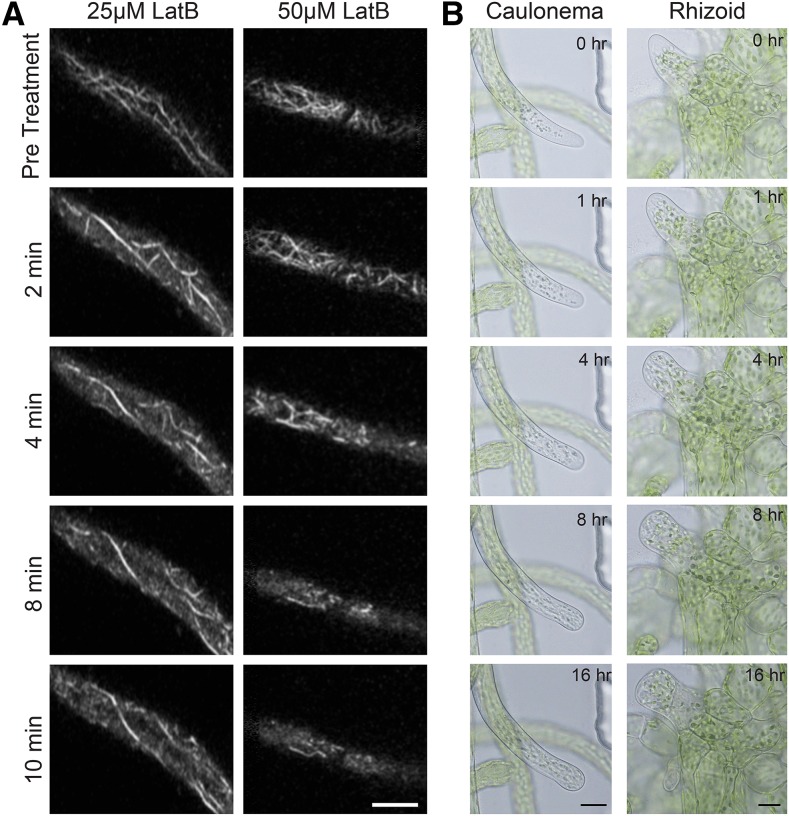
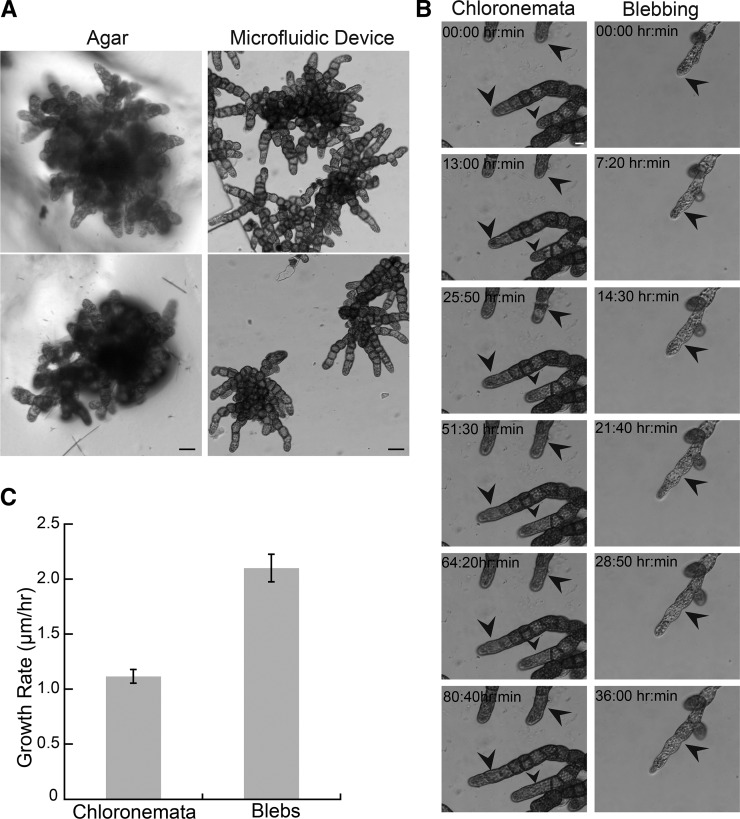
Key developmental processes that occur on the subcellular and cellular level or occur in occluded tissues are difficult to access, let alone image and analyze. Recently, culturing living samples within polydimethylsiloxane (PDMS) microfluidic devices has facilitated the study of hard-to-reach developmental events. Here, we show that an early diverging land plant, Physcomitrella patens, can be continuously cultured within PDMS microfluidic chambers. Because the PDMS chambers are bonded to a coverslip, it is possible to image P. patens development at high resolution over long time periods. Using PDMS chambers, we report that wild-type protonemal tissue grows at the same rate as previously reported for growth on solid medium. Using long-term imaging, we highlight key developmental events, demonstrate compatibility with high-resolution confocal microscopy, and obtain growth rates for a slow-growing mutant. By coupling the powerful genetic tools available to P. patens with long-term growth and imaging provided by PDMS microfluidic chambers, we demonstrate the capability to study cellular and subcellular developmental events in plants directly and in real time.


Figures

Figure 1.
Figure 1.
A schematic illustration of microfluidic growth chambers and their internal structure. A, Chambers have three regions: (1) central 45-µm-deep sector (within blue dashed circle), (2) growth chamber (between blue dashed circle and red dashed circle), and (3) flow control channels (outside the red dashed circle). The volumes associated with these are 0.57 µL, 1.36 µL, and 0.25 µL, respectively. Moss is seeded by injection into the center inlet and allowed to grow radially outward. Growth chambers used in these studies were 30 μm deep. The high diffusivity of oxygen in PDMS (34 × 106 cm2/s; Dendukuri et al., 2008) provided ample exchange with the environment to support growth. The elasticity of PDMS (2.5 MPa; Tan et al., 2003) was sufficient to provide barriers to growth that could not be deformed or penetrated by growing tissue. B, Image of a chamber next to a dime as a size reference. C, Image of a chamber mounted on an inverted microscope.
Figure 2.
Figure 2.
Wild-type tip-growing cells grow well in chambers. A, Chloronemata, caulonemata, and rhizoids grow well in microfluidic devices. Black arrows indicate start position at time 0. Scale bar, 10 µm. See Supplemental Movie S1. B, Quantification of protonemal and rhizoid growth rate. Error bars indicate se.
Figure 3.
Figure 3.
Protoplast regeneration in PDMS chambers. A, A plant regenerated from a protoplast, rebuilt its cell wall, and underwent several cell divisions within 9 d. The initial protoplast is outlined in a dashed black line. Scale bar, 50 µm. B, After protoplast regeneration medium was replaced with Hoagland medium in the microfluidic chamber, cells regenerated from a single protoplast (outlined in a dashed black line) were immediately imaged with bright-field on a wild-field microscope. The apical cell grew with normal morphology after 6 h. Multiple apical cells emerging from branches were observed after 15 h. Scale bar, 50 µm. See Supplemental Movie S2.
Figure 4.
Figure 4.
P. patens developmental events observed in microfluidic chambers. Wild-type moss protonemal tissue growing in microfluidic chambers was imaged with bright-field on a wild-field microscope. A, A wild-type caulonemal subapical cell (red arrowheads) transformed into a chloroplast-rich cell (blue arrowheads) after a day. Scale bar, 50 µm. See Supplemental Movie S3. B, Development of a bud initial from a single cell. Cell division events were clearly visible (red arrowheads). The formation of the tetrahedral meristem cell (yellow arrowheads) and the leaf initial (green arrowheads) were observed after 40 h. A rhizoid initiated from the lateral-basal cell (dark blue arrowhead). Scale bar, 20 µm. See Supplemental Movie S4. C, This particular rhizoid exploded (purple arrowhead), and a new rhizoid tip reinitiated from the remaining subapical cell after 15 h (light blue arrowhead). Scale bar, 50 µm. See Supplemental Movie S4.
Figure 5.
Figure 5.
Phyllid initiation and expansion during gametophore development. Wild-type moss protonemal tissue in microfluidic chambers was imaged with bright-field on a wild-field microscope. A, During early stages of phyllid initiation, cell division occurred every 4 to 6 h. Cell lineages were traced with different colors when cell boundaries were visible. Red lines indicate new cell divisions that were clearly observed. Scale bar, 20 µm. See Supplemental Movie S5. B, Gray dash lines outline an expanding phyllid. Five cells within this phyllid were traced with different colors over time. Cell expansion was clearly observed, while cell division was rarely seen. Blue arrowheads indicate a rhizoid emerging from the base of this gametophore. Scale bar, 50 µm. See Supplemental Movie S6. C, Cell expansion rates were measured from the five cells outlined in B. Area, cell length, and cell width of each cell were measured at 40, 48, 56, 64, and 72 h from the time-lapse acquisition. Color lines in this graph correspond to the cell with the same color in B. D, Even with confinement, bud initials were able to develop and expand three or four phyllids. Scale bar, 50 µm. See Supplemental Movie S7.
Figure 6.
Figure 6.
Microfluidic chambers are amenable to confocal microscopy. A, YFP targeted to the Golgi reveals a tip-focused accumulation of Golgi dictyosomes. mCherry targeted to the mitochondria. GFP targeted to the peroxisomes. GFP-GUS fusion targeted to the nucleus. Scale bar, 25 µm. B, A cell division event observed in a rhizoid emerging from the base of a gametophore. Moss tissue expressing Myo8A-GFP (green) and mCherry-tubulin (red) was imaged on a scanning confocal microscope. Images are maximum intensity projection of z-stacks from a time-series acquisition. Scale bar, 10 µm. See Supplemental Movie S8.
Figure 7.
Figure 7.
Functional drug flow-through experiments. A, Subapical cells expressing LifeAct-mRuby2 were imaged near the cortex with a scanning confocal microscope. Treatment with 25 µm (A) and 50 µm LatB (B) rapidly depolymerizes most actin filaments. Every 2 min, 30 s of no-delay acquisition was acquired for each cell (see Supplemental Movies S1–S11). A single image from each acquisition is shown. See Supplemental Movie S9. B, Tip growth in caulonemal and rhizoid cells was inhibited by 50 µm LatB. Approximately 1 mL of medium containing 50 µm LatB was injected into the PDMS chamber at time 0. Images were acquired every 10 min with bright-field on a wide-field microscope. Selected time points are shown. See Supplemental Movie S10.
Figure 8.
Figure 8.
Δbrk1 plants growing in microfluidic chambers. A, Comparison of ∆brk1 plants grown for 2 weeks on agar or in microfluidic chambers. Scale bar, 50 µm. B, left column, ∆brk1 chloronemata growing in microfluidic chamber; right column, Δbrk1 filament undergoing comparatively rapid growth. Black arrows indicate initial position of the apical cells throughout the series. Scale bar, 10 µm. See Supplemental Movie S11. C, Quantification of growth rates. Error bars are se.

References

    1. Bezanilla M, Pan A, Quatrano RS (2003) RNA interference in the moss Physcomitrella patens. Plant Physiol 133: 470–474 - PMC - PubMed
    1. Burke TA, Christensen JR, Barone E, Suarez C, Sirotkin V, Kovar DR (2014) Homeostatic actin cytoskeleton networks are regulated by assembly factor competition for monomers. Curr Biol 24: 579–585 - PMC - PubMed
    1. Clark RT, MacCurdy RB, Jung JK, Shaff JE, McCouch SR, Aneshansley DJ, Kochian LV (2011) Three-dimensional root phenotyping with a novel imaging and software platform. Plant Physiol 156: 455–465 - PMC - PubMed
    1. Dendukuri D, Panda P, Haghgooie R, Kim JM, Hatton TA, Doyle PS (2008) Modeling of oxygen-inhibited free radical photopolymerization in a PDMS microfluidic device. Macromolecules 41: 8547–8556
    1. Duffy DC, McDonald JC, Schueller OJ, Whitesides GM (1998) Rapid prototyping of microfluidic systems in poly(dimethylsiloxane). Anal Chem 70: 4974–4984 - PubMed

Publication types

MeSH terms

LinkOut - more resources