

The Effects of Hearing Impairment, Age, and Hearing Aids on the Use of Self-Motion for Determining Front/Back Location
- PMID: 27406664
- PMCID: PMC5096691
- DOI: 10.3766/jaaa.15101
The Effects of Hearing Impairment, Age, and Hearing Aids on the Use of Self-Motion for Determining Front/Back Location
Abstract
Background: There are two cues that listeners use to disambiguate the front/back location of a sound source: high-frequency spectral cues associated with the head and pinnae, and self-motion-related binaural cues. The use of these cues can be compromised in listeners with hearing impairment and users of hearing aids.
Purpose: To determine how age, hearing impairment, and the use of hearing aids affect a listener's ability to determine front from back based on both self-motion and spectral cues.
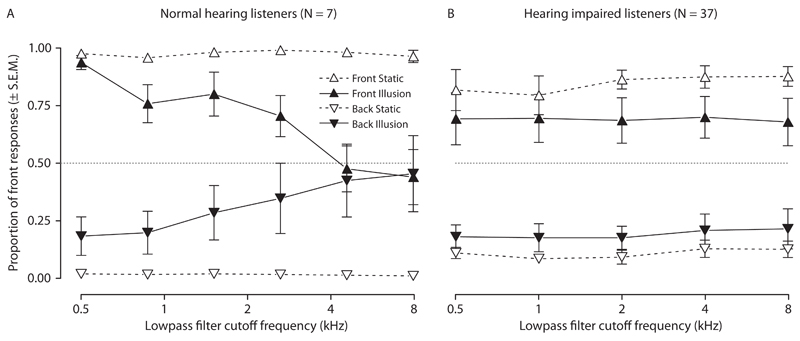
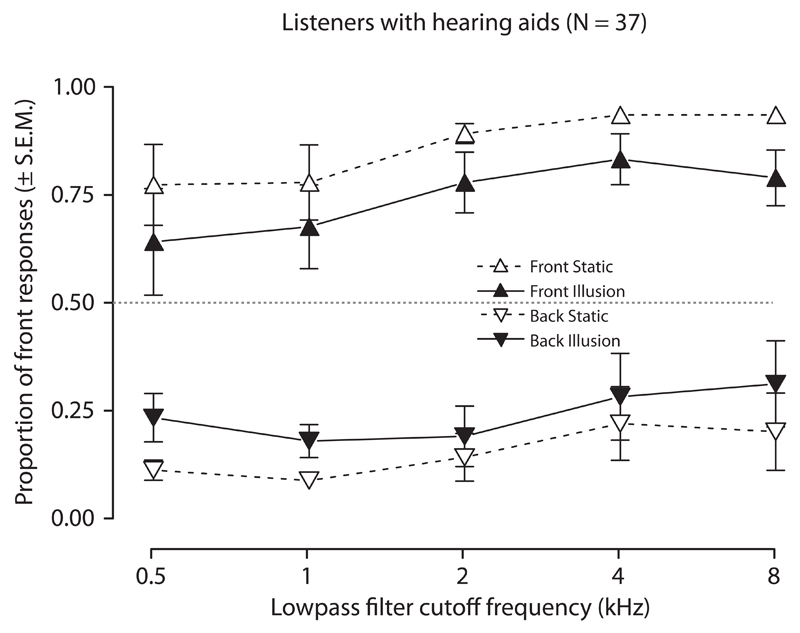
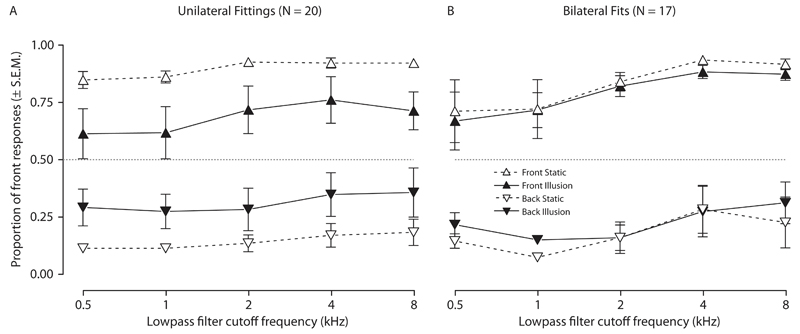
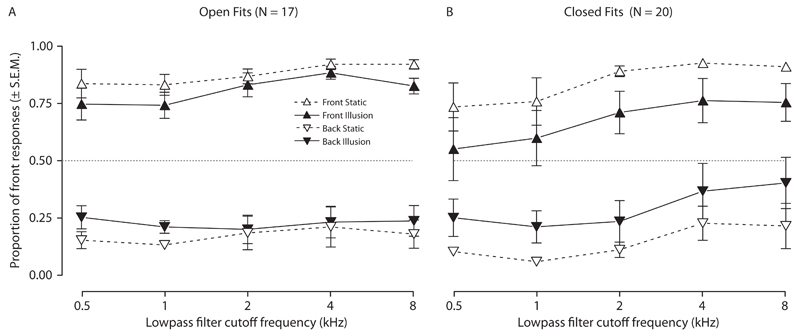
Research design: We used a previously published front/back illusion: signals whose physical source location is rotated around the head at twice the angular rate of the listener's head movements are perceptually located in the opposite hemifield from where they physically are. In normal-hearing listeners, the strength of this illusion decreases as a function of low-pass filter cutoff frequency, this is the result of a conflict between spectral cues and dynamic binaural cues for sound source location. The illusion was used as an assay of self-motion processing in listeners with hearing impairment and users of hearing aids.
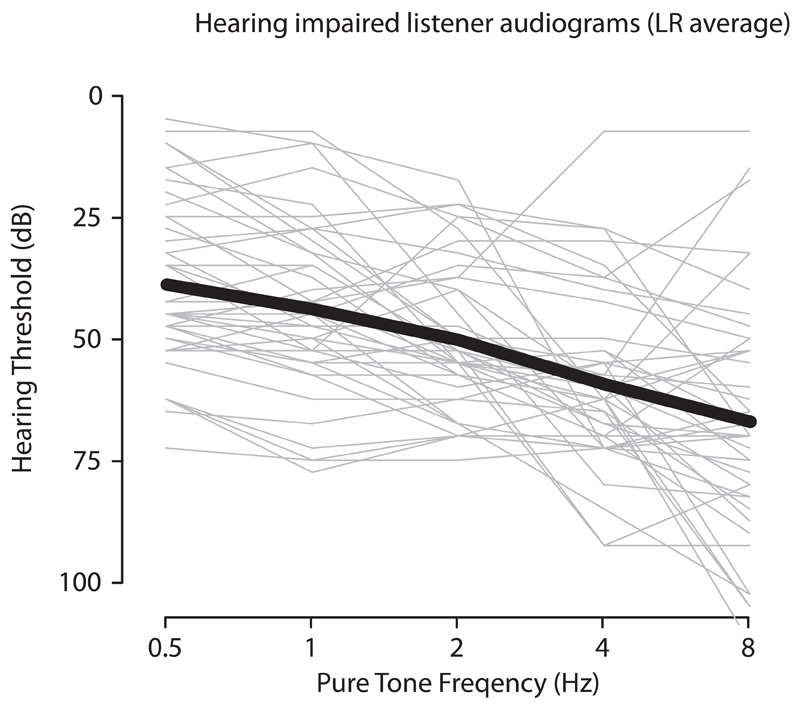
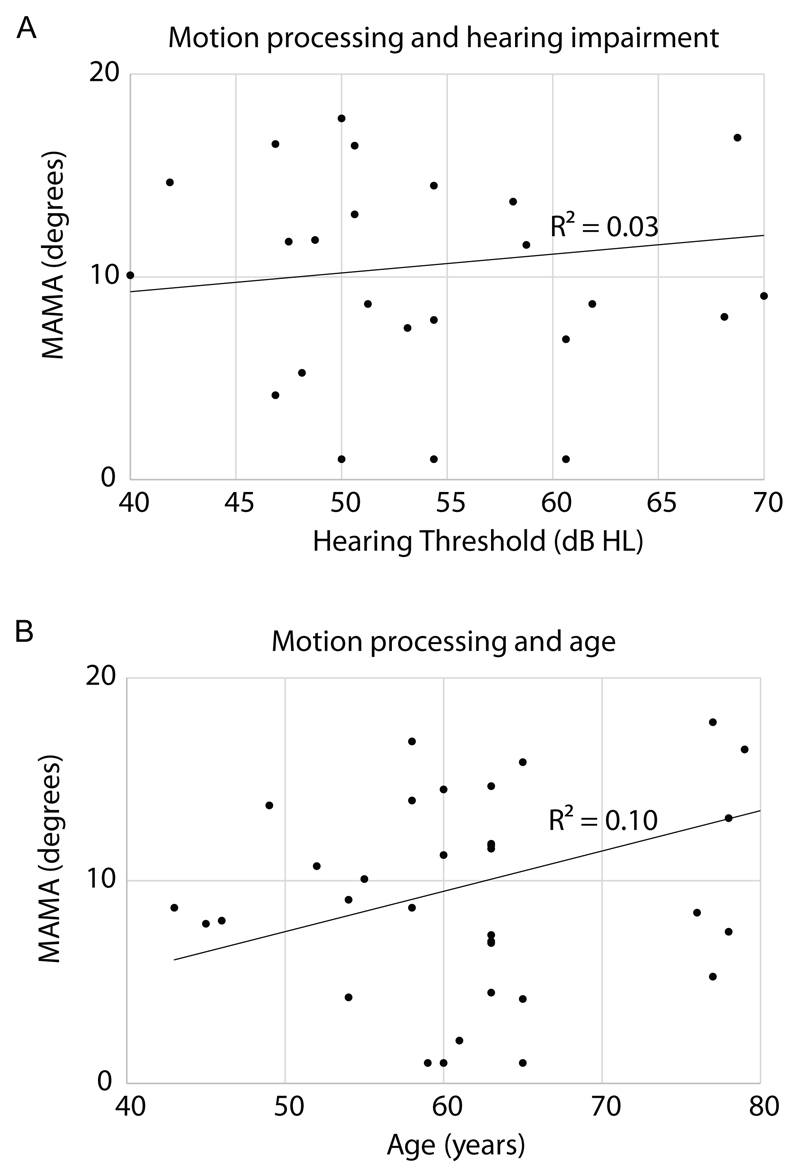
Study sample: We recruited 40 hearing-impaired participants, with an average age of 62 yr. The data for three listeners were discarded because they did not move their heads enough during the experiment.
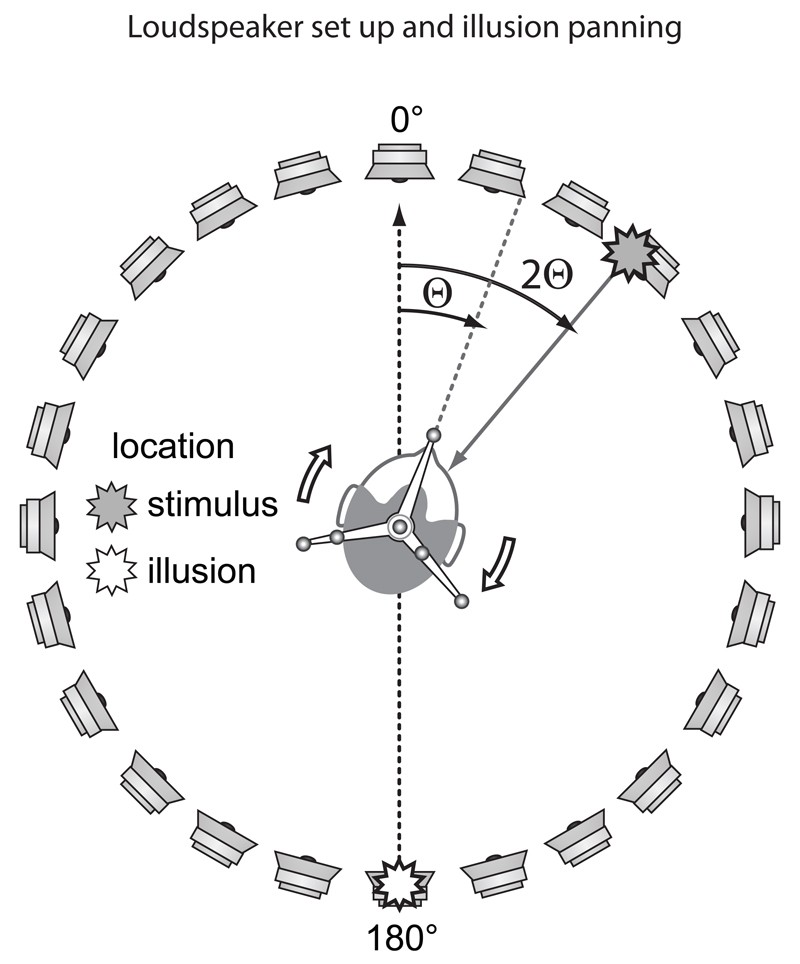
Data collection and analysis: Listeners sat at the center of a ring of 24 loudspeakers, turned their heads back and forth, and used a wireless keypad to report the front/back location of statically presented signals and of dynamically moving signals with illusory locations. Front/back accuracy for static signals, the strength of front/back illusions, and minimum audible movement angle were measured for each listener in each condition. All measurements were made in each listener both aided and unaided.
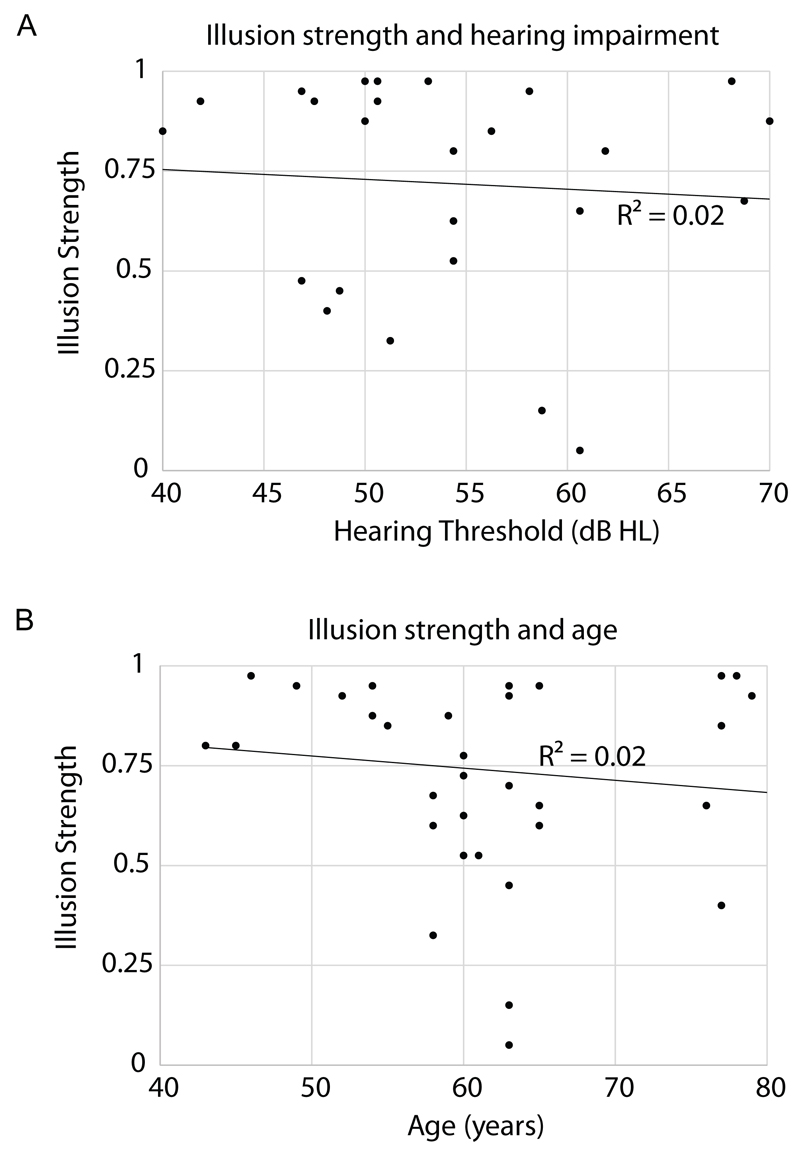
Results: Hearing-impaired listeners were less accurate at front/back discrimination for both static and illusory conditions. Neither static nor illusory conditions were affected by high-frequency content. Hearing aids had heterogeneous effects from listener to listener, but independent of other factors, on average, listeners wearing aids exhibited a spectrally dependent increase in "front" responses: the more high-frequency energy in the signal, the more likely they were to report it as coming from the front.
Conclusions: Hearing impairment was associated with a decrease in the accuracy of self-motion processing for both static and moving signals. Hearing aids may not always reproduce dynamic self-motion-related cues with sufficient fidelity to allow reliable front/back discrimination.
American Academy of Audiology.
Figures
References
-
- Abel SM, Giguere C, Consoli A, Papsin BC. The effect of aging on horizontal plane sound localization. J Acoust Soc Am. 2000;108:743–52. - PubMed
-
- Akeroyd MA, Whitmer WM. Spatial Hearing and Hearing Aids. In: Moore BCJ, Popelka GR, editors. Springer Handbook of Auditory Research: Hearing Aids. Springer-Verlag; New York: in press.
-
- Angell JR, Fite W. The Monaural Localization of Sounds. Psychol Rev. 1901;8:225–246.
-
- Best V, Kalluri S, McLachlan S, Valentine S, Edwards B, Carlile S. A comparison of CIC and BTE hearing aids for three-dimensional localization of speech. Int J Audiol. 2010;49:723–732. - PubMed
MeSH terms
Grants and funding
LinkOut - more resources
Full Text Sources
Other Literature Sources
Medical
Research Materials