

Diagnosis of Thin-Capped Fibroatheromas in Intravascular Optical Coherence Tomography Images: Effects of Light Scattering
- PMID: 27406987
- PMCID: PMC4946571
- DOI: 10.1161/CIRCINTERVENTIONS.115.003163
Diagnosis of Thin-Capped Fibroatheromas in Intravascular Optical Coherence Tomography Images: Effects of Light Scattering
Abstract
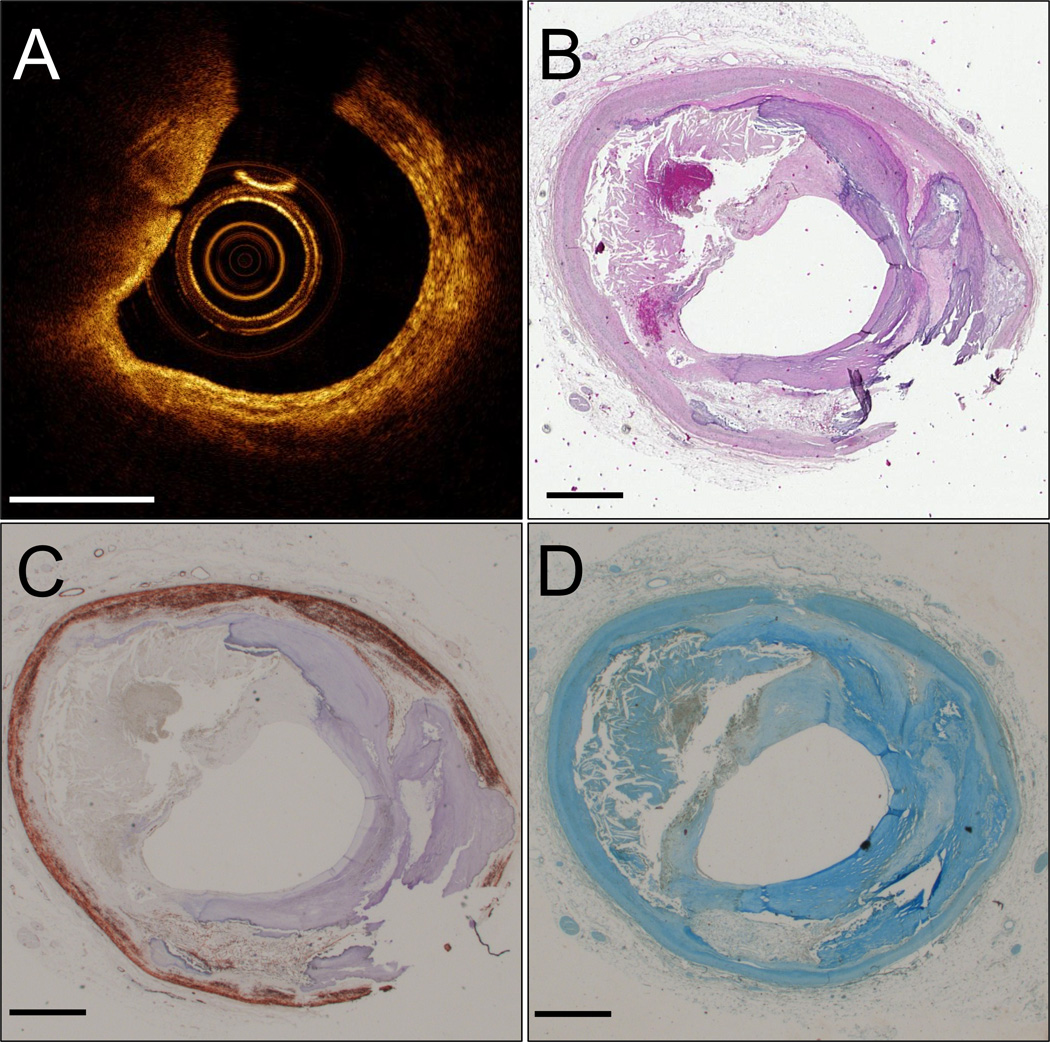
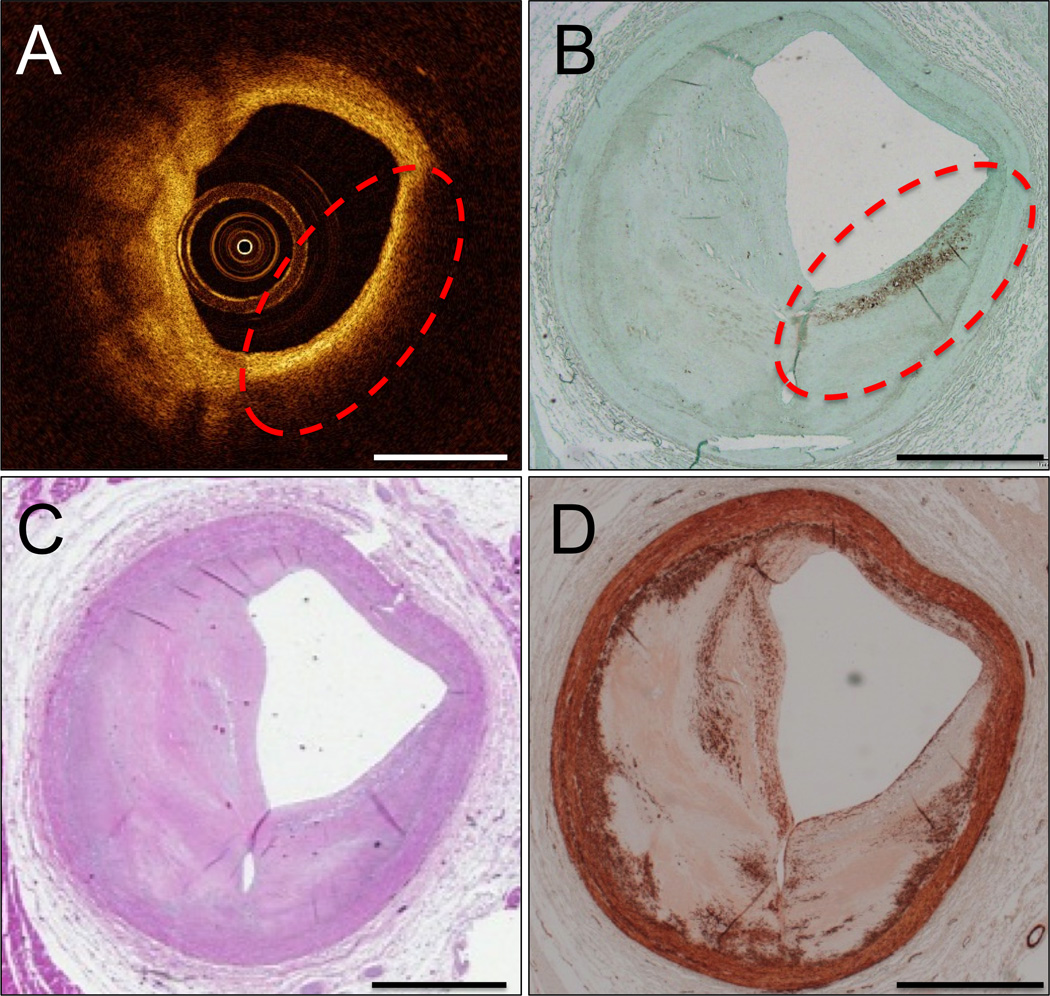
Background: Intravascular optical coherence tomography (IVOCT) images are recorded by detecting light backscattered within coronary arteries. We hypothesize that non-thin-capped fibroatheroma (TCFA) causes may scatter light to create the false appearance of IVOCT TCFA.
Methods and results: Ten human cadaver hearts were imaged with IVOCT (n=14 coronary arteries). IVOCT and histological TCFA images were coregistered and compared. Of 21 IVOCT TCFAs (fibrous cap <65 μm, lipid arc >1 quadrant), only 8 were true histological TCFA. Foam cell infiltration was responsible for 70% of false IVOCT TCFA and caused both thick-capped fibroatheromas to appear as TCFA, and the appearance of TCFAs when no lipid core was present. Other false IVOCT TCFA causes included smooth muscle cell-rich fibrous tissue (12%) and loose connective tissue (9%). If the lipid arc >1 quadrant (obtuse) criterion was disregarded, 45 IVOCT TCFAs were identified, and sensitivity of IVOCT TCFA detection increased from 63% to 87%, and specificity remained high at 92%.
Conclusions: We demonstrate that IVOCT can exhibit 87% (95% CI, 75%-93%) sensitivity and 92% specificity (95% CI, 86%-96%) to detect all lipid arcs (both obtuse and acute, <1 quadrant) TCFA, and we also propose new mechanisms involving light scattering that explain why other plaque components can masquerade as TCFA and cause low positive predictive value of IVOCT for TCFA detection (47% for obtuse lipid arcs). Disregarding the lipid arc >1 quadrant requirement enhances the ability of IVOCT to detect TCFA.
Keywords: atherosclerosis; lipids; myocytes, smooth muscle; plaque, amyloid; tomography, optical coherence.
© 2016 American Heart Association, Inc.
Figures


Comment in
-
Understanding Why and When Optical Coherence Tomography Does Not Detect Vulnerable Plaques: Is It Important?Circ Cardiovasc Interv. 2016 Jul;9(7):e004144. doi: 10.1161/CIRCINTERVENTIONS.116.004144. Circ Cardiovasc Interv. 2016. PMID: 27406991 No abstract available.
Similar articles
-
Elevated levels of systemic pentraxin 3 are associated with thin-cap fibroatheroma in coronary culprit lesions: assessment by optical coherence tomography and intravascular ultrasound.JACC Cardiovasc Interv. 2013 Sep;6(9):945-54. doi: 10.1016/j.jcin.2013.04.024. Epub 2013 Aug 14. JACC Cardiovasc Interv. 2013. PMID: 23954061
-
Automated analysis of fibrous cap in intravascular optical coherence tomography images of coronary arteries.Sci Rep. 2022 Dec 12;12(1):21454. doi: 10.1038/s41598-022-24884-1. Sci Rep. 2022. PMID: 36509806 Free PMC article.
-
Additive Value of Integrated Backscatter IVUS for Detection of Vulnerable Plaque by Optical Frequency Domain Imaging: An Ex Vivo Autopsy Study of Human Coronary Arteries.JACC Cardiovasc Imaging. 2016 Feb;9(2):163-72. doi: 10.1016/j.jcmg.2015.07.011. Epub 2016 Jan 6. JACC Cardiovasc Imaging. 2016. PMID: 26777223
-
Consensus standards for acquisition, measurement, and reporting of intravascular optical coherence tomography studies: a report from the International Working Group for Intravascular Optical Coherence Tomography Standardization and Validation.J Am Coll Cardiol. 2012 Mar 20;59(12):1058-72. doi: 10.1016/j.jacc.2011.09.079. J Am Coll Cardiol. 2012. PMID: 22421299
-
Pathophysiology of acute coronary syndrome assessed by optical coherence tomography.J Cardiol. 2010 Jul;56(1):8-14. doi: 10.1016/j.jjcc.2010.05.005. Epub 2010 Jun 15. J Cardiol. 2010. PMID: 20554431 Review.
Cited by
-
Comprehensive Assessment of High-Risk Plaques by Dual-Modal Imaging Catheter in Coronary Artery.JACC Basic Transl Sci. 2021 Dec 27;6(12):948-960. doi: 10.1016/j.jacbts.2021.10.005. eCollection 2021 Dec. JACC Basic Transl Sci. 2021. PMID: 35024500 Free PMC article.
-
Intravascular Polarimetry: Clinical Translation and Future Applications of Catheter-Based Polarization Sensitive Optical Frequency Domain Imaging.Front Cardiovasc Med. 2020 Aug 28;7:146. doi: 10.3389/fcvm.2020.00146. eCollection 2020. Front Cardiovasc Med. 2020. PMID: 33005632 Free PMC article. Review.
-
Intracoronary optical coherence tomography: state of the art and future directions.EuroIntervention. 2021 Jun 11;17(2):e105-e123. doi: 10.4244/EIJ-D-21-00089. EuroIntervention. 2021. PMID: 34110288 Free PMC article.
-
Transient-mode photothermal optical coherence tomography.Opt Lett. 2021 Nov 15;46(22):5703-5706. doi: 10.1364/OL.443987. Opt Lett. 2021. PMID: 34780441 Free PMC article.
-
Intracoronary Structural-Molecular Imaging for Multitargeted Characterization of High-Risk Plaque: First-in-Human OCT-FLIm.JAMA Cardiol. 2025 Jul 1;10(7):708-717. doi: 10.1001/jamacardio.2025.0928. JAMA Cardiol. 2025. PMID: 40332864 Free PMC article.
References
-
- Narula J, Nakano M, Virmani R, Kolodgie FD, Petersen R, Newcomb R, Malik S, Fuster V, Finn AV. Histopathologic characteristics of atherosclerotic coronary disease and implications of the findings for the invasive and noninvasive detection of vulnerable plaques. J Am Coll Cardiol. 2013;61:1041–1051. - PMC - PubMed
-
- Virmani R, Burke AP, Farb A, Kolodgie FD. Pathology of the vulnerable plaque. J Am Coll Cardiol. 2006;47:C13–C18. - PubMed
-
- Tearney GJ, Regar E, Akasaka T, Adriaenssens T, Barlis P, Bezerra HG, Bouma B, Bruining N, Cho JM, Chowdhary S, Costa MA, de Silva R, Dijkstra J, Di Mario C, Dudek D, Falk E, Feldman MD, Fitzgerald P, Garcia-Garcia HM, Gonzalo N, Granada JF, Guagliumi G, Holm NR, Honda Y, Ikeno F, Kawasaki M, Kochman J, Koltowski L, Kubo T, Kume T, Kyono H, Lam CC, Lamouche G, Lee DP, Leon MB, Maehara A, Manfrini O, Mintz GS, Mizuno K, Morel MA, Nadkarni S, Okura H, Otake H, Pietrasik A, Prati F, Raber L, Radu MD, Rieber J, Riga M, Rollins A, Rosenberg M, Sirbu V, Serruys PW, Shimada K, Shinke T, Shite J, Siegel E, Sonoda S, Suter M, Takarada S, Tanaka A, Terashima M, Thim T, Uemura S, Ughi GJ, van Beusekom HM, van der Steen AF, van Es GA, van Soest G, Virmani R, Waxman S, Weissman NJ, Weisz G. Consensus standards for acquisition, measurement, and reporting of intravascular optical coherence tomography studies: a report from the International Working Group for Intravascular Optical Coherence Tomography Standardization and Validation. J Am Coll Cardiology. 2012;59:1058–1072. - PubMed
-
- Kubo T, Imanishi T, Takarada S, Kuroi A, Ueno S, Yamano T, Tanimoto T, Matsuo Y, Masho T, Kitabata H, Tsuda K, Tomobuchi Y, Akasaka T. Assessment of culprit lesion morphology in acute myocardial infarction: ability of optical coherence tomography compared with intravascular ultrasound and coronary angioscopy. J Am Coll Cardiol. 2007;50:933–939. - PubMed
Publication types
MeSH terms
Grants and funding
LinkOut - more resources
Full Text Sources
Other Literature Sources
Miscellaneous
