

Trajectories of Stress, Depressive Symptoms, and Immunity in Cancer Survivors: Diagnosis to 5 Years
- PMID: 27407091
- PMCID: PMC5217183
- DOI: 10.1158/1078-0432.CCR-16-0574
Trajectories of Stress, Depressive Symptoms, and Immunity in Cancer Survivors: Diagnosis to 5 Years
Abstract
Purpose: Five-year disease endpoint trajectories are available for every cancer site. In contrast, there are few longitudinal, biobehavioral studies of survivors extending beyond the first or second year following diagnosis. This gap is addressed with stress, depressive symptom, and immunity data from breast cancer patients followed continuously for 5 years.
Experimental design: Women (N = 113) diagnosed and surgically treated for breast cancer and awaiting adjuvant therapy completed self-report measures of stress and depressive symptoms and provided blood for immune assays [natural killer cell cytotoxicity (NKCC) and T-cell blastogenesis]. Assessments (N = 12) were repeated every 4 to 6 months for 5 years.
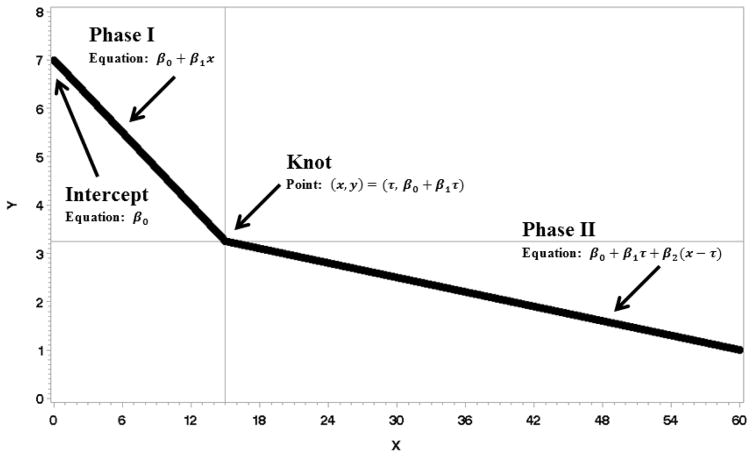
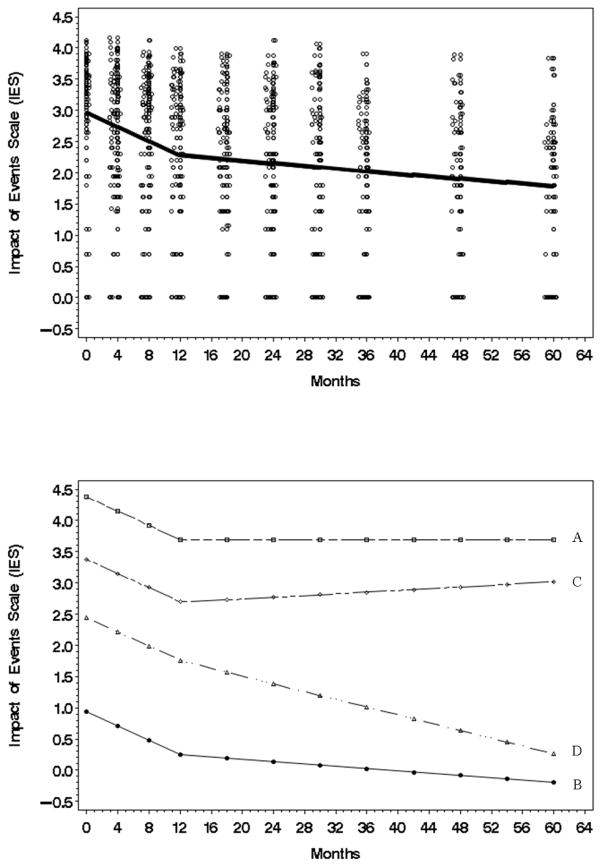
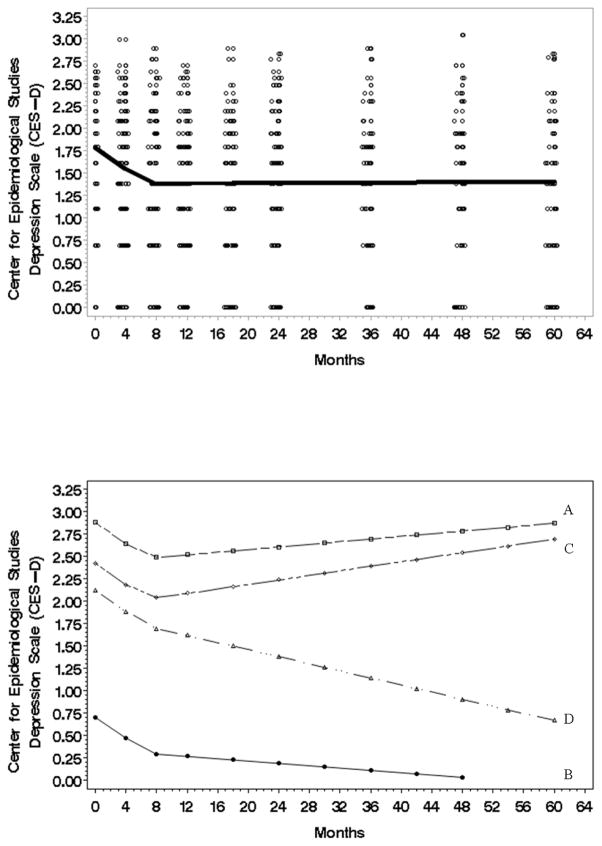
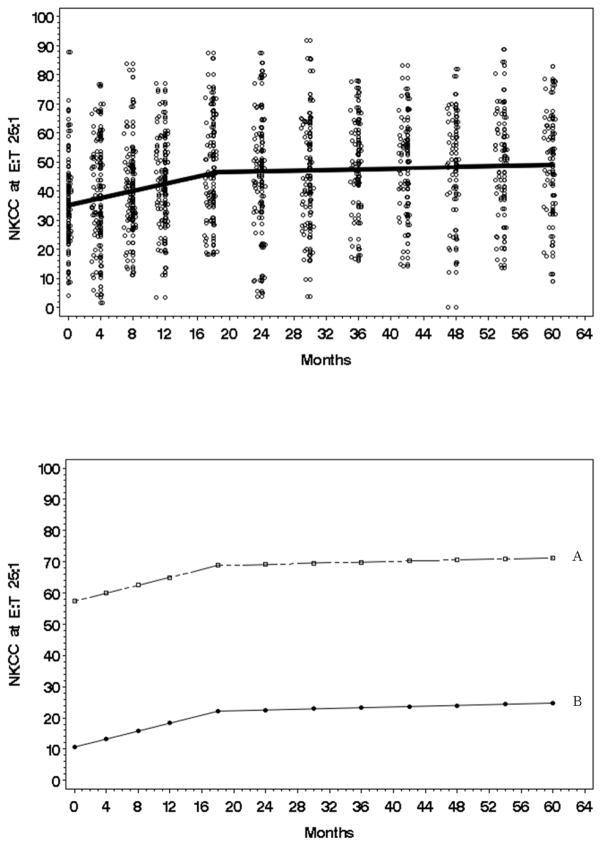
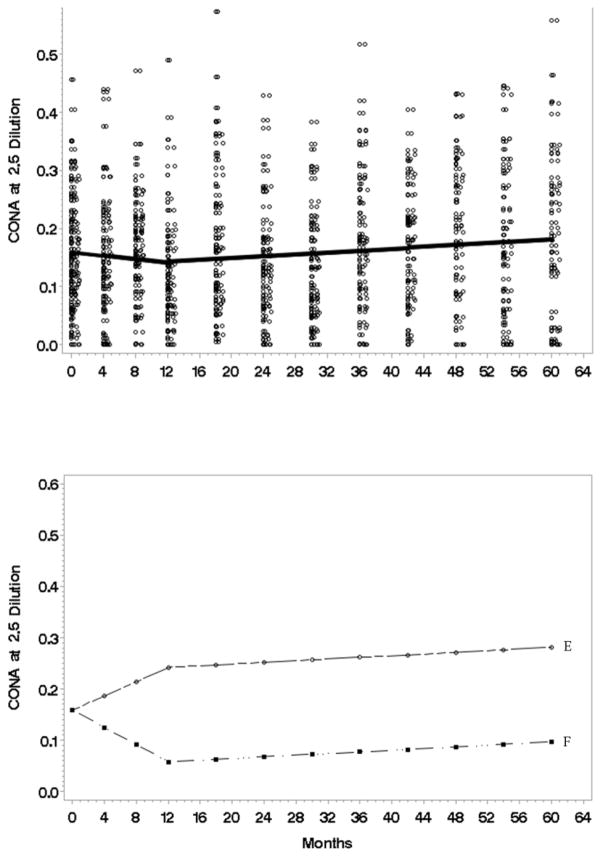
Results: Multiphase linear mixed models show phases of change and identified specific time points of change. Cancer stress shows two distinct phases of decline, with the change point being 12 months. In contrast, a steep decline in depressive symptoms occurs by 7 months, with stable, low levels thereafter. NKCC shows a steady upward trajectory through 18 months and upper limit stability thereafter, whereas there was no reliable trajectory for T-cell blastogenesis.
Conclusions: For the first time, trajectories and specific time points of change in biobehavioral data for breast cancer survivors are provided, traced through 5 years. Following diagnosis, the breast survivor experience is one of a co-occurrence of change (recovery) in psychologic and innate immunity markers from diagnosis to18 months, and a pattern of stability (depression, NKCC) or continued improvement (stress) through year 5. These data provide new directions for survivorship care and detail of the biobehavioral trajectory. Clin Cancer Res; 23(1); 52-61. ©2016 AACR.
©2016 American Association for Cancer Research.
Conflict of interest statement
The authors have no conflicts of interest to disclose. This manuscript contains original work that is not currently being considered for publication elsewhere.
Figures
References
-
- Reiche EV, Nunes SV, Morimoto H. Stress, depression, the immune system, and cancer. Lancet Oncol. 2004 Oct;5(10):617–25. - PubMed
-
- Hewitt M, Greenfield S, Stovall E. From cancer patient to cancer survivor: Lost in transition. Washington, D.C: National Academies Press; 2005.
MeSH terms
Grants and funding
LinkOut - more resources
Full Text Sources
Other Literature Sources
Medical
Miscellaneous
