. 2016 Sep 15;143(18):3306-14.
doi: 10.1242/dev.135038. Epub 2016 Jul 12.

An ancestral stomatal patterning module revealed in the non-vascular land plant Physcomitrella patens

Affiliations

An ancestral stomatal patterning module revealed in the non-vascular land plant Physcomitrella patens

Robert S Caine et al. Development. .

Abstract

The patterning of stomata plays a vital role in plant development and has emerged as a paradigm for the role of peptide signals in the spatial control of cellular differentiation. Research in Arabidopsis has identified a series of epidermal patterning factors (EPFs), which interact with an array of membrane-localised receptors and associated proteins (encoded by ERECTA and TMM genes) to control stomatal density and distribution. However, although it is well-established that stomata arose very early in the evolution of land plants, until now it has been unclear whether the established angiosperm stomatal patterning system represented by the EPF/TMM/ERECTA module reflects a conserved, universal mechanism in the plant kingdom. Here, we use molecular genetics to show that the moss Physcomitrella patens has conserved homologues of angiosperm EPF, TMM and at least one ERECTA gene that function together to permit the correct patterning of stomata and that, moreover, elements of the module retain function when transferred to Arabidopsis Our data characterise the stomatal patterning system in an evolutionarily distinct branch of plants and support the hypothesis that the EPF/TMM/ERECTA module represents an ancient patterning system.

Keywords: Evolution; Patterning; Peptide signalling; Stomata.


Conflict of interest statement

The authors declare no competing or financial interests.

Figures
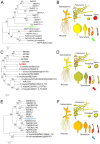
Fig. 1.
Fig. 1.
Phylogeny and expression profiles of stomatal patterning genes in Physcomitrella patens. (A,C,E) Phylogenetic trees constructed using amino acid sequences of selected Arabidopsis EPF1 (A), TMM (C) and ERECTA (E) gene family members based on Phytozome V11 (Goodstein et al., 2012), using the neighbour-joining method (Saitou and Nei, 1987; Takata et al., 2013) on MEGA6 (Tamura et al., 2013). The percentage of replicate trees in which the associated taxa clustered together in the bootstrap test (1000 replicates) are shown next to the branches (Felsenstein, 1985). Amino acid sequences from P. patens (Pp), Selaginella moellendorffii (Sm), Zea mays (Zm), Symphytum tuberosum (St), Medicago truncatula (Mt) and A. thaliana (At) were used to generate trees, except for ERECTA, for which S. moellendorffii and S. tuberosum gene family members were omitted, owing to the large overall number of genes in the ERECTA family. For complete analyses of all three gene families, see Fig. S1. (B,D,F) Expression profiles of PpEPF1 (B), PpTMM (D) and PpERECTA1 (F) based on microarray data taken from the P. patens eFP browser (Ortiz-Ramírez et al., 2016; Winter et al., 2007) for spore, protoplast, protonemal, gametophyte and sporophyte tissue. Red indicates a relatively high transcript level, with the arrows highlighting phases of sporophyte development when the respective genes appear to be relatively highly expressed. For the expression profiles of other PpERECTA gene family members, see Fig. S2.
Fig. 2.
Fig. 2.
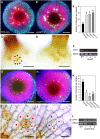
EPF function is conserved in Physcomitrella patens. (A,B) Fluorescence images of the base of the sporophyte from WT (A) and ppepf1-2 (B) plants. Stomata (bright white fluorescence) are spaced around the base in a ring with an increased number in ppepf1-2. (C,D) Bright-field lateral views of the sporophyte base from WT (C) and ppepf1-2 (D) plants. In WT, stomata are surrounded by epidermal cells (red dots) whereas in ppepf1-2 stomata occur in clusters. (E) Number of stomata per capsule in WT and three ppepf1 mutant lines. Lines indicated with different letters can be distinguished from each other (P<0.001; one-way ANOVA with multiple comparisons corrected using a Dunnett's test; n=7). (F) RT-PCR analysis of the WT and transgenic lines shown in E with expression of PpEPF (upper panel) and a PpRBCS control (lower panel). (G,H) Fluorescence images of the base of the sporophyte from WT (G) and PpEPF1OE (H) plants. Fewer stomata are visible in the PpEPF1OE sporophyte. (I,J) Bright-field lateral views of the sporophyte base from WT (I) and PpEPF1OE (J) plants with a possible stomatal precursor (yellow dot) indicated. (K) Number of stomata per capsule in WT and three PpEPFOE mutant lines. Lines indicated with different letters can be distinguished from each other (P<0.001; one-way ANOVA with multiple comparisons corrected using a Dunnett's test; n=8). (L) RT-PCR analysis of the WT and transgenic lines shown in K with expression of PpEPF1 (upper panel) and PpRBCS control (lower panel) transcripts. Error bars indicate s.e.m. Scale bars: 100 µm (A,B,G,H); 50 µm (C,D); 25 µm (I,J).
Fig. 3.
Fig. 3.
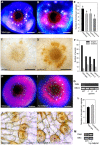
TMM functions in stomatal patterning in Physcomitrella patens. (A,B) Fluorescence images of the base of the sporophyte from WT (A) and pptmm-1 (B) plants. The pattern of stomata (bright white fluorescence) is disrupted in the pptmm-1 mutant. (C,D) Bright-field lateral views of the sporophyte base from two transgenic lines: pptmm-3 (C) and pptmm-2 (D). The number and patterning of stomata varies from plant to plant in each of the three independent pptmm lines. (E) Number of stomata per capsule in WT and three pptmm mutant lines. Lines indicated with different letters can be distinguished from each other (P<0.05; one-way ANOVA with multiple comparisons corrected using a Dunnett's test; n>6). (F) Percentage of stomata in clusters in the lines shown in E. (G) RT-PCR analysis of the WT and transgenic lines shown in E with expression of PpTMM (upper panel) and PpRBCS control (lower panel) transcripts. (H,I) Fluorescence images of the base of the sporophyte of WT (H) and PpTMMOE (I) plants. (J,K) Bright-field lateral views of the sporophyte base from WT (J) and PpTMMOE (K) plants. (L) Number of stomata per capsule in WT and PpTMMOE line. No significant difference (P<0.05) was found between the lines (one-way ANOVA with multiple comparisons corrected using a Dunnett's test; n=8). (M) RT-PCR analysis of the WT and transgenic line shown in L with expression of PpTMM (upper panel) and PpRBCS control (lower panel) transcripts. Error bars indicate s.e.m. Scale bars: 100 µm (A,B,H,I); 50 µm (C,D); 25 µm (J,K).
Fig. 4.
Fig. 4.
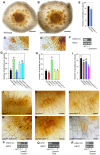
Epistasis between PpEPF1, PpTMM and PpERECTA1 supports a concerted role in stomatal patterning. (A,B) Bright-field images of the base of the sporophyte from WT (A) and pperecta1-1 (B) plants. (C,D) Bright-field lateral views of the sporophyte base from WT (C) and pperecta1-1 (D) plants. (E) Number of stomata per capsule in WT and a pperecta1-1 mutant line. No significant difference (P<0.05) was found between the lines (one-way ANOVA with multiple comparisons corrected using a Dunnett's test; n=8). (F) RT-PCR analysis of WT and pperecta1-1 with expression of PpERECTA1 (upper panel) and PpRBCS control (lower panel) transcripts. (G-I) Number of stomata per capsule in ppepf1-erecta1 (G), pptmm-epf1 (H) and pptmm-pperecta1 (I) double mutants. Within each panel, lines indicated with different letters can be distinguished from each other (P<0.05; one-way ANOVA with multiple comparisons corrected using a Tukey test; n=8). (J-O) Bright-field lateral views of the base of sporophytes from ppepf1 (J), pptmm (K), pperecta1 (L), ppepf1-erecta1-2 (M), pptmm-epf1-1 (N) and pptmm-erecta1-1 (O) lines. (P-R) RT-PCR analysis of the mutant lines shown in M-O with the upper panel showing the transcript detection for PpERECTA1 (P,R) or PpEPF1 (Q), as indicated. Lower panel in each case indicates transcript detection for a PpRBCS control. Error bars in E,G-I indicate s.e.m. Scale bars: 100 µm (A,B); 25 µm (C,D,J-O).
Fig. 5.
Fig. 5.
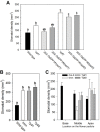
PpEPF1 and PpTMM can partially rescue Arabidopsis stomatal density phenotypes. (A) Stomatal density in leaves in a series of lines of Arabidopsis thaliana either lacking AtEPF1 (epf1) or AtEPF2 (epf2) and overexpressing the PpEPF1 sequence (35S::PpEPF1). Stomatal density in WT leaves is shown as a control. (B) As in A but for two lines of the Arabidopsis tmm mutant complemented with the PpTMM sequence under control of the native AtTMM promoter (Tp). In A and B, lines indicated with different letters can be distinguished from each other [P<0.05; one-way ANOVA with multiple comparisons corrected using a Tukey test; n=6 (A), n=8 (B)]. (C) As in B but for the phenotype observed in base, middle or apex of the flower pedicel (as indicated). Error bars=s.e.m.

Similar articles

Cited by

References

    1. Abrash E. B. and Bergmann D. C. (2010). Regional specification of stomatal production by the putative ligand CHALLAH. Development 137, 447-455. 10.1242/dev.040931 - DOI - PubMed
    1. Abrash E. B., Davies K. A. and Bergmann D. C. (2011). Generation of signaling specificity in arabidopsis by spatially restricted buffering of ligand-receptor interactions. Plant Cell 23, 2864-2879. 10.1105/tpc.111.086637 - DOI - PMC - PubMed
    1. Beerling D. J. (2007). The Emerald Planet: How Plants Changed Earth's History. Oxford: Oxford University Press.
    1. Berry J. A., Beerling D. J. and Franks P. J. (2010). Stomata: key players in the earth system, past and present. Curr. Opin. Plant Biol. 13, 232-249. 10.1016/j.pbi.2010.04.013 - DOI - PubMed
    1. Bhave N. S., Veley K. M., Nadeau J. A., Lucas J. R., Bhave S. L. and Sack F. D. (2009). TOO MANY MOUTHS promotes cell fate progression in stomatal development of Arabidopsis stems. Planta 229, 357-367. 10.1007/s00425-008-0835-9 - DOI - PubMed

Publication types

MeSH terms