. 2016 Oct 14;44(18):8786-8798.
doi: 10.1093/nar/gkw626. Epub 2016 Jul 12.

DDK dependent regulation of TOP2A at centromeres revealed by a chemical genetics approach

Affiliations

DDK dependent regulation of TOP2A at centromeres revealed by a chemical genetics approach

Kevin Z L Wu et al. Nucleic Acids Res. .

Abstract

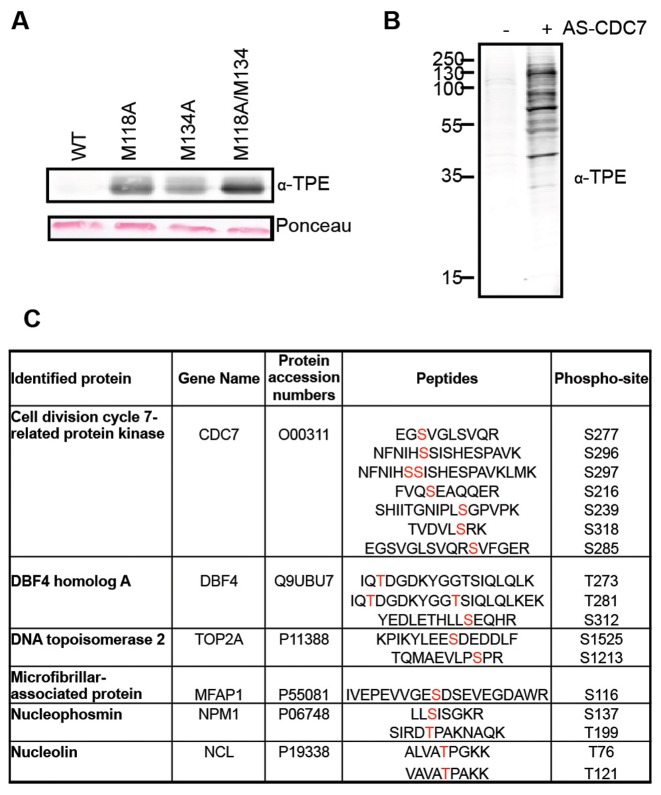
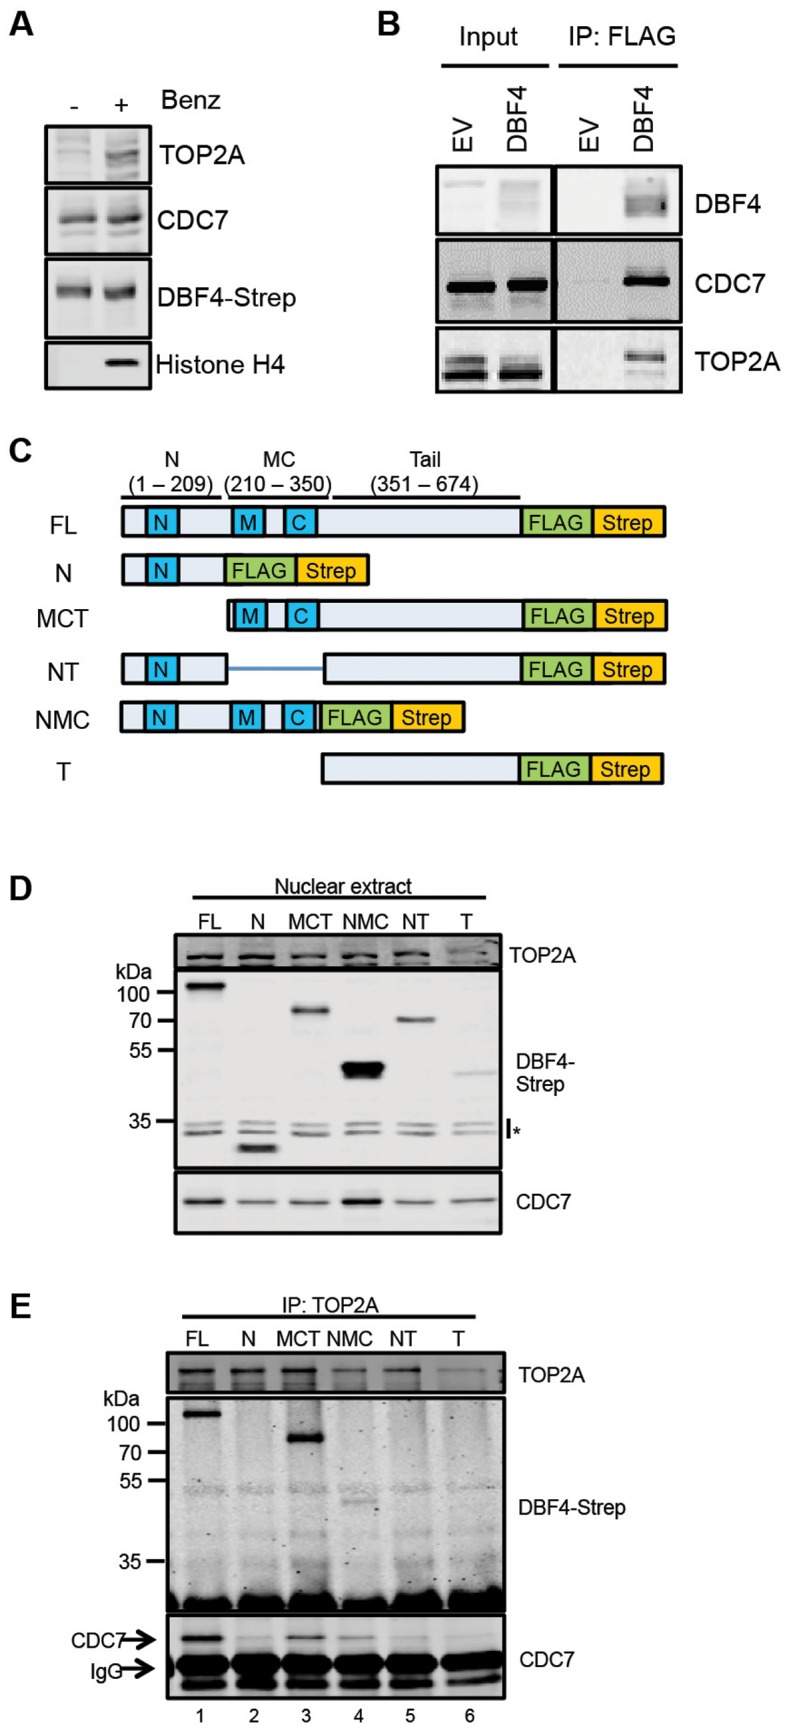
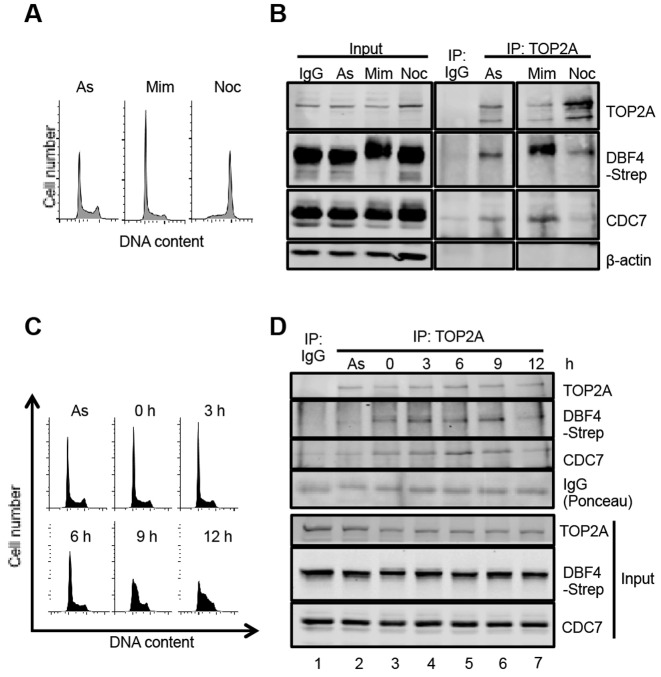
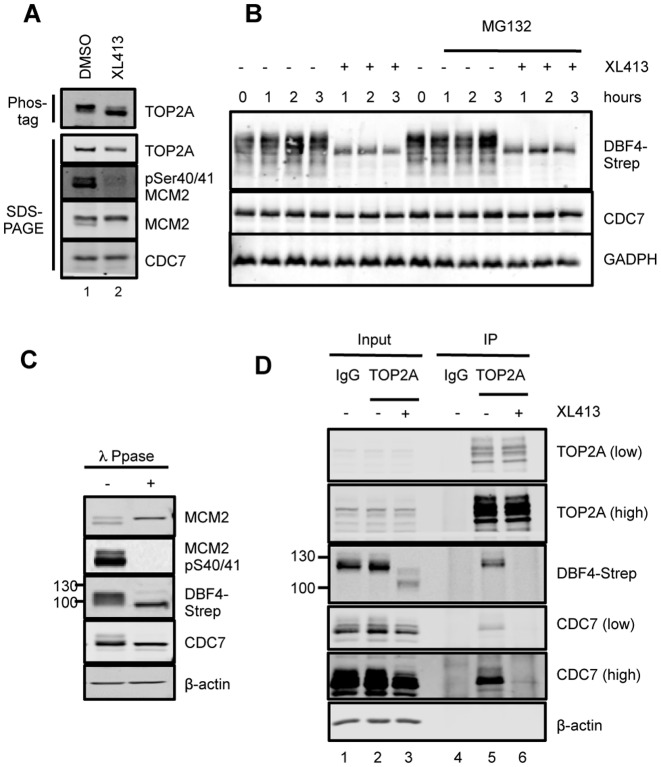
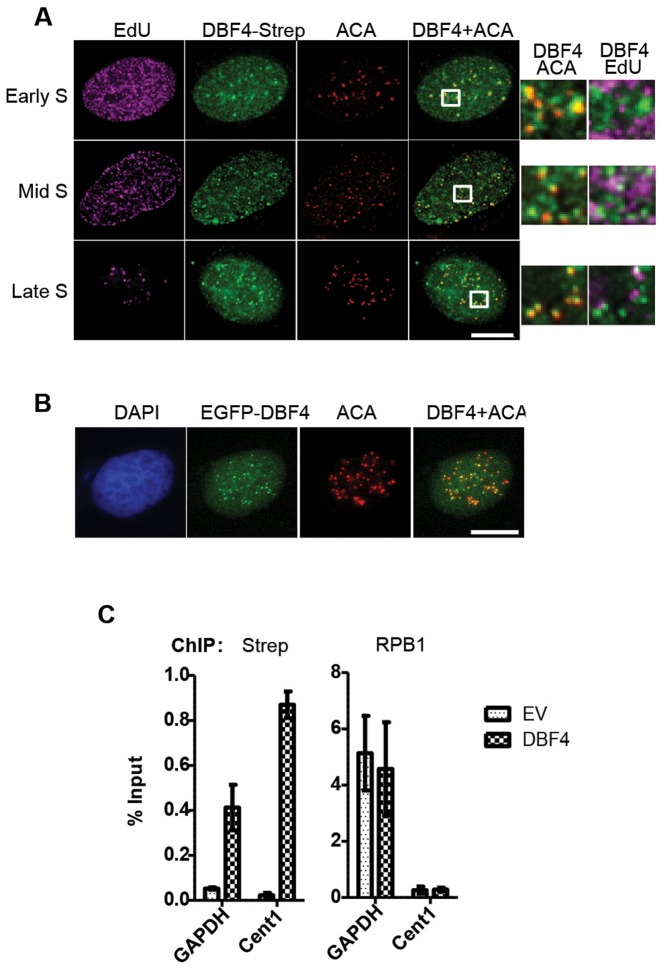
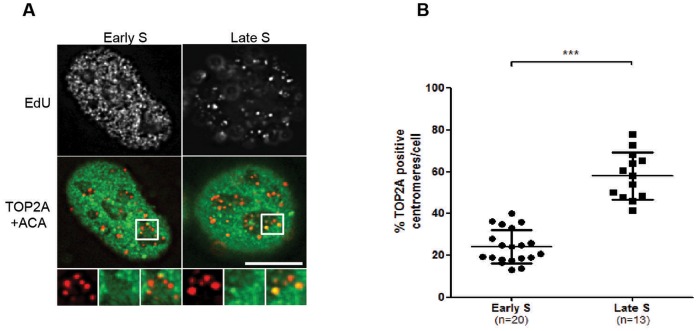
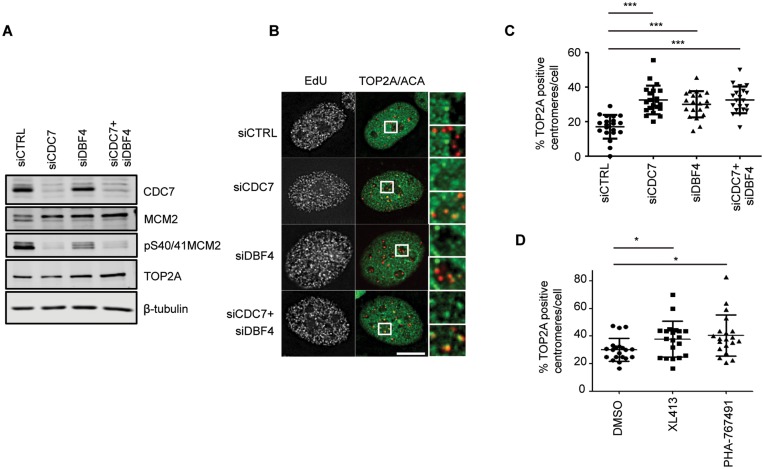
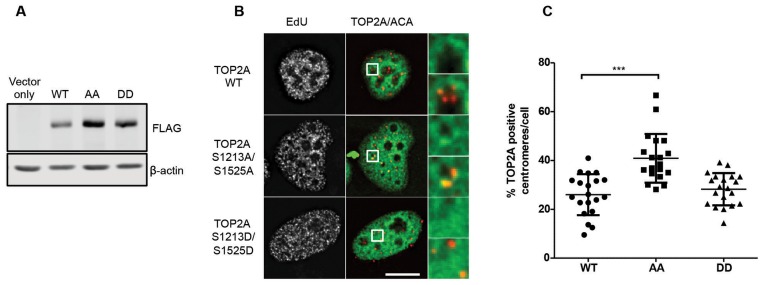
In eukaryotic cells the CDC7/DBF4 kinase, also known as DBF4-dependent kinase (DDK), is required for the firing of DNA replication origins. CDC7 is also involved in replication stress responses and its depletion sensitises cells to drugs that affect fork progression, including Topoisomerase 2 poisons. Although CDC7 is an important regulator of cell division, relatively few substrates and bona-fide CDC7 phosphorylation sites have been identified to date in human cells. In this study, we have generated an active recombinant CDC7/DBF4 kinase that can utilize bulky ATP analogues. By performing in vitro kinase assays using benzyl-thio-ATP, we have identified TOP2A as a primary CDC7 substrate in nuclear extracts, and serine 1213 and serine 1525 as in vitro phosphorylation sites. We show that CDC7/DBF4 and TOP2A interact in cells, that this interaction mainly occurs early in S-phase, and that it is compromised after treatment with CDC7 inhibitors. We further provide evidence that human DBF4 localises at centromeres, to which TOP2A is progressively recruited during S-phase. Importantly, we found that CDC7/DBF4 down-regulation, as well S1213A/S1525A TOP2A mutations can advance the timing of centromeric TOP2A recruitment in S-phase. Our results indicate that TOP2A is a novel DDK target and have important implications for centromere biology.


Figures

Figure 1.
Figure 1.
Covalent capture of thio-phosphorylated peptides by AS-CDC7. (A) In vitro kinase assay with recombinant WT or M118A, M134A and M118A/M1134A CDC7/DBF4, recombinant MCM2 and N6-(benzyl)ATP-γ-S. Thio-phosphorylated MCM2 and CDC7 proteins are detected by western blotting. Ponceau-stained membrane shows equal amount of MCM2 substrate in reactions. (B) Western blot detection of thio-phosphorylated proteins after kinase reaction with nuclear extracts and N6-(benzyl)ATP in the presence or absence of AS-CDC7. (C) List of proteins and peptides identified after covalent capture of thio-phosphorylated peptides. The sites of modification are indicated in red.
Figure 2.
Figure 2.
CDC7/DBF4 interacts with TOP2A. (A) Proteins extracted from nuclei with or without Benzonase were analysed by western blotting with the indicated antibodies. (B) Immunoprecipitations (IP) with anti-FLAG antibodies were performed from T-REx-EV and T-REx-DBF4 cells. (C) Schematic of DBF4 deletion mutant alleles used to generate Flp-In T-REx 293 conditionally expressing cell lines. (D) Detection of DBF4 fragments by western blotting in nuclear extracts prepared from Flp-In T-REx 293 cells upon addition of doxycycline. Asterisks indicate cross-reactive bands. (E) Endogenous TOP2A was immunoprecipitated from nuclear extracts and immunoprecpitated material was analysed by western blotting.
Figure 3.
Figure 3.
CDC7/DBF4 interacts with TOP2A predominantly in early S-phase. (A) T-REx-DBF4 cells were treated with mimosine or nocodazole for 19 h and DNA content analysed by Flow Cytometry. (B) Extracts were prepared from asynchronously growing, mimosine and nocodazole treated cells as in panel A and TOP2A was immunopreciptiated with specific antibodies. As control, unrelated mouse IgG was used. Immunoprecipitated proteins were then analysed by western blotting. (C) DNA content of cells treated with mimosine for 15 h and released into fresh media. Samples were collected at the indicated time-points. (D) TOP2A immunoprecipitates from extracts of cells released from mimosine block as in panel C.
Figure 4.
Figure 4.
CDC7 inhibitors affect the phosphorylation levels of cellular TOP2A and its interaction with the kinase. (A) T-REx-EV cells were treated with 10 μM XL413 or DMSO for 3 h, and cell extracts were separated on a 5% SDS-PAGE supplemented with 5 μM Phos-tag acrylamide or on a standard 6% SDS-PAGE. (B) T-REx-DBF4 cells were treated with DMSO or XL413 for the indicated times in the presence of absence of proteasome inhibitor MG132. (C) Extracts prepared from T-REx-DBF4 cells were incubated in phosphatase reaction buffer in the presence or absence of λ-phosphatase. (D) T-REx-DBF4 cells were treated with mimosine for 12 h, then with 10 μM XL413 or DMSO for a further 3 h and immunoprecipitations were performed with anti-TOP2A antibody or control IgG. Immunoprecipiations were perfomed from 1.5 mg of extract and 20 μg of the input material (1.33%) was loaded on the gel. In all cases proteins were analyzed by western blotting; where indicated, low or high intensity scans of the same blot are shown.
Figure 5.
Figure 5.
DBF4 is localized at centromeres throughout S-phase. (A) U2OS cells transiently expressing DBF4-FLAG-Strep were treated with 10 μM EdU for 15 min prior to pre-extraction and fixation. EdU-containing DNA is shown in magenta, DBF4 in green, and centromeres (ACA) in red. Early, mid or late S-phase cells were determined according to the pattern of EdU incorporation. Areas indicated in boxes are magnified next to the respective images. Scale bar = 10 μm. (B) U2OS cells were transfected with plasmid expressing EGFP-DBF4 fusion protein and analysed by fluorescence microscopy. EGFP signal is in green and ACA centromeric staining in red. (C) Chromatin immunoprecipitations (ChIP) were performed with anti-Strep and anti-RNA pol II (RPB1) antibodies from extracts of T-REx-EV and T-REx-DBF4 cells. The amounts of the non-centromeric GAPDH promoter and Chromosome 1 centromeric (Cent1) DNA recovered were determined by qPCR relative to the input samples. Bars represent the Mean ± S.D. of three technical replicates. Results are representative of three independent experiments.
Figure 6.
Figure 6.
TOP2A is recruited to, and is active at centromeres in mid to late S-phase. (A) U2OS cells were treated with 10 μM EdU and 50 μg/ml ICRF-187 for 15 min prior to pre-extraction, fixation and immunofluorecence microscopy analysis. On top the pattern of EdU incorporation is shown in grey while on the bottom TOP2A is shown in green and centromeres (ACA) in red. Areas indicated in boxes are magnified below the respective images. Scale bar = 10 μm. (B) Cells in early and late S-phase were randomly selected and the proportion of centromeres co-incident with TOP2A foci were manually quantified. Each point on the graph represents data from 1 cell. Bars represent the mean ± S.D. ****P < 0.0001, Student's t-test.
Figure 7.
Figure 7.
CDC7/DBF4 inhibition increases the recruitment of TOP2A to centromeres. U2OS cells were transfected with siRNA against CDC7 and/or DBF4 for 48 h. Cell extrects were then prepared and analysed by western blotting (A) or cells were treated with 10 μM EdU and 50 μg/ml ICRF-187 for 15 min prior to pre-extraction, fixation and immunofluorecence microscopy analysis (B). Representative images of early S-phase cells are shown. (C) Quantification was performed as in Figure 6. ***P < 0.001, Student's t-test. Scale bar = 10 μm. (D) U2OS cells were challenged with 10 μM XL413, 10 μM PHA767491 or with DMSO as control. 15 min before harvesting cells were also treated with 10 μM EdU and 50 μg/ml ICRF-187 and analysed as above. *P < 0.05, Student's t-test.
Figure 8.
Figure 8.
Phosphorylation at Ser1213 and S1525 controls the timing of TOP2A recruitment at centromeres. U2OS cells were tranfected with constructs expressing either WT, S1213A/S1525A or S1213D/S1525D FLAG-tagged TOP2A. After 48 h, cell extracts were prepared and analysed by western blotting (A) or cells were treated with 10 μM EdU and 50 μg/ml ICRF-187 for 15 min prior to pre-extraction, fixation and immunofluorecence microscopy analysis (B). Representative images of early S-phase cells are shown. (C) Quantification was performed as in Figures 6 and 7. ***P < 0.001, Student's t-test. Scale bar = 10 μm.

Similar articles

Cited by

References

    1. Zeman M.K., Cimprich K.A. Causes and consequences of replication stress. Nat. Cell Biol. 2014;16:2–9. - PMC - PubMed
    1. Hills S.A., Diffley J.F.X. DNA replication and oncogene-induced replicative stress. Curr. Biol. 2014;24:R435–R444. - PubMed
    1. Symeonidou I.-E., Taraviras S., Lygerou Z. Control over DNA replication in time and space. FEBS Lett. 2012;586:2803–2812. - PubMed
    1. Sclafani R.A., Holzen T.M. Cell cycle regulation of DNA replication. Annu. Rev. Genet. 2007;41:237–280. - PMC - PubMed
    1. Jiang W., McDonald D., Hope T.J., Hunter T. Mammalian Cdc7-Dbf4 protein kinase complex is essential for initiation of DNA replication. EMBO J. 1999;18:5703–5713. - PMC - PubMed

MeSH terms