. 2016 Oct 14;44(18):e145.
doi: 10.1093/nar/gkw629. Epub 2016 Jul 12.

Global transcript structure resolution of high gene density genomes through multi-platform data integration

Affiliations

Global transcript structure resolution of high gene density genomes through multi-platform data integration

Tina O'Grady et al. Nucleic Acids Res. .

Abstract

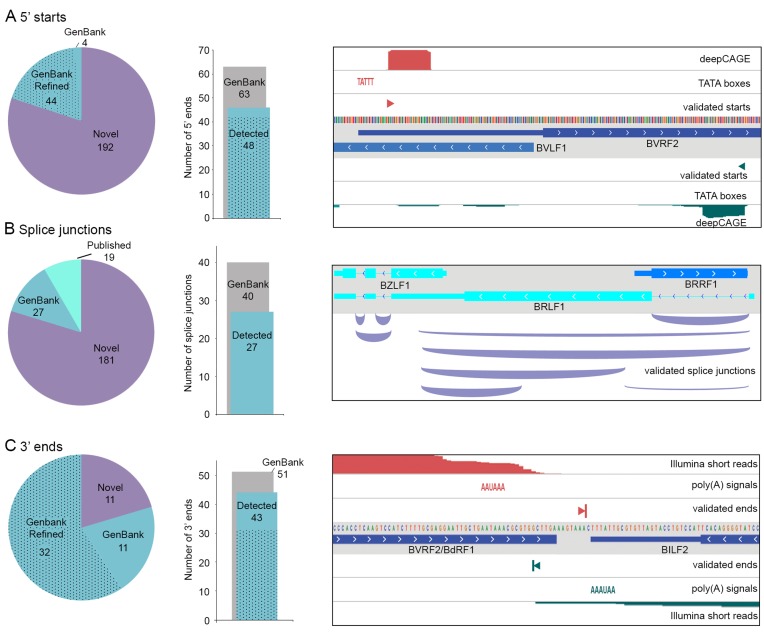
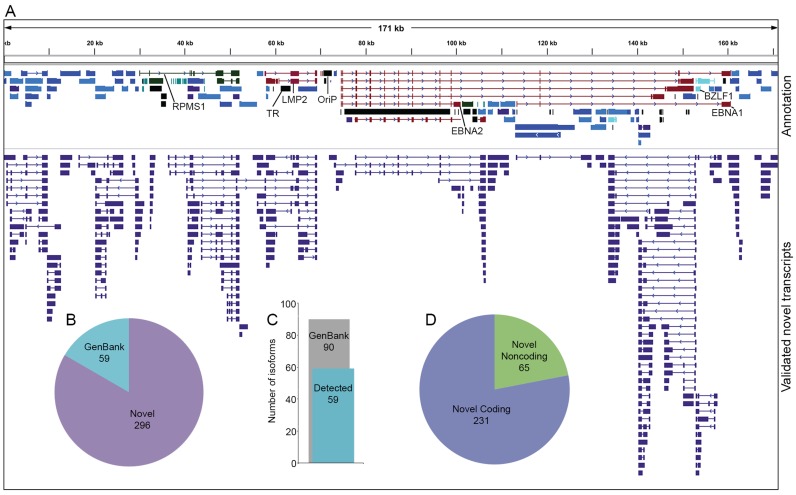
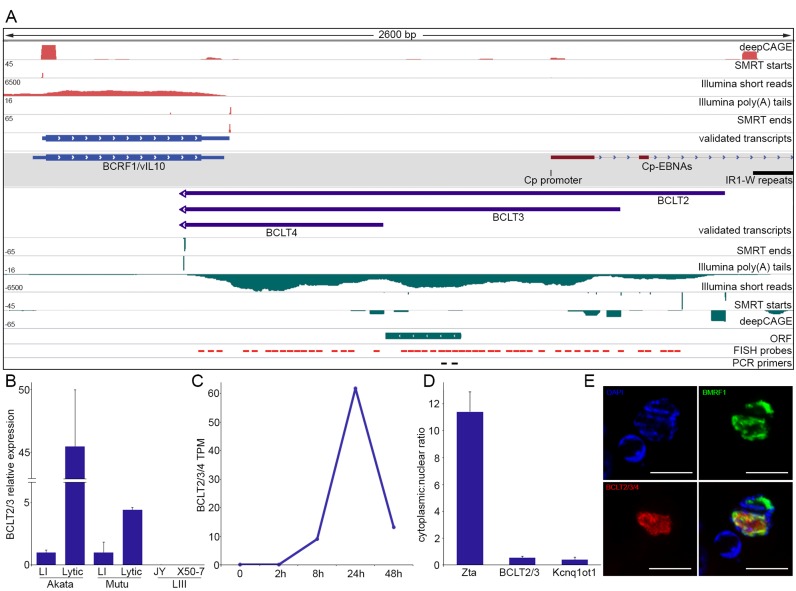
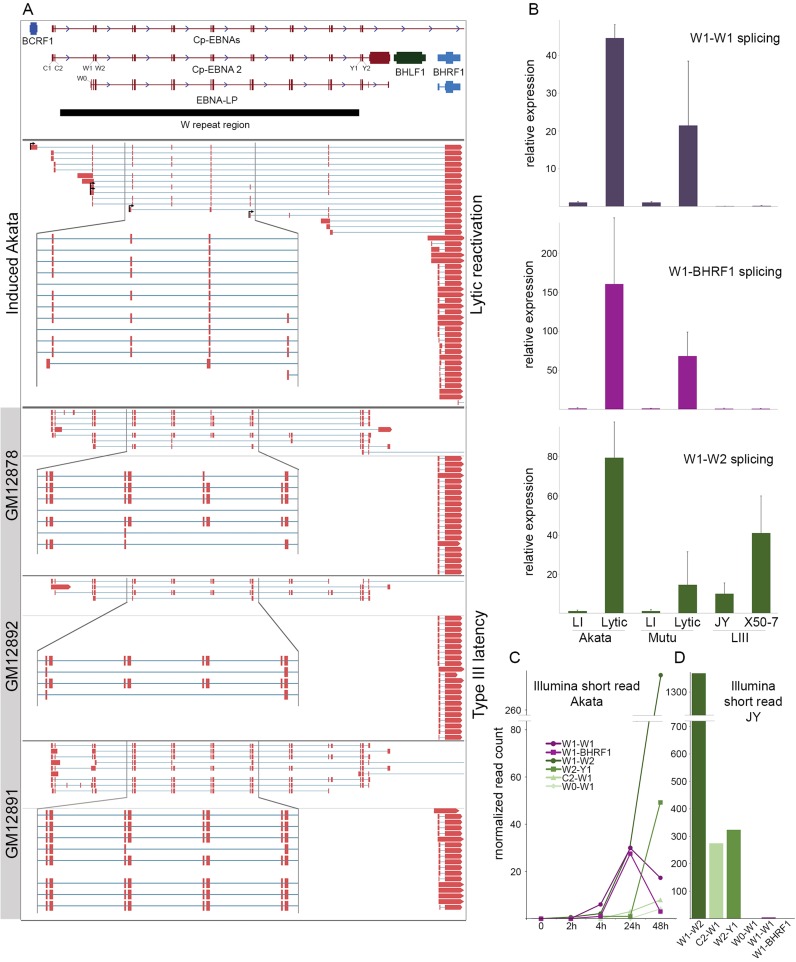
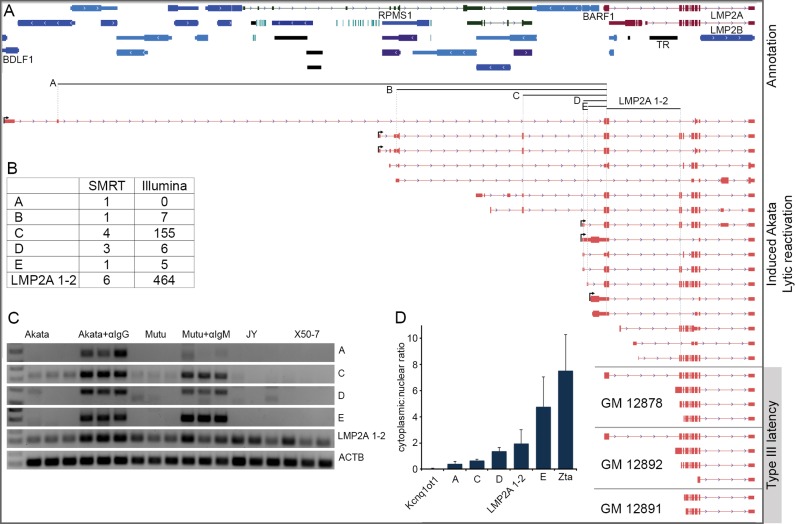
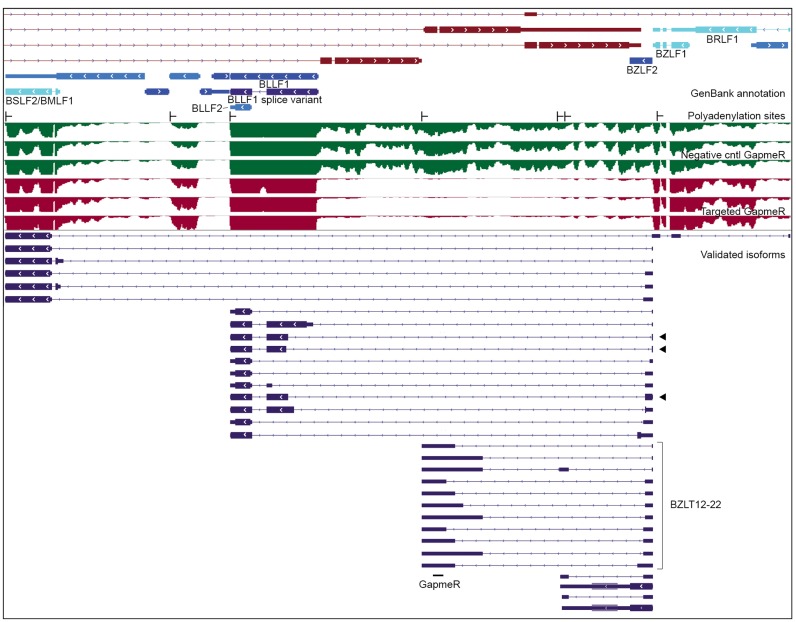
Annotation of herpesvirus genomes has traditionally been undertaken through the detection of open reading frames and other genomic motifs, supplemented with sequencing of individual cDNAs. Second generation sequencing and high-density microarray studies have revealed vastly greater herpesvirus transcriptome complexity than is captured by existing annotation. The pervasive nature of overlapping transcription throughout herpesvirus genomes, however, poses substantial problems in resolving transcript structures using these methods alone. We present an approach that combines the unique attributes of Pacific Biosciences Iso-Seq long-read, Illumina short-read and deepCAGE (Cap Analysis of Gene Expression) sequencing to globally resolve polyadenylated isoform structures in replicating Epstein-Barr virus (EBV). Our method, Transcriptome Resolution through Integration of Multi-platform Data (TRIMD), identifies nearly 300 novel EBV transcripts, quadrupling the size of the annotated viral transcriptome. These findings illustrate an array of mechanisms through which EBV achieves functional diversity in its relatively small, compact genome including programmed alternative splicing (e.g. across the IR1 repeats), alternative promoter usage by LMP2 and other latency-associated transcripts, intergenic splicing at the BZLF2 locus, and antisense transcription and pervasive readthrough transcription throughout the genome.


Figures

Figure 1.
Figure 1.
Long-read sequencing data and validation strategy. (A) Percentages of consensus full-length isoforms mapped to cellular or EBV genomes. (B) Length distribution of consensus full-length isoforms mapped to cellular or EBV genomes. Blue boxes represent second and third quartiles, horizontal black lines indicate mean. (C) Distribution of proportion of annotated transcripts, by length, that are represented by full-length sequenced isoforms. (D) Strategy for data integration to validate full-length sequenced transcripts. (E) Example validated cellular transcripts.
Figure 2.
Figure 2.
Validation of transcript features. (A) Validation of 5′ starts. Pie chart indicates annotation status of validated 5′ starts. ‘Refined’ includes start sites annotated at TATA boxes that are more accurately identified in this study. Bar chart indicates the number of GenBank-annotated 5′ starts validated in this study (stippled = refined). Genome browser panel shows example validated 5′ starts. (B) Validation of splice junctions. Pie chart indicates annotation status of validated splice junctions. Bar chart indicates the number of GenBank-annotated splice junctions validated in this study. Genome browser panel shows example validated splice junctions. (C) Validation of 3′ ends. Pie chart indicates annotation status of validated 3′ ends. ‘Refined’ includes end sites annotated at canonical polyadenylation signals that are more accurately identified in this study. Bar chart indicates the number of GenBank-annotated 3′ ends validated in this study (stippled = refined). Genome browser panel shows example validated 3′ ends.
Figure 3.
Figure 3.
Novel validated transcripts. (A) Top track contains EBV-Akata GenBank annotation that has been refined and updated in this study. Bottom track contains novel EBV transcripts validated in this study. (B) Annotation status of validated transcripts. (C) Number of GenBank-annotated transcripts validated in this study. (D) Coding potential of novel EBV transcripts as determined by CPAT (19).
Figure 4.
Figure 4.
Novel intergenic transcripts. (A) Genome browser visualization of BCLT2-4 transcripts and supporting evidence. Gray shaded track displays GenBank-annotated features. (B) Strand-specific qRT-PCR of BCLT2/3 in Akata, Mutu, JY and X50-7 cells. LI = type I latency, LIII = type III latency. Error bars are standard deviation. (C) Normalized Illumina RNA-Seq read counts of BCLT2/3/4 at multiple time points after induction. TPM = transcripts per million. (D) Strand-specific qRT-PCR of nuclear and cytoplasmic fractions of induced Akata cells (24 h). Error bars are standard deviation. (E) FISH and immunofluorescence of BCLT2/3/4 and EBV nuclear protein BMRF1.
Figure 5.
Figure 5.
Programmed exon skipping in the W repeat region. (A) Genome browser visualization of CFLs mapping to the W repeat region and/or BHRF1 gene in induced Akata cells and lymphoblastoid cell lines (LCLs). (B) qRT-PCR using primers spanning the indicated splice junctions in Akata, Mutu, JY and X50-7 cells. LI = type I latency, LIII = type III latency, Lytic refers to 24 or 48 h induction in Akata and Mutu cells. (C) Time course analysis of splice junction reads in polyA+ RNA from Akata cells. (D) Splice junction reads detected in polyA+ RNA from the type III latency cell line, JY.
Figure 6.
Figure 6.
Complex lytic promoter usage for LMP2 transcripts. (A) Genome browser visualization of CFLs mapping to the LMP2 exons in induced Akata cells and LCLs. Arrows positioned at the beginning of reads signify those with validated 5′ ends. (B) Splice junction read depth for SMRT circular consensus and Illumina short-read sequencing. Labels A through E refer to junctions indicated below GenBank-annotated gene track in (A). (C) PCR using junction-spanning primers in Akata, Mutu, JY and X50-7 cells. Akata + αIgG and Mutu + αIgM refer to Akata and Mutu cells induced for 24 and 48 h, respectively. (D) qRT-PCR of nuclear and cytoplasmic fractions of induced Akata cells (24 h).
Figure 7.
Figure 7.
Readthrough transcription and intergenic splicing at the BZLF2 locus. From top: GenBank gene annotation, TRIMD-validated polyadenylation sites, Illumina short-read coverage of induced Akata cells with negative control GapmeR (green tracks) and induced Akata cells with GapmeR targeting BZLT12-22 (red tracks), novel validated isoforms (blue transcript features). Black arrows indicate transcripts whose largest ORF is an in-frame fusion.

References

    1. Pattle S.B., Farrell P.J. The role of Epstein-Barr virus in cancer. Expert Opin. Biol. Ther. 2006;6:1193–1205. - PubMed
    1. Henle W., Henle G. Epstein-Barr virus and human malignancies. Cancer. 1974;34(Suppl. S4):1368–1374. - PubMed
    1. Kang M.S., Kieff E. Epstein-Barr virus latent genes. Exp. Mol. Med. 2015;47:e131. - PMC - PubMed
    1. Longnecker R., Kieff E., Cohen J.I. Epstein-Barr Virus. In: Knipe DM, Howley PM, editors. Fields Virology. 6th edn. Philadelphia: Wolters Kluwer Health/Lippincott WIlliams & Wilkins; 2013. pp. 1898–1959.
    1. Baer R., Bankier A.T., Biggin M.D., Deininger P.L., Farrell P.J., Gibson T.J., Hatfull G., Hudson G.S., Satchwell S.C., Seguin C., et al. DNA sequence and expression of the B95-8 Epstein-Barr virus genome. Nature. 1984;310:207–211. - PubMed

MeSH terms