. 2016 Aug 19;44(14):6583-98.
doi: 10.1093/nar/gkw638. Epub 2016 Jul 12.

Novel small molecules potentiate premature termination codon readthrough by aminoglycosides

Affiliations

Novel small molecules potentiate premature termination codon readthrough by aminoglycosides

Alireza Baradaran-Heravi et al. Nucleic Acids Res. .

Abstract

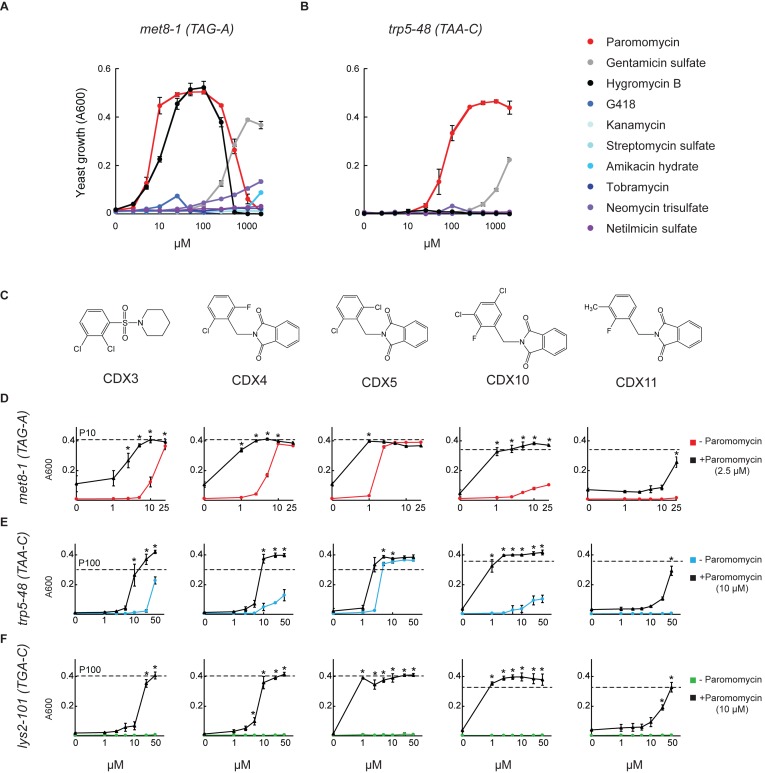
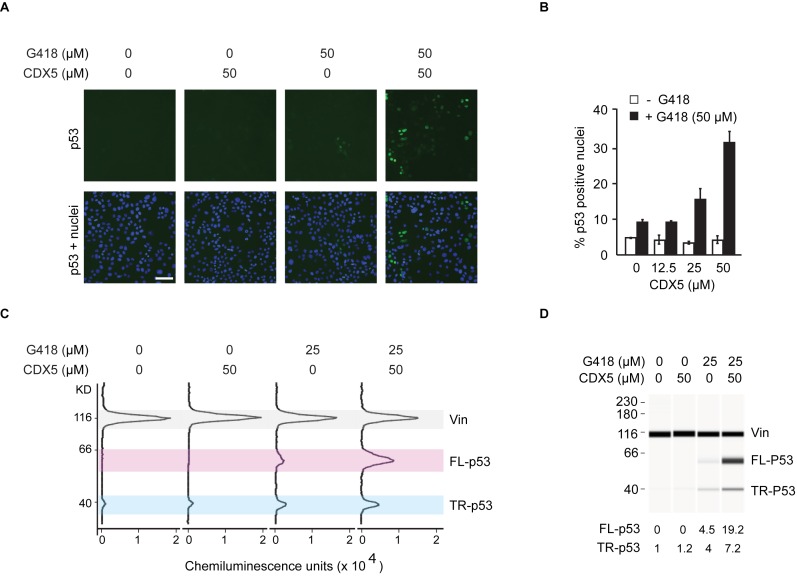
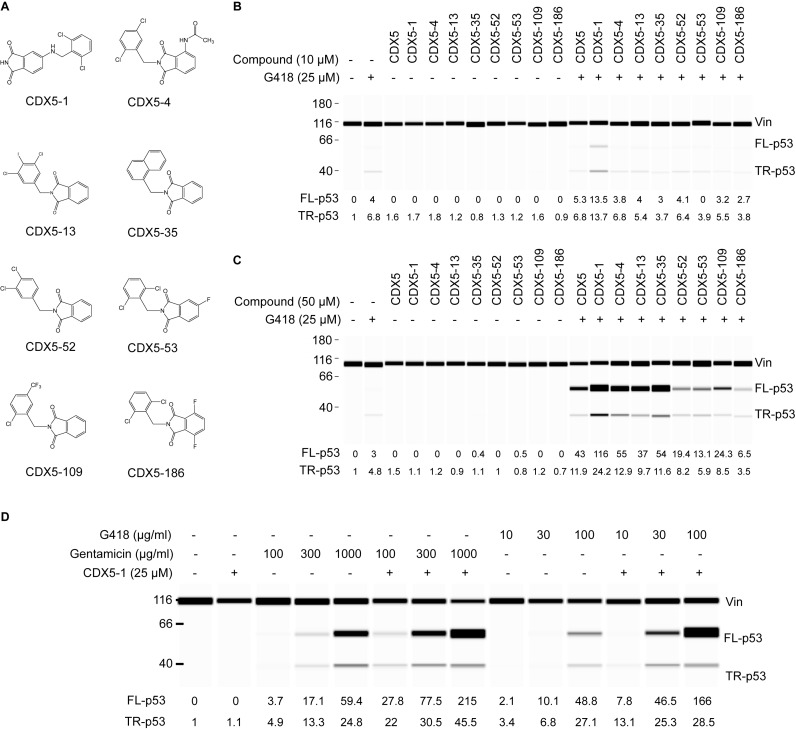
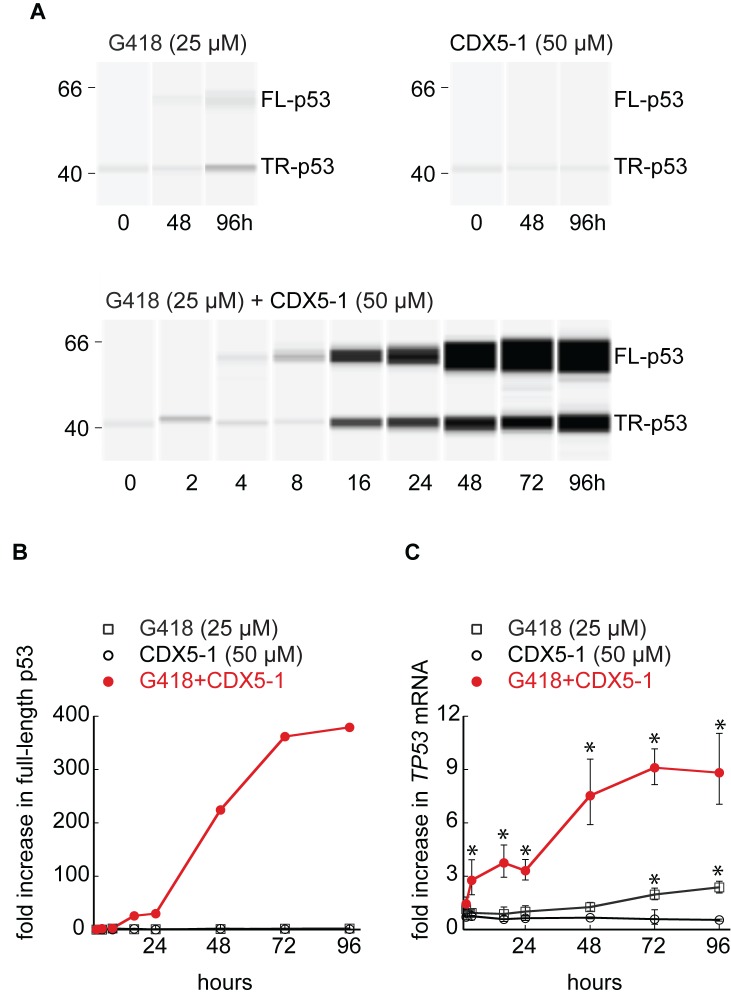
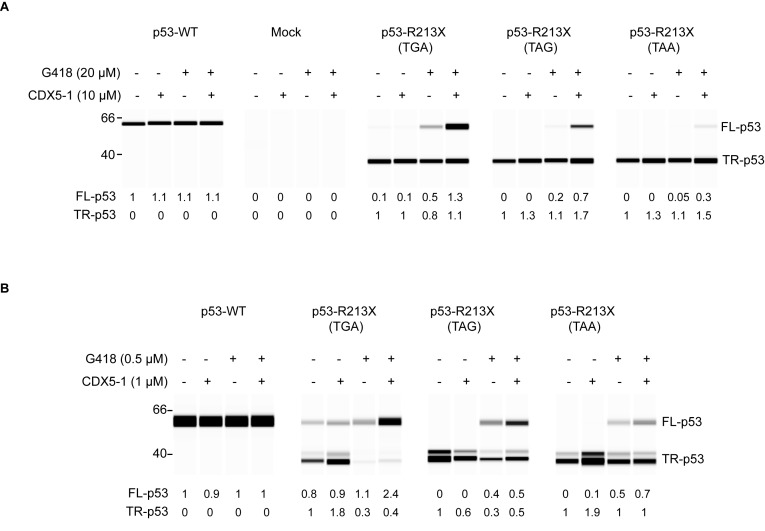
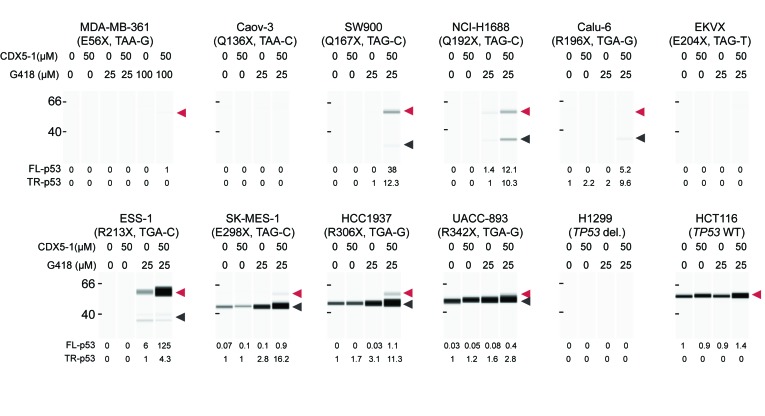
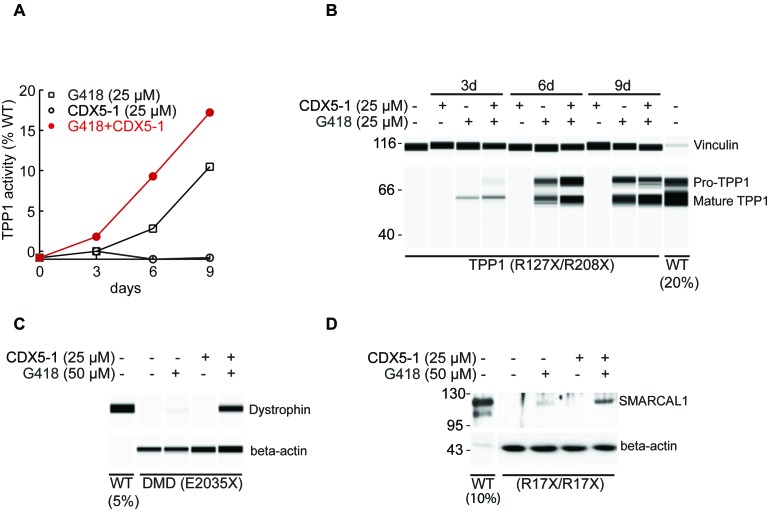
Nonsense mutations introduce premature termination codons and underlie 11% of genetic disease cases. High concentrations of aminoglycosides can restore gene function by eliciting premature termination codon readthrough but with low efficiency. Using a high-throughput screen, we identified compounds that potentiate readthrough by aminoglycosides at multiple nonsense alleles in yeast. Chemical optimization generated phthalimide derivative CDX5-1 with activity in human cells. Alone, CDX5-1 did not induce readthrough or increase TP53 mRNA levels in HDQ-P1 cancer cells with a homozygous TP53 nonsense mutation. However, in combination with aminoglycoside G418, it enhanced readthrough up to 180-fold over G418 alone. The combination also increased readthrough at all three nonsense codons in cancer cells with other TP53 nonsense mutations, as well as in cells from rare genetic disease patients with nonsense mutations in the CLN2, SMARCAL1 and DMD genes. These findings open up the possibility of treating patients across a spectrum of genetic diseases caused by nonsense mutations.


Figures

Figure 1.
Figure 1.
Chemical suppression of yeast nonsense alleles. (A, B) Suppression of met8-1 and trp5-48 nonsense alleles by aminoglycosides. B0133-3B-AB13 yeast cells were grown in 96-well plates without methionine (A) or without tryptophan (B) and with the indicated concentrations of aminoglycosides. Yeast growth (A600) was measured at 40 h. Shown are mean ± S.D. (n = 3). (CF) Synergistic suppression of met8-1, trp5-48 and lys2-101 nonsense alleles by CDX compounds and paromomycin. (C) Structures of the CDX compounds identified in the high throughput screen. B0133-3B-AB13 (D and E) or IS110-18A-AB13 (F) yeast cells were grown in 96-well plates without methionine (D) tryptophan (E) or lysine (F) and with different concentrations of the CDX compounds shown above each column, without (colored curves) or with paromomycin (black curves). The selected paromomycin concentration of 2.5 μM (D) or 10 μM (E and F) was subactive for these alleles. The dashed lines labelled P10 or P100 indicate growth with paromomycin alone at 10 or 100 μM, respectively. The +4 nucleotide is indicated for each codon. The asterisks indicate synergistic combinations (CI <0.1). Shown are mean ± S.D. (n = 3).
Figure 2.
Figure 2.
PTC readthrough at p53 R213X in HDQ-P1 human breast carcinoma cells. (A and B) Automated p53 immunofluorescence microscopy assay. Cells grown in 96-well plates were exposed for 72 h to different concentrations of CDX5 without or with 50 μM G418. The proportion of cells showing nuclear p53 immunofluorescence was determined as an indirect but high throughput measure of PTC readthrough. Representative images are shown in (A), with p53 immunofluorescence shown in green and nuclei in blue (bar, 100 μm). Quantitative data are shown in (B) (mean ± S.D., n = 3). Additional images are shown in Supplementary Figure S2. (C) Automated capillary electrophoresis western analysis. Cells were exposed for 96 h to the indicated compounds. The results are electropherograms of the chemiluminescence detection of bound antibodies. TR-p53: truncated p53, FL-p53: full-length p53, Vin: vinculin loading control. (D) The results from panel C are displayed as ‘pseudo blots’ for ease of visualization. The area under the truncated and full-length p53 peaks was first normalized to the vinculin loading control to account for variations in protein loading. To provide lane-to-lane comparison, the amount of truncated and full-length p53 was further divided by the amount of truncated p53 found in untreated cells. These numbers are displayed under the lanes. The data show that CDX5 does not induce the formation of full-length p53 as a single agent but that it strongly potentiates the PTC readthrough activity of G418.
Figure 3.
Figure 3.
PTC readthrough by CDX5 analogs in combination with aminoglycosides. HDQ-P1 cells were exposed for 96 h to the analogs shown in (A) at 10 μM (B) or 50 μM (C), without or with 25 μM G418 and were analysed for formation of full-length p53, quantified relative to the amount of truncated p53 in untreated cells. (D) HDQ-P1 cells were exposed for 72 h to CDX5-1 and different concentrations of gentamicin or G418. Concentrations are shown in μg/ml to enable comparison with gentamicin, which is a mix of related aminoglycosides.
Figure 4.
Figure 4.
Time course of PTC readthrough. HDQ-P1 were exposed to compounds for different times and analysed for formation of full-length p53 (A and B), and TP53 mRNA (C). Panel A shows representative time points for G418 and CDX5-1 and the entire time course for the combination of G418 and CDX5-1. Panel B shows quantitation of full-length p53 relative to the amount of truncated p53 found in untreated cells for the entire time course for all three treatments. Panel C shows triplicate measurements of TP53 mRNA (± S.D., n = 3) from the same samples as panels A and B. * indicates statistically significant differences between different treatment conditions and untreated samples (P < 0.05).
Figure 5.
Figure 5.
PTC readthrough at p53 R213X (TGA, TAG and TAA) sequences in cells and in vitro. (A) H1299 cells transiently transfected with the indicated constructs were exposed for 48 h to CDX5-1 and G418, alone or in combination and full-length and truncated p53 was quantified relative to the amount of p53 in untreated cells. p53-WT: R213; Mock: transfection reagents only. (B) PTC readthrough in a cell-free translation extract. The indicated 5′ capped and 3′ poly(A) tailed TP53 mRNAs were subjected to in vitro translation in the presence of the indicated compounds. Full-length p53 and truncated p53 were quantified relative to full-length p53 (in WT) or truncated p53 (in mutants) in untreated reactions.
Figure 6.
Figure 6.
PTC readthrough in different human cancer cell lines with homozygous nonsense mutations at different positions in the TP53 gene. The cell lines (mutations shown in parentheses), were exposed for 96 h to CDX5-1 and G418, alone or in combination, and full-length p53 (red arrowhead) and truncated p53 (black arrowhead) was quantified relative to truncated p53 found in untreated cells, or to truncated p53 found in treated cells if no p53 signal was detected in untreated cells. The +4 nucleotide is indicated for each codon.
Figure 7.
Figure 7.
TPP1, DMD and SMARCAL1 PTC readthrough in patient-derived cells. (A) GM16485 fibroblasts (TPP1: R127X, TGA-C; R208X, TGA-T) were exposed to the indicated concentrations of compounds for different times and TPP1 enzyme activity was determined and expressed relative to the average activity of untreated fibroblasts from two unaffected individuals (WT). (B) The same cell extracts were analysed for formation of TPP1 by automated capillary electrophoresis western analysis. Extracts from WT fibroblasts were also analysed, using 20% of the amount of protein used for GM16485. Vinculin was used as a loading control. (C) HSK001 myoblasts derived from a DMD patient with nonsense mutation (DMD: E2035X, TAG-G) were differentiated into myotubes and exposed to the indicated concentrations of compounds for 3 days and dystrophin expression level was determined by automated capillary electrophoresis western analysis. Extracts from WT myotubes were also analyzed, using 5% of the amount of protein used for DMD cells. Beta-actin was used as a loading control. (D) SD123 fibroblasts with a homozygous SMARCAL1 nonsense mutation (R17X, TGA-C) were exposed to the indicated concentrations of compounds for 6 days and SMARCAL1 levels were determined by western blotting. Extracts from WT fibroblasts were also analyzed, using 10% of the amount of protein used for SIOD cells. Beta-actin was used as a loading control.

References

    1. Mort M., Ivanov D., Cooper D.N., Chuzhanova N.A. A meta-analysis of nonsense mutations causing human genetic disease. Hum. Mutat. 2008;29:1037–1047. - PubMed
    1. Benzer S., Champe S.P. A change from nonsense to sense in the genetic code. Proc. Natl. Acad. Sci. U.S.A. 1962;48:1114–1121. - PMC - PubMed
    1. Hawthorne D.C., Mortimer R.K. Super-suppressors in yeast. Genetics. 1963;48:617–620. - PMC - PubMed
    1. Manney T.R. Action of a super-suppressor in yeast in relation to allelic mapping and complementation. Genetics. 1964;50:109–121. - PMC - PubMed
    1. Singh A., Ursic D., Davies J. Phenotypic suppression and misreading in Saccharomyces cerevisiae. Nature. 1979;277:146–148. - PubMed

MeSH terms