. 2016 Jul 26;113(30):E4387-96.
doi: 10.1073/pnas.1520387113. Epub 2016 Jul 12.

Lmx1a and Lmx1b regulate mitochondrial functions and survival of adult midbrain dopaminergic neurons

Affiliations

Lmx1a and Lmx1b regulate mitochondrial functions and survival of adult midbrain dopaminergic neurons

Hélène Doucet-Beaupré et al. Proc Natl Acad Sci U S A. .

Abstract

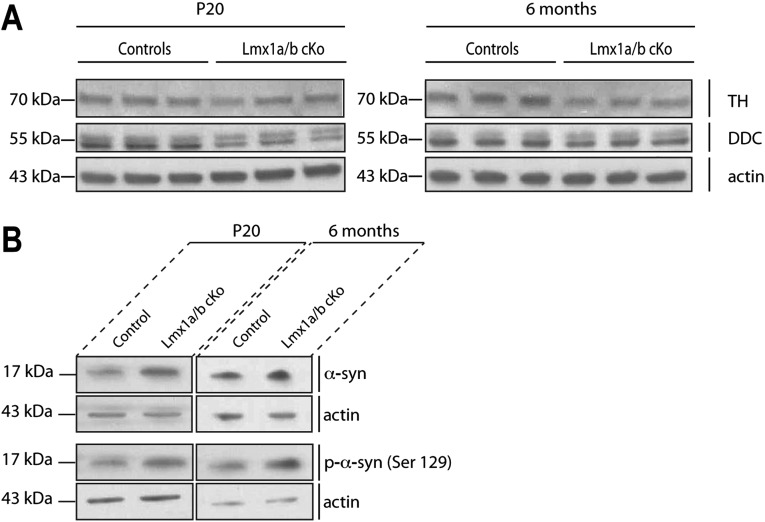
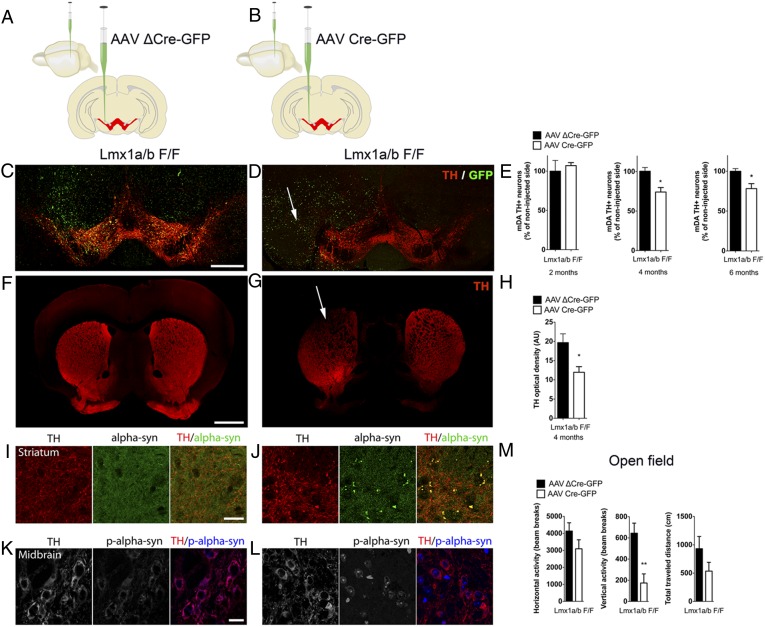
The LIM-homeodomain transcription factors Lmx1a and Lmx1b play critical roles during the development of midbrain dopaminergic progenitors, but their functions in the adult brain remain poorly understood. We show here that sustained expression of Lmx1a and Lmx1b is required for the survival of adult midbrain dopaminergic neurons. Strikingly, inactivation of Lmx1a and Lmx1b recreates cellular features observed in Parkinson's disease. We found that Lmx1a/b control the expression of key genes involved in mitochondrial functions, and their ablation results in impaired respiratory chain activity, increased oxidative stress, and mitochondrial DNA damage. Lmx1a/b deficiency caused axonal pathology characterized by α-synuclein(+) inclusions, followed by a progressive loss of dopaminergic neurons. These results reveal the key role of these transcription factors beyond the early developmental stages and provide mechanistic links between mitochondrial dysfunctions, α-synuclein aggregation, and the survival of dopaminergic neurons.

Keywords: Parkinson's disease; dopamine neurons; mitochondrial dysfunctions; protein aggregates; transcription factors.


Conflict of interest statement

The authors declare no conflict of interest.

Figures

Fig. 1.
Fig. 1.
Lmx1a and Lmx1b expression in mDA neurons is maintained into adulthood. (A) Lmx1a and Lmx1b transcripts levels were compared in P1, P7, P60, and P200 in C57BL6 mouse ventral midbrain cryosections using nonradioactive in situ hybridization. (Scale bar, 250 μm.) (B) Stitched images of confocal tiles showing immunofluorescent staining with anti-Lmx1a (green), anti-Lmx1b (red), and anti-TH (blue) in ventral midbrain cryosections of P1 and P200 C57BL6 mouse midbrain illustrating the protein expression. (Scale bar, 250 μm.) (C) Western blot and quantification of Lmx1a and Lmx1b expression in E15, P1, P7, P20, adult (3 mo old), and aged (9 mo old) mouse midbrain. n = 3 animals per age. The molecular mass of the protein marker is indicated.
Fig. S1.
Fig. S1.
(Left) Western blots from ventral midbrain extracts from P7 and 13-mo-old mice. (Right) Quantification of Lmx1a and Lmx1b protein levels (n = 3 animals per age).
Fig. S2.
Fig. S2.
In situ hybridization for Lmx1a and Lmx1b on Lmx1a/b cKO and control midbrain sections at P1 showing the absence of Lmx1a and Lmx1b expression in the Lmx1a/b cKO midbrain. (Scale bar, 500 μm.)
Fig. 2.
Fig. 2.
Effects of Lmx1a and Lmx1b ablation on mDA neurons. (AC) Immunohistological analyses of TH staining in the VTA and SNpc in the midbrains of P1 (A), P20 (B), and >P60 (C) Lmx1a/b cKO and control mice using DAB staining against TH. The arrows in C denote the DA neuronal loss. (Scale bar, 500 μm.) (D and E) Quantification of DA neuronal loss in the VTA (D) and SNpc (E) by stereological count at P1, P20, P60, and P200; values are derived from at least four mice, three sections per brain. (F) Coexpression of DAT (green) and TH (red) in midbrain sections from 60-d-old Lmx1a/b cKO and control mice (stitched confocal images). Arrows indicate that the loss of TH+ cells is correlated with a loss of the DAT signal. (Scale bar, 500 μm.) (G) β-Gal staining (blue) on midbrain sections from 60-d-old Lmx1a/b cKO R26RLacZ/+ and control mice confirming the loss of DA neurons. The genotype of control mice in G is DatCre/+R26RLacZ/+. (Scale bar, 500 μm.)
Fig. S3.
Fig. S3.
(A and B) Immunohistological analyses of DAT and Nissl staining in coronal midbrain sections from control (A) and Lmx1a/b cKO (B) mice using DAB staining against DAT. (Scale bar, 500 μm.) (C and D) Higher magnification images of SNpc sections from control (C) and Lmx1a/b cKO (D) mice. (Scale bar, 250 μm.) (E) Quantification of DA neuronal loss in the VTA and the SNpc by unbiased stereological counting of TH+, DAT+, and Nissl+ cells at P60. For the DAT and Nissl quantification, we selected the region of interest (mDA domain) based on DAT staining and counted the DAT+- and Nissl+-stained cells in this region. Values are derived from at least four mice, three sections per brain.
Fig. 3.
Fig. 3.
Abnormal nerve terminals in Lmx1a/b cKO mice. (A and B) The immunohistological striatal TH staining pattern was compared in P60 control (A) and Lmx1a/b cKO (B) mice. In B, the higher-magnification image shows dystrophic and abnormal axon terminal enlargements of TH+ nerve fibers as well as large TH+ spheroid-like structures. (Scale bar, 50 μm.) See also Fig. S5. (C and D) Identification of the axonal spheroids using coimmunostaining of α-synuclein (green) and TH (red) in the striatum of control (C) and Lmx1a/b cKO (D) mice. (Scale bar, 50 μm.) (E and F) Western blotting analysis of TH, DDC, and phospho-α-synuclein levels in extracts from the striatum of P20 (E) and 6-mo-old (F) control and Lmx1a/b cKO mice (n = 3 animals per genotype). Representative blots are shown in Fig. S4. (G and H) HPLC analysis of striatal content (DA, DOPAC, 3-MT, and HVA) in P20 (G) and 6-mo-old (H) control and Lmx1a/b cKO mice. Values are derived from at least three mice per group. (I) Lmx1a/b cKO mice and their controls were placed in the open-field chamber. Horizontal and vertical activities (measured by beam breaks) and the total distance traveled were measured for 10 min in P30, P60, P90, P200, and P300 mice.
Fig. S4.
Fig. S4.
(A) Western blotting analysis of TH and DDC levels in extracts from the striatum of control and Lmx1a/b cKO mice at P20 and at age 6 mo (n = 3 animals per genotype). The molecular mass of the protein marker is indicated. (B) Western blotting analysis of α-synuclein and phospho-α-synuclein S129 levels in extracts from the striatum of control and Lmx1a/b cKO mice at P20 and at age 6 mo (n = 3 animals per genotype). The molecular mass of the protein marker is indicated.
Fig. S5.
Fig. S5.
(A) Higher-magnification images of the striatum from P20 Lmx1a/b cKO and control mice show representative TH+ spheroid-like structures present in Fig. 3 A and B. (Scale bar, 50 μm.) (B) Quantification of the number of axonal spheroids in the striatum from P20 and P60 Lmx1a/b cKO and control mice; values are derived from at least three mice with two striatal complete sections manually counted per brain (***P ≤ 0.001). (C) Examples of sporadic TH+ cell bodies (arrows) found in the striatum of Lmx1a/b cKO mice at P60. TH (green) was colabeled with nuclear staining DAPI (blue). (Scale bar, 50 μm.)
Fig. 4.
Fig. 4.
Inactivation of Lmx1a and Lmx1b in mDA neurons by viral-vector delivery of Cre recombinase impairs the survival of adult midbrain DA neurons. (A and B) Schematics depicting the injection of control mutated Cre-encoding (AAV ΔCre-GFP) virus (A) or of Cre-encoding (AAV Cre-GFP) virus (B) in the ventral midbrain of Lmx1a/b F/F adult (2-mo-old) mice. (C and D) Stitched confocal images of TH and GFP staining from a representative section of Lmx1a/b F/F mice 6 mo after unilateral injection with either control or Cre-encoding (AAV Cre-GFP) virus. Infected cells are shown in green, and the arrow denotes the DA neuronal loss. (Scale bar, 500 μm.) (E) Quantification of DA neuronal loss in the VTA and the SNpc by stereological counting of TH+ cells at 2, 4, and 6 mo after the injection; values are derived from at least four mice, three sections per brain. (F and G) TH staining in the striatum (red) shows the DA axon distribution (stitched confocal images). The arrow indicates the DA axonal loss in the dorsolateral striatum on the injected side. (Scale bar, 1 mm.) (H) Densitometry quantification of TH immunostaining intensity in the striatum of mice infected with the control (mutated Cre) and Cre-GFP vectors (n = 3). (I and J) Identification of the axonal spheroids using costaining of α-synuclein (green) and TH (red) in the striatum of the side injected with either control or Cre-encoding AAV. (Scale bar, 50 μm.) (K and L) Immunohistological analysis of phosphorylated α-synuclein at S129 (blue) in TH+ neurons (red) in the midbrain of injected mice. High levels of phospho α-synuclein S129 were detected in the nucleus of TH+ neurons in AAV Cre-GFP–injected animals compared with controls. (M) Behavioral characterization of Lmx1a/b F/F mice 6 mo after AAV infection in the SNpc. Open-field horizontal and vertical activity (measured by beam breaks) and total distance traveled were measured (n = 5).
Fig. S6.
Fig. S6.
(A and B) In situ hybridization of Lmx1a and Lmx1b (A) and β-gal (B) staining on midbrain sections 2 mo following injection of AAV ΔCre-GFP, AAV Cre-GFP, and AAV Cre-GFP-ires-Nrf1 (stitched images). The absence of Lmx1a and Lmx1b staining at the injection site shows the efficiency of the AAV vector used. (C) In vitro validation of AAV Cre-ires-Nrf1 in HEK293 cells. The HEK293 cell line was infected, mRNA was extracted 2 wk later, and the Nrf1 transcript level was measured by RT-qPCR. (D) RT-qPCR analysis showing Nrf1 mRNA expression in primary neuronal cultures of ventral midbrain from P1 control or Lmx1a/b cKO mice transfected with a control empty vector or a vector expressing Nrf1 (CMV-Nrf1) (n = 3). (E) Expression profile of Lmx1a and Lmx1b using reverse-transcription PCR. Lmx1a and Lmx1b amplification products (349 pb and 307 pb, respectively) obtained from noninjected and injected (asterisks) hemispheres of dissected ventral midbrain showing a lower amount of Lmx1a and Lmx1b transcripts in the hemispheres injected with the AAV Cre-GFP (2) and AAV Cre-GFP-ires-Nrf1 (3). Note that levels of Lmx1a and Lmx1b were similar in both hemispheres following AAV ΔCre-GFP (1) injection.
Fig. S7.
Fig. S7.
(A) Identification of the axonal spheroids using costaining of α-synuclein (blue) and TH (red) in the striatum of the midbrain side injected with either control or Cre-encoding AAV, 2 mo postinjection. Note that axonal spheroids do not show α-synuclein accumulation 2 mo postinjection. (Scale bar, 50 μm.) (B) Dystrophic and abnormal axon terminal enlargements of TH+ nerve fibers as well as large TH+ spheroid-like structures in mice injected with AAV Cre. No abnormal axon terminal enlargements were found in mice injected with AAV ∆Cre and AAV Cre-Ires-Nrf1 up to 6 mo after injection. (Scale bar, 50 μm.)
Fig. S8.
Fig. S8.
(A and B) Mice that were injected with AAV ∆Cre and AAV Cre at P20 were placed in the open-field chamber. Horizontal and vertical activities (measured by beam breaks) and the total distance traveled were measured for 60 min at 1 mo (A) and 3 mo (B) postinjection. (C and D) Mice that were injected with AAV ∆Cre and AAV Cre at age 20 mo were placed in the open-field chamber. Horizontal and vertical activities (measured by beam breaks) and the total distance traveled were measured for 60 min at 1 mo (C) and 3 mo (D) postinjection.
Fig. 5.
Fig. 5.
Lmx1a/b coordinate the expression of mitochondrial-associated genes. (A) Schema illustrating rapid TH immunostaining, LCM, and mRNA isolation. (Scale bars, 500 μm.) (B) Enrichment of GO terms for biological processes associated with down-regulated genes in Lmx1a/b cKO. (C) RT-qPCR analysis showing Nrf1, Ndufa2, Ndufa3, Ndufa4, Ndufv1, Uqcrq, Cox1, Cox6a, and Hspa8 mRNA expression in the ventral midbrain of control and Lmx1a/b cKO mice at P1. (D) RT-qPCR analysis showing Lmx1a, Lmx1b, and Nrf1 mRNA expression in mDA cultured neurons overexpressing Lmx1a (n = 5) and Lmx1b (n = 7). (E) Respirometry experiments in mDA cultured neurons from controls and Lmx1a/b cKO mice. CCCP, oxygen consumption rate in the presence of CCCP; OCR, oxygen consumption rate; RCR, respiratory control ratio. Mean basal OCR was 600 and 444 pM⋅min−1⋅104 neurons−1 for control and Lmx1a/cKO neurons, respectively, and the mean for uncoupled OCR was 976 and 601 pM⋅min−1⋅104 neurons−1 for control and Lmx1a/cKO neurons, respectively. The graph at the right compares the survival of DA neurons from control and Lmx1a/b cKO mice after 10 DIV (n = 5).
Fig. 6.
Fig. 6.
Deficiency in Lmx1a/b leads to overproduction of ROS and impaired mitochondrial DNA, and forced expression of Nrf1 has a rescue effect both in vitro and in vivo. (A) Primary neuronal cultures of ventral midbrain from P1 control or Lmx1a/b cKO mice transfected with either control empty vector or a vector expressing Nrf1 (CMV-Nrf1). Redox-sensitive probes (CellROX; green) were used. (Scale bar, 200 μm.) (B and C) Densitometry quantification [corrected total cell fluorescence (CTCF)] of the ROS-sensitive probe (B) and relative percentage of TH+ neurons surviving (C) after 3 DIV in Lmx1a/b F/F primary neuronal cultures where control (CMV-empty) and a Nrf1-expressing vector (CMV-Nrf1) were transfected (n = 5). (D) Representative images (stitched confocal images) of the SNpc from P60 control and Lmx1a/b cKO mice. Tissue was stained for TH (red) and a mitochondrial marker Tom20 (blue) and was probed with an ARP (green) (n = 3). (Scale bar, 20 μm.) (E) TH and GFP labeling from a representative section of Lmx1a/b F/F mice 2 mo after unilateral injection with either AAV Cre-GFP or AAV Cre-GFP-Ires-Nrf1 (stitched confocal images). (Scale bar, 500 μm.) (F) Higher-magnification images of the midbrain from injected mice show no obvious abnormalities in the cell morphology and TH+ neuron distribution following injection of Cre-Nrf1 vector, whereas abnormal and dystrophic neurons were discernible in Cre-injected mice 2 mo after injection. (Scale bar, 20 μm.) (G) Stereological neuronal counting of TH immunoreactive neurons. Data are presented as the percent of mDA neurons in the injected side relative to the noninjected side 6 mo after injection (n = 4). (H) DA axons appear normal in the striatum of mice injected with AAV Cre-GFP-ires-Nrf1. There is no sign of axonal spheroids enriched in α-synuclein 2 mo after injection. (Scale bar, 100 μm.) (I) Immunohistological labeling of phosphorylated α-synuclein at S129 (blue) and TH+ neurons (red) in the midbrain of injected mice. (Scale bar, 20 μm.) (J) Behavioral measurements of horizontal and vertical movements and total traveled distance using an open-field chamber 6 mo after injection.
Fig. S9.
Fig. S9.
(A) Densitometry quantification (CTCF) of a ROS-sensitive probe in TH+ neurons. Primary neuronal cultures of ventral midbrain from P1 control or Lmx1a/b cKO mice were cotransfected with CMV-empty and CMV-mCherry vectors as negative control or with an Nrf1-expressing vector (CMV-Nrf1) and CMV-mCherry. Cultured neurons were treated with redox-sensitive probe (CellROX) (green) and were fixed and immunostained against TH. The probe intensity values were measured in individual neurons that were transfected (mCherry) and were TH+ (n = 14). (B) Transfection efficiency and TH+ neuron number in primary culture. Dissociated primary neurons from the midbrains of Lmx1a/bF/F mice were transfected at DIV 2 with CMV-mCherry. One day following transfection, cells were fixed and stained for TH and Map2. Fifty-four percent of the neurons (Map2) were transfected, and 44.8% of the neurons were TH+.
Fig. S10.
Fig. S10.
(A) Western blotting analysis of LC3-I and LC3-II levels in extracts from the striatum of control and Lmx1a/b cKO mice at P60 (n = 3 animals per genotype). The molecular mass of the protein marker is indicated. (B) Quantification of the relative density of LC3-II. (C) E15.5 mRNA sequencing analysis for the autophagic–lysosomal pathway. Values are shown in RPKM. (D) RT-qPCR analysis showing Atg5, Becn1, and Lamp1 mRNA quantification from LCM mDA neurons of control and Lmx1a/b cKO mice at P1 (n = 3 animals per genotype).
Fig. 7.
Fig. 7.
A putative model of Lmx1a/b function in adult mDA neurons. Lmx1a/b control the expression of key genes involved in mitochondrial functions, and their ablation results in impaired respiratory chain activity, increased oxidative stress, and mitochondrial DNA damage. The predicted larger energetic requirements of mDA neurons make them more vulnerable to mitochondrial dysfunctions. Lmx1a/b deficiency caused axonal pathology characterized by α-synuclein+ inclusions, an autophagy defect followed by progressive loss of dopaminergic neurons.

References

    1. Shulman JM, De Jager PL, Feany MB. Parkinson’s disease: Genetics and pathogenesis. Annu Rev Pathol. 2011;6(1):193–222. - PubMed
    1. Abou-Sleiman PM, Muqit MM, Wood NW. Expanding insights of mitochondrial dysfunction in Parkinson’s disease. Nat Rev Neurosci. 2006;7(3):207–219. - PubMed
    1. Blaess S, Ang SL. Genetic control of midbrain dopaminergic neuron development. Wiley Interdiscip Rev Dev Biol. 2015;4(2):113–134. - PubMed
    1. Hegarty SV, Sullivan AM, O’Keeffe GW. Midbrain dopaminergic neurons: A review of the molecular circuitry that regulates their development. Dev Biol. 2013;379(2):123–138. - PubMed
    1. Doucet-Beaupré H, Lévesque M. 2013. The role of developmental transcription factors in adult midbrain dopaminergic neurons. OA Neurosciences 1(1):3.

Publication types

MeSH terms

LinkOut - more resources