. 2016 Jul 26;113(30):E4311-9.
doi: 10.1073/pnas.1605828113. Epub 2016 Jul 12.

DNA damage tolerance pathway involving DNA polymerase ι and the tumor suppressor p53 regulates DNA replication fork progression

Affiliations

DNA damage tolerance pathway involving DNA polymerase ι and the tumor suppressor p53 regulates DNA replication fork progression

Stephanie Hampp et al. Proc Natl Acad Sci U S A. .

Abstract

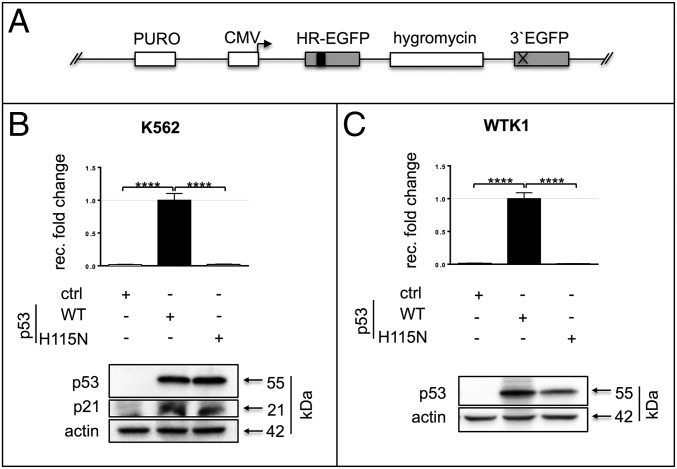
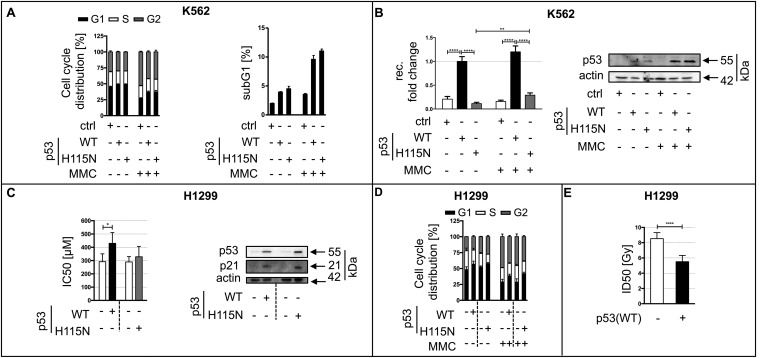
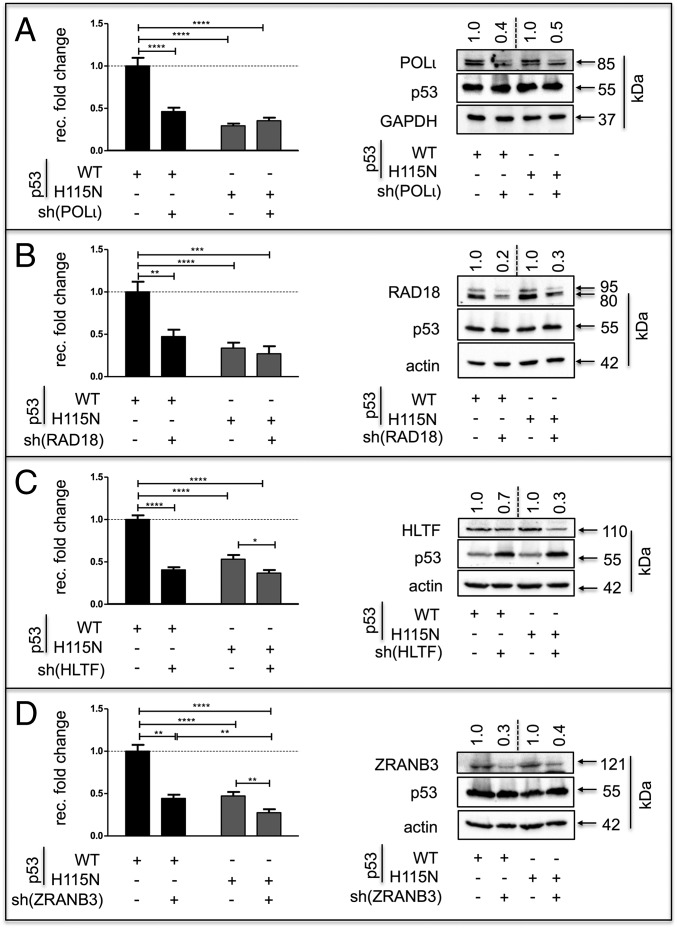
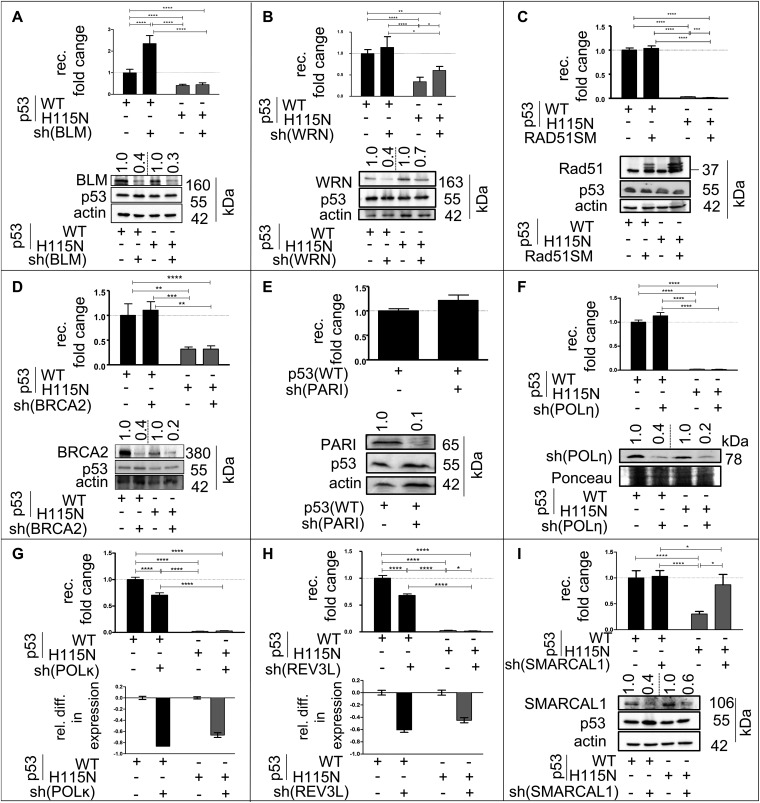
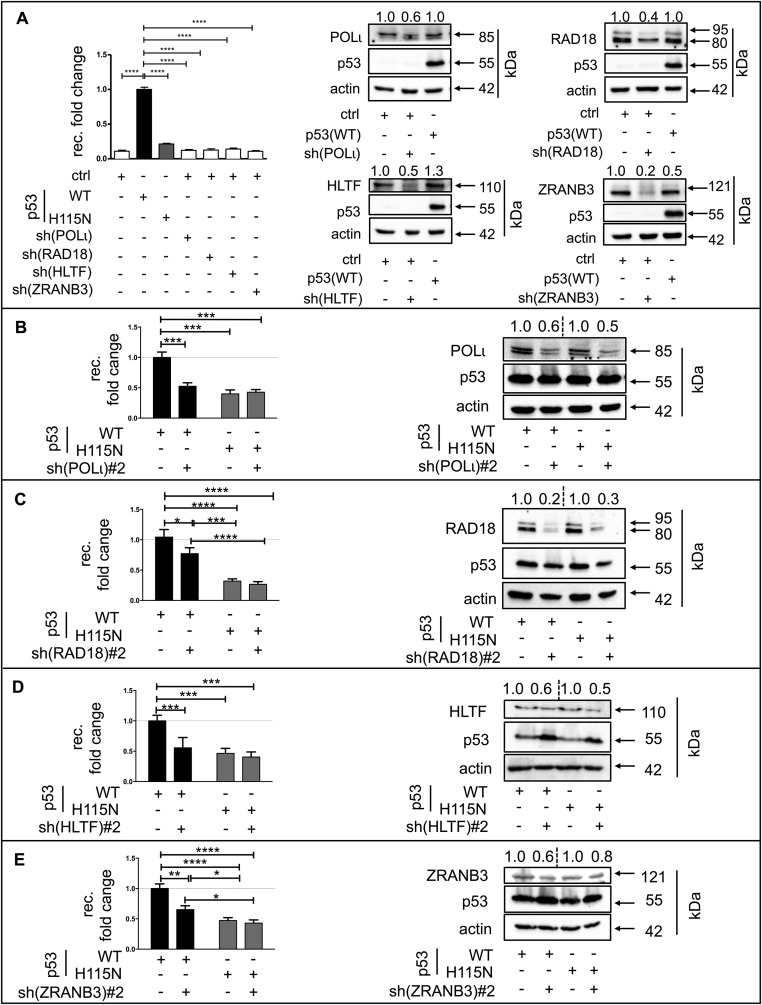
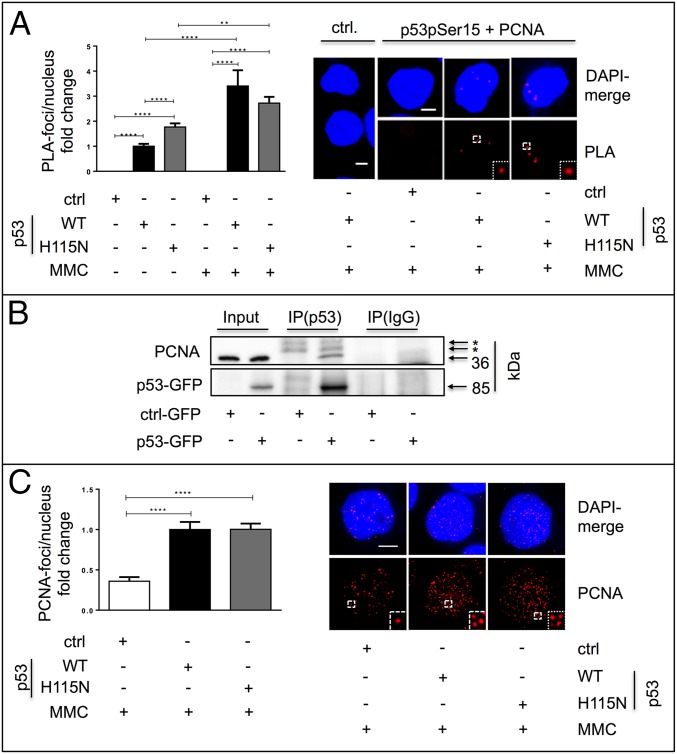
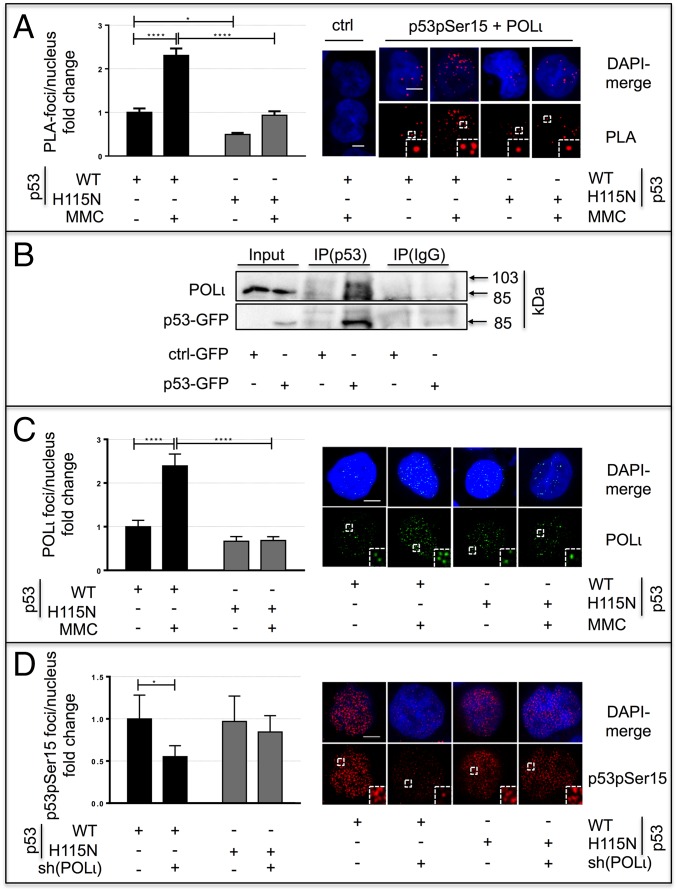
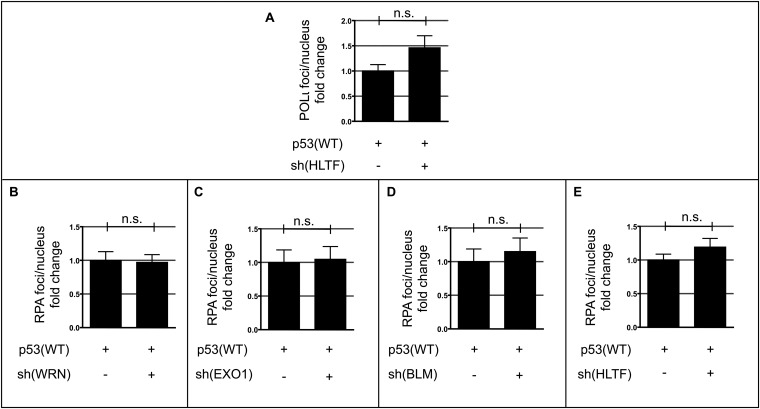
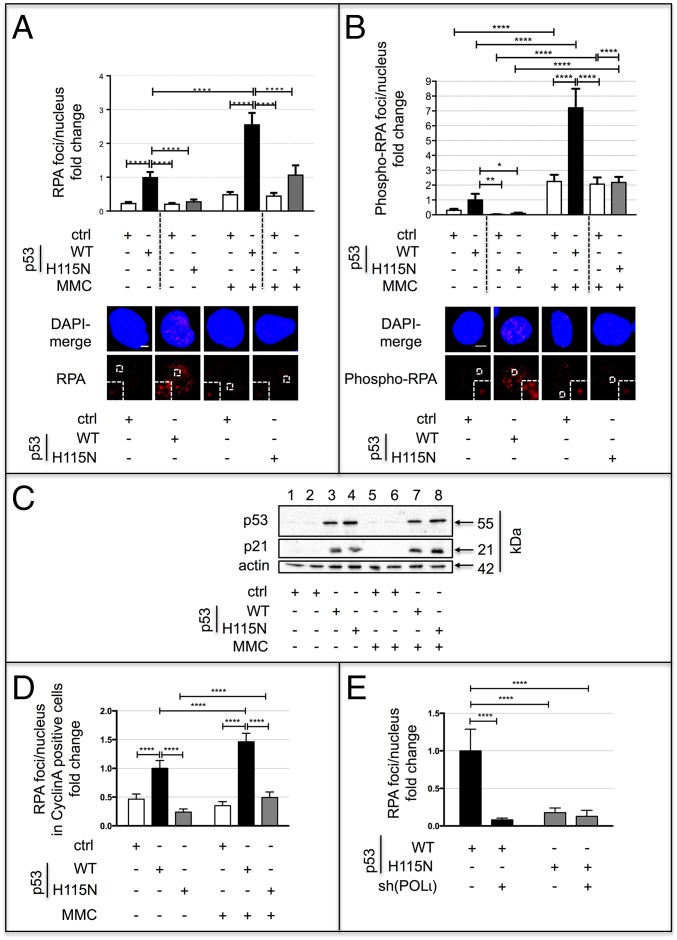
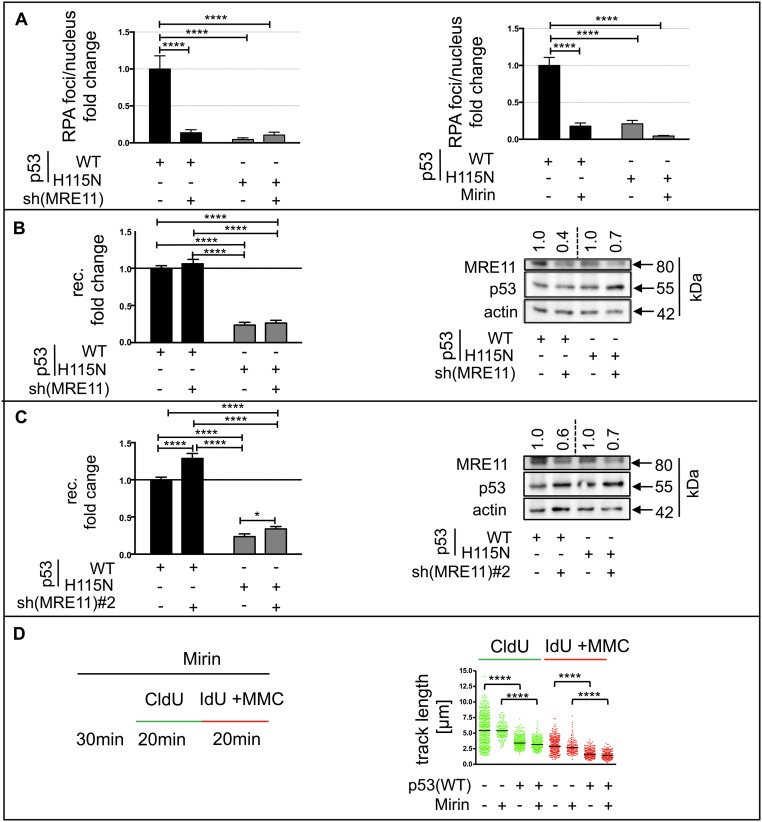
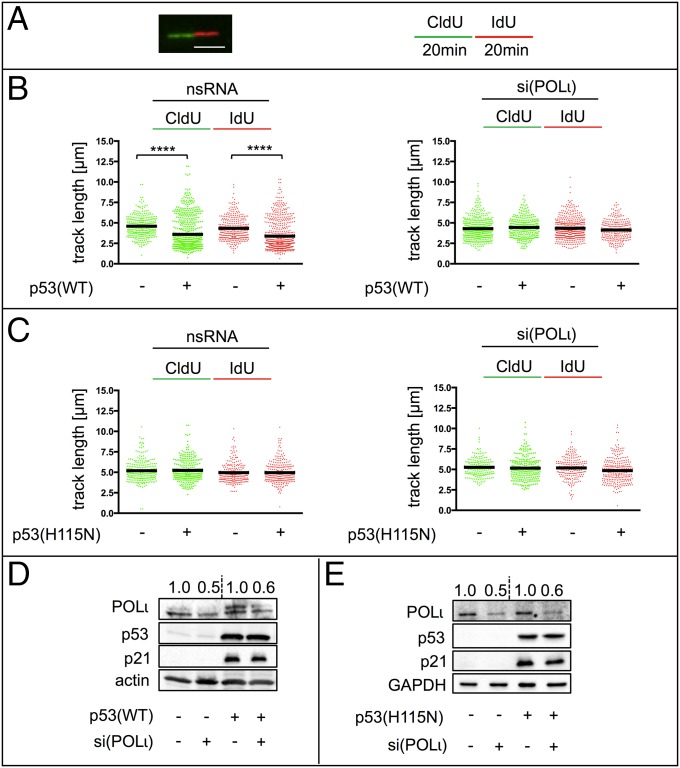
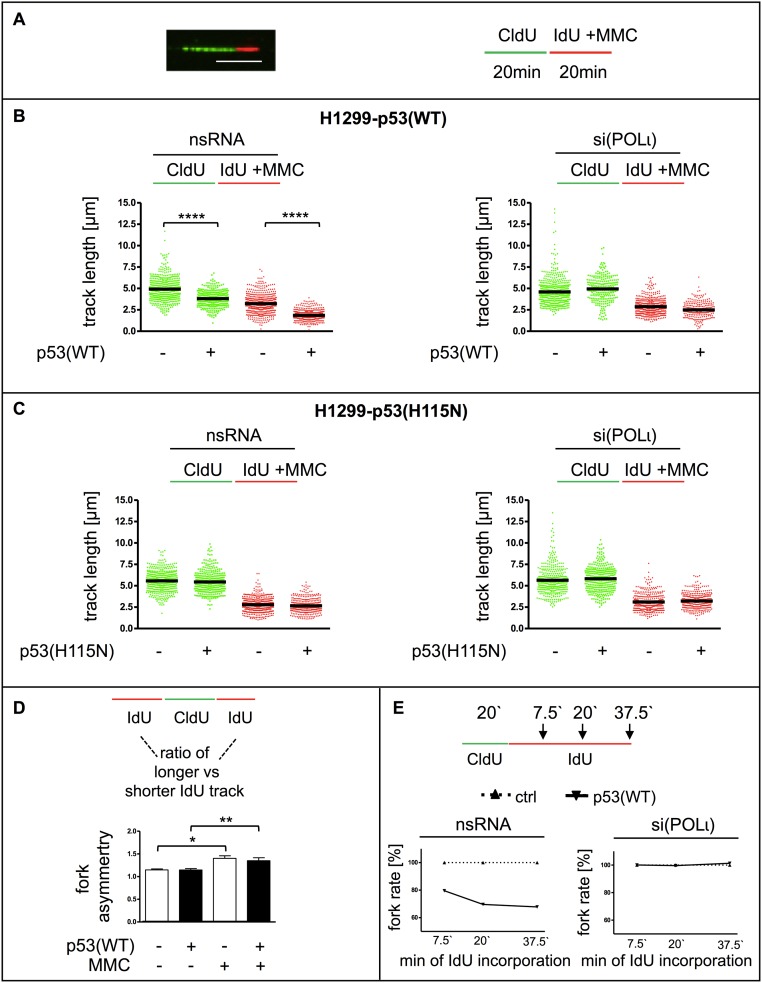
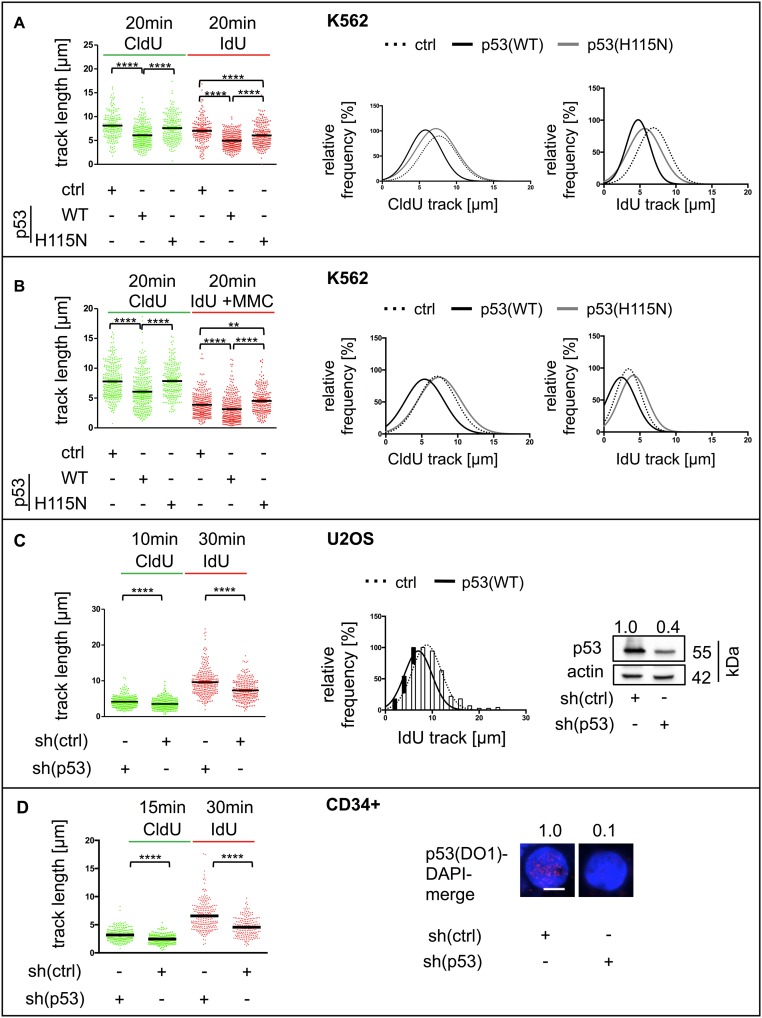
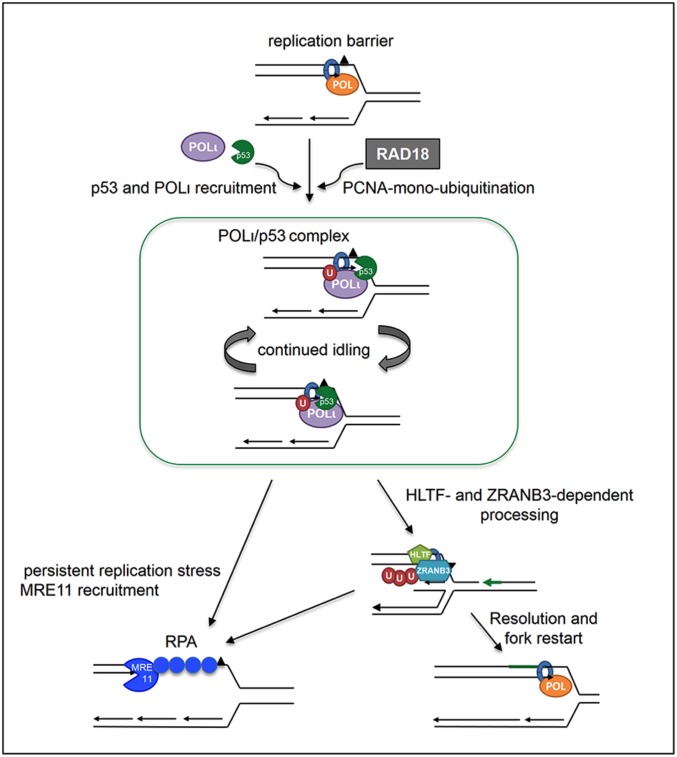
DNA damage tolerance facilitates the progression of replication forks that have encountered obstacles on the template strands. It involves either translesion DNA synthesis initiated by proliferating cell nuclear antigen monoubiquitination or less well-characterized fork reversal and template switch mechanisms. Herein, we characterize a novel tolerance pathway requiring the tumor suppressor p53, the translesion polymerase ι (POLι), the ubiquitin ligase Rad5-related helicase-like transcription factor (HLTF), and the SWI/SNF catalytic subunit (SNF2) translocase zinc finger ran-binding domain containing 3 (ZRANB3). This novel p53 activity is lost in the exonuclease-deficient but transcriptionally active p53(H115N) mutant. Wild-type p53, but not p53(H115N), associates with POLι in vivo. Strikingly, the concerted action of p53 and POLι decelerates nascent DNA elongation and promotes HLTF/ZRANB3-dependent recombination during unperturbed DNA replication. Particularly after cross-linker-induced replication stress, p53 and POLι also act together to promote meiotic recombination enzyme 11 (MRE11)-dependent accumulation of (phospho-)replication protein A (RPA)-coated ssDNA. These results implicate a direct role of p53 in the processing of replication forks encountering obstacles on the template strand. Our findings define an unprecedented function of p53 and POLι in the DNA damage response to endogenous or exogenous replication stress.

Keywords: DNA damage bypass; DNA polymerase idling; nascent DNA elongation; p53; polymerase ι.


Conflict of interest statement

Conflict of interest statement: L.W. is an inventor of a patent on a test system for determining genotoxicities, which is owned by L.W.

Figures

Fig. 1.
Fig. 1.
p53 modulates DNA recombination in different cell types. (A) Schematic presentation of the recombination substrate (HR-EGFP/3′EGFP) chromosomally integrated in K562 cells [K562(HR-EGFP/3′EGFP)], which is used for the determination of recombination fold changes (25). Hygromycin, hygromycin resistance cassette; PURO, puromycin resistance cassette. The kinked arrow points to the promoter; the black square indicates a frame-shifting insertion in the EGFP chromophore coding region generating the inactive variant HR-EGFP; and the cross indicates replacement of the EGFP start codon by two stop codons, resulting in the inactive variant 3′EGFP. (B, Upper) Relative recombination frequencies in K562(HR-EGFP/3′EGFP) transfected with expression plasmids for p53(WT), p53(H115N), or empty vector (ctrl). Recombination (rec.) fold changes were analyzed by flow cytometry via quantification of EGFP+ cells 72 h after transfection. Measurements were individually corrected for transfection efficiencies. Mean values from untreated p53(WT)-expressing samples were set to 1 (absolute mean frequencies are provided in SI Materials and Methods). Data were obtained from 20 measurements. For graphic presentation, calculation of SEM and statistically significant differences via the two-tailed Mann–Whitney U test, we used GraphPad Prism 6.0f software. (B, Lower) p53 protein levels for samples used in recombination experiments. α-Actin served as a loading control. (C, Upper) Recombination fold changes in WTK1(HR-EGFP/3′EGFP) cells with chromosomally integrated recombination substrate. The experimental setup was the same as in B. (C, Lower) Western blot analysis shows p53 expression versus the loading control α-actin. ****P < 0.0001.
Fig. S1.
Fig. S1.
Effect of p53 on cell cycle distribution, recombination after MMC treatment, and cell survival following MMC or γ-ray treatment. (A) Cell cycle analysis in K562(HR-EGFP/3′EGFP) cells transfected with expression plasmids for p53(WT), p53(H115N), or empty vector (ctrl). Forty-eight hours after transfection, cells were mock-treated or MMC-treated (3 μM) for 45 min, washed, and reincubated in fresh media. The cell cycle distribution (Left) and subG1 fractions (Right) were determined by flow cytometry of propidium iodide-stained cells 72 h after transfection. Viable cells were divided into G1 (black), S (white), and G2 (gray) cell cycle phases (presented as percentages). Columns represent mean values and SEM from six measurements. (B, Left) Relative recombination frequencies in K562(HR-EGFP/3′EGFP) cells transfected and treated as described in A. Recombination (rec.) fold changes were analyzed by flow cytometry via quantification of EGFP+ cells 72 h after transfection. Measurements were individually corrected for transfection efficiencies. Mean values from untreated p53(WT)-expressing samples were set to 1 (absolute mean frequency: 2 × 10⁻⁵). Data were obtained from 18 to 20 measurements. For graphic presentation, calculation of SEM and statistically significant differences via the two-tailed Mann–Whitney U test (GraphPad Prism6.0f software) was used. (B, Right) p53 protein levels for samples used in recombination experiments. (C, Left) p53-negative H1299 cells, controlled with tetracycline, expressing p53(WT) or p53(H115N) were treated with increasing doses of MMC (1–1,000 μM) for 45 min, transferred to fresh medium, and subjected to MTT assay 48 h later. IC50 values and SEM were calculated from the results of eight measurements. Statistically significant differences between IC50 values of p53-negative controls and paired p53-expressing cells [(p53(WT)-cell and p53(H115N)-cell clones are separated by stippled lines] were defined using the extra-sum-of-square F test of log IC50 values. (C, Right) Immunoblotting revealing p53 and p21 levels in the presence/absence of tetracycline. (D) Cell cycle analysis in H1299 cell clones with tetracycline-regulated expression of p53(WT) and p53(H115N). Cell cycle distribution was determined by flow cytometry in H1299-cell clones without (−) and with (+) expression of p53(WT) or p53(H115N) [(p53(WT)-cell and p53(H115N)-cell clones separated by stippled lines] following mock treatment or MMC treatment (3 μM, 45 min, 3-h release). Columns represent mean values and SEM from four to six measurements. (E) Radiosensitivity after p53(WT) expression. Cell survival analysis was performed in an H1299-cell clone without or with expression of p53(WT). An MTT assay was performed 6 d after treatment with increasing doses of IR (0.5–16 Gy). Mean ID50 values and SEM were calculated from six measurements using GraphPad Prism6 software. Statistically significant differences between ID50 values of p53-expressing and p53-negative cells were determined using the F test. ****P < 0.0001; **P < 0.01; *P < 0.05.
Fig. 2.
Fig. 2.
Stimulation of recombination by p53 requires POLι, RAD18, HLTF, and ZRANB3. (Left) K562(HR-EGFP/3′EGFP) cells were transfected with expression plasmids for either p53(WT) or p53(H115N), together with shRNA plasmid specific for POLι (A), RAD18 (B), HLTF (C), or ZRANB3 (D). Recombination fold changes were determined as described in Fig. 1. Data were obtained from 12 to 18 measurements. (Right) In all cases, immunoblotting was performed to verify knockdown of specific targets. Relative expression levels are indicated on the top of each panel. GAPDH (A) and α-actin (BD) served as loading controls. ****P < 0.0001; ***P < 0.001; **P < 0.01; *P < 0.05.
Fig. S2.
Fig. S2.
Recombination measurements after down-regulation of different helicases, recombination-related factors, and TLS-POLs. (Upper) Experimental setup and analysis of recombination fold changes were as described in the legend for Fig. 2, except that cells were cotransfected with shRNA (sh) plasmids for down-regulation of BLM (A), WRN (B), BRCA2 (D), PARI (E), POLη (F), POLκ (G), REV3L (H), or SMARCAL1 (I), or with expression plasmid for dominant-negative Rad51SM for inactivation of endogenous RAD51 (C). Bars indicate SEM. Data were obtained from 12 to 30 measurements of each. (Lower) To verify knockdown of respective targets or expression of RAD51/Rad51SM, either immunoblotting (AF and I) or qRT-PCR (G and H) was performed, and results are shown. ****P < 0.0001; ***P < 0.001; **P < 0.01; *P < 0.05.
Fig. S3.
Fig. S3.
Verification of POLι, RAD18, HLTF, and ZRANB3 involvement in p53-mediated recombination. (A) K562(HR-EGFP/3′EGFP) cells were transfected with empty vector or expression plasmids for either p53(WT) or p53(H115N), together with the same shRNA plasmids specific for POLι, RAD18, HLTF, or ZRANB3 used in Fig. 2. Recombination fold changes were determined from 12 measurements. Knockdown of specific targets was verified via Western blot analysis. α-Actin staining served as a loading control. Relative expression levels are indicated on the top of each panel. K562(HR-EGFP/3′EGFP) cells were transfected with expression plasmids for either p53(WT) or p53(H115N), together with shRNA plasmids specific for POLι (B), RAD18 (C), HLTF (D), or ZRANB3 (E) targeting alternative sequences than shRNA plasmids used in Fig. 2 (#2). Recombination fold changes were determined from 12 to 18 measurements. (Right) In all cases, immunoblotting was performed to verify knockdown of specific targets. α-Actin staining served as a loading control. Expression levels relative to the corresponding empty shRNA vector control are indicated on the top of each panel. ****P < 0.0001; ***P < 0.001; **P < 0.01; *P < 0.05.
Fig. 3.
Fig. 3.
Analysis of the interaction between p53 and PCNA. (A) Association of p53pSer15 and PCNA by in situ PLA. After transfection of K562 cells with p53(WT) or p53(H115N) expression vectors or empty vector, the PLA assay was performed to detect interaction between p53pSer15 and PCNA as described in Materials and Methods. Forty-eight hours after transfection, K562 cells were mock-treated or MMC-treated (3 μM, 45 min), released by reincubation for an additional 3 h, and processed for PLA. Negative control (ctrl.) samples were processed accordingly, omitting primary antibodies against p53pSer15 and PCNA. Two hundred nuclei in two independent experiments were scored, whereby mean values from mock-treated p53(WT)-expressing cells were set to 1 (on average, one focus per nucleus). Bars indicate SEM. (Insets) Magnification (2.5×) of the highlighted region. (Scale bars: 5 μm.) (B) Coimmunoprecipitation analysis. Forty-eight hours after transfection with expression vectors for GFP-tagged p53 (p53-GFP) or GFP (ctrl-GFP), p53 was immunoprecipitated from K562 cells using the antibodies DO1 and Pab421, followed by immunoblotting for PCNA and p53. Asterisks indicate unspecific bands. IP, immunoprecipitation. (C) Immunofluorescence microscopy of PCNA signals as a function of the p53 status. Seventy-two hours after transfection with expression plasmids for p53(WT), p53(H115N), or empty vector, K562 cells were treated with MMC (3 μM, 45 min, 3-h release) and processed for immunofluorescence-based microscopy to visualize PCNA foci accumulation. The number of foci per nucleus was quantified using Keyence BZ-II Analyzer software. (Left) Average numbers were calculated from 68 nuclei in two independent experiments. Mean values in p53(WT)-expressing samples were set to 1 (on average, 27 foci per nucleus). Bars indicate SEM. (Right) Representative images with PCNA foci and merged images with a DAPI-stained nucleus are shown. (Insets) Magnification (2.5×) of the highlighted region. (Scale bar: 5 μm.) ****P < 0.0001; **P < 0.01.
Fig. 4.
Fig. 4.
Analysis of the interaction between p53 and POLι. (A) Association of p53pSer15 and POLι by PLA. After transfection of K562 cells with p53(WT) or p53(H115N) expression vectors, the PLA assay was performed to detect interaction between p53pSer15 and POLι as described in Materials and Methods. Forty-eight hours after transfection with expression plasmids for p53(WT) or p53(H115N), K562-cells were mock-treated or MMC-treated (3 μM, 45 min, 3-h release). Negative control samples were processed accordingly, omitting primary antibodies against p53pSer15 and POLι. Two hundred nuclei in two independent experiments were scored, whereby mean values from mock-treated p53(WT)-expressing cells were set to 1 (on average, four foci per nucleus). (Insets) Magnification (2.5×) of the highlighted region. (Scale bars: 5 μm.) (B) POLι was detected in p53-GPF immunoprecipitations after MMC treatment (3 μM, 45 min, 3-h release) of K562 cells. Blots were first incubated with antibody against POLι and then with antibody against p53. (C) Subnuclear distribution of POLι is modulated by the p53 status. K562 cells were transfected and treated as in Fig. 4A, and samples were used for the immunofluorescence-based visualization of POLι-foci accumulation per nucleus. (Left) One hundred nuclei in two independent experiments were scored. (Right) Representative images are displayed. (Insets) Magnification (2.5×) of the highlighted region. Mean values of POLι-foci in p53(WT)-expressing cells after mock treatment were set to 1 (on average, four foci per nucleus). Bars indicate SEM. (Scale bar: 5 μm.) (D) Recruitment of exonuclease-proficient p53 into nuclear foci is affected by silencing of POLι. K562 cells transfected with expression plasmids for p53(WT) or p53(H115N) and with an shRNA plasmid specific for POLι [sh(POLι)] were treated with MMC (3 μM, 45 min, 3-h release). The number of p53pSer15 foci was scored in 100 nuclei and two independent experiments. Quantifications (Left) and representative images (Right) are shown. (Insets) Magnification (2.5×) of the highlighted region. Mean values of p53pSer15-foci in p53(WT)-expressing cells were set to 1. Bars indicate SEM. ****P < 0.0001; *P < 0.05.
Fig. S4.
Fig. S4.
Analysis of nuclear POLι-foci accumulation after HLTF silencing and RPA foci accumulation after knockdown of helicases and exonucleases related to HR. K562 cells were cotransfected with expression plasmid for p53(WT) and shRNA plasmids for HLTF [sh(HLTF), A and E], WRN [sh(WRN), B], EXO1 [sh(EXO1), C] or BLM [sh(BLM), D] to down-regulate expression of the respective targets. Forty-eight hours later, cells were treated with MMC (3 μM, 45 min) and processed for immunofluorescence-based microscopy to visualize POLɩ or RPA-foci accumulation 3 h later. Mean values for controls without knockdown were set to 1. n.s., not significant. Bars indicate SEM. (A) POLɩ-foci after HLTF knockdown. (B) RPA-foci after WRN knockdown. (C) RPA-foci after EXO1 knockdown. (D) RPA-foci after BLM knockdown. (E) RPA-foci after HLTF knockdown.
Fig. 5.
Fig. 5.
Effect of p53 and POLι on ssDNA accumulation. (A) Accumulation of RPA foci in H1299-cell clones. H1299 cells, controlled with tetracycline, expressing or not expressing either p53(WT) or p53(H115N) were mock-treated or MMC-treated (3 μM, 45 min, 3-h release) and processed for the detection of RPA foci accumulation. (Upper) Number of RPA foci per nucleus was quantified and expressed as fold changes. (Lower) Representative images with 2.5-fold enlarged magnifications (Insets) of highlighted regions for MMC-treatment are shown. Mean values for p53(WT)-expressing cells after mock treatment were defined as 1 (on average, eight foci per nucleus). Bars indicate SEM. Stippled lines separate individual cell clones with and without tetracycline treatment for suppression (−) and release (+) of p53 [p53(WT) and p53(H115N)] expression, respectively. (Scale bar: 5 μm.) (B) RPA-phospho-Ser33 focal accumulation. H1299-cell clones expressing or not expressing p53(WT) or p53(H115N) were subjected to mock or MMC treatment (3 μM, 45 min, 3-h release). Samples were inspected for phospho-RPA foci accumulation as in A. Mean values for p53(WT)-expressing cells after mock treatment were defined as 1 (on average, six foci per nucleus). Bars indicate SEM. Stippled lines separate cell clones with and without tetracycline treatment for suppression (−) and release (+) of p53 expression. (Scale bar: 5 μm.) (C) p53 protein levels in tetracycline-regulated H1299-cell clones. H1299-cell clones were treated with or without tetracycline for suppression of p53 expression [lanes 1 and 5, p53(WT) clone; lanes 2 and 6, p53(H115N) clone] and release of p53 expression [lanes 3 and 7, p53(WT) clone; lanes 4 and 8, p53(H115N) clone], respectively. After mock or MMC treatment (3 μM, 45 min, 3-h release), cells were lysed and subjected to immunoblotting to visualize p53 and p21 protein levels. α-Actin served as a loading control. (D) RPA foci analysis in K562 cells. K562 cells transfected with p53(WT) or p53(H115N) expression vector were mock-treated or MMC-treated (3 μM, 45 min, 3-h release) and processed for immunofluorescence-based microscopy to visualize RPA foci, which were quantified in cyclin A-costained cells. Mean values for p53(WT)-expressing cells after mock treatment were defined as 1 (on average, 14 foci per nucleus). (E) RPA foci formation after down-regulation of POLι. K562 cells were transfected with shRNA plasmid specific for POLι [sh(POLι)] and either p53(WT) or p53(H115N) expression plasmids, followed by MMC treatment (3 μM, 45 min, and 3-h release). Mean values for p53(WT)-expressing cells were defined as 1 (on average, nine foci per nucleus). ****P < 0.0001; **P < 0.01; *P < 0.05.
Fig. S5.
Fig. S5.
Effect of the MRE11 status on the p53-mediated RPA-foci accumulation, recombination efficiency, and DNA elongation rate. (A, Left) RPA-foci formation. K562 cells were transfected with p53(WT) or p53(H115N) expression plasmid and the shRNA plasmid specific for MRE11 [sh(MRE11)]. Forty-eight hours later, cells were treated with MMC (3 μM, 45 min) and processed for immunofluorescence microscopy to visualize RPA-foci accumulation 3 h later. (A, Right) For the catalytic inhibition of MRE11-exonuclease activity, cells were treated with Mirin (100 μM) starting 30 min before MMC treatment. Bars indicate SEM. (B and C) p53(WT)-mediated recombination. (Left) Experimental setup and analysis of recombination fold changes were as described in the legend for Fig. 2, except that cells were cotransfected with two different shRNA plasmids for down-regulation of MRE11 [sh(MRE11) in B; sh(MRE11)#2 in C]. Data were obtained from 18 measurements. (Right) To verify MRE11 down-regulation, immunoblotting was performed, and results are shown. Bars indicate SEM. (D) Track length distribution of CldU/IdU-labeled cells. DNA fiber-spreading assay was performed in H1299(p53WT) cells in the presence or absence of tetracycline for suppression (−) and release (+) of p53(WT) expression. For inhibition of MRE11-exonuclease activity, Mirin was added 30 min before and was kept throughout the whole length of the experiment. During IdU labeling, cells were treated with MMC (3 μM). Experimental setup and calculation of statistically significant differences were as described in the legend for Fig. 6. Mean values were calculated by measurement of ≥171 single DNA fibers. ****P < 0.0001; *P < 0.05.
Fig. 6.
Fig. 6.
p53 modulates nascent DNA elongation. A DNA fiber-spreading assay was performed in H1299-cell clones inducibly expressing p53(WT) or p53(H115N), which had been transfected with nonspecific RNA [nsRNA; B (Left) and C (Left)] or siRNA specific for POLι [si(POLι); B (Right) and C (Right)] 48 h previously. Mean values were calculated by measuring fiber track lengths of ≥250 single fibers in two independent experiments [Left, 5-chloro-2-deoxyuridine (CldU); Right, IdU]. Statistically significant differences between p53-negative control cells and p53-expressing cells were calculated using Dunn’s test. (A) Representative fiber image and a schematic overview illustrate the technical procedure. (Scale bar: 5 μm.) (B) H1299-cell clone without and with p53(WT) expression. ****P < 0.0001. (C) H1299-cell clone without and with p53(H115N) expression. (D) POLι, p53, and p21 protein levels. Knockdown of POLι in H1299 cells without and with p53(WT) expression was examined by Western blot analysis. α-Actin served as a loading control. (E) POLι, p53, and p21 protein levels. Knockdown of POLι in H1299 cells without and with p53(H115N) expression was examined by Western blot analysis. GAPDH served as a loading control.
Fig. S6.
Fig. S6.
p53 modulates nascent DNA elongation after MMC treatment. A DNA fiber-spreading assay was performed in H1299 cells without or with tetracycline-regulated expression of p53(WT) or p53(H115N) and 48 h after transfection with nonspecific RNA (nsRNA; B, Left and C, Left) or siRNA specific for POLι [si(POLι), B, Right and C, Right]. Mean values and SEM were obtained by measuring fiber track lengths of ≥250 single fibers in two independent experiments (CldU, Left; IdU, Right). Statistically significant differences between p53-negative control cells and p53-expressing cells were calculated using Dunn’s test. (A) Representative fiber image and a schematic overview illustrate the technical procedure. (Scale bar: 5 μm.) (B) H1299-cell clone without and with p53(WT) expression. (C) H1299-cell clone without and with p53(H115N) expression. (D) Graphic presentation of fork asymmetry in H1299 cells. DNA fibers from the experiment in B and Fig. 6 were reanalyzed regarding fork asymmetry, comparing track lengths of IdU incorporation (red) departing from the same origin (green, CldU track). (Upper) Schematic overview. (Lower) Graph shows the ratio of longer track versus shorter track lengths. (E) Graphic presentation of relative FRs calculated from total track lengths of time-course experiments after MMC treatment in H1299 cells. The mean p53-negative control value for each time point was set to 100% [corresponding to 0.57 kb⋅min1, 0.53 kb⋅min1, and 0.47 kb⋅min1 in nsRNA-transfected cells and 0.59 kb⋅min1, 0.48 kb⋅min1, and 0.49 kb⋅min1 in si(POLɩ)-transfected cells for sample retrieval after 7.5 min, 20 min, and 37.5 min, respectively].
Fig. S7.
Fig. S7.
DNA fiber-spreading experiments in K562, U2OS, and CD34+ cells. (A) DNA fiber-spreading analysis in K562 cells after mock treatment. Cells were transfected with expression plasmids for p53(WT), p53(H115N), or empty vector. (Left) Graphic presentation shows track lengths obtained from ≥275 fibers (n = 3). Bars indicate SEM. (Right) Corresponding lengths of nascent DNA replication tracks plotted as the distribution of relative track length frequency, whereby the maximum value of the bin center of each dataset was defined as 100%. (B) DNA fiber-spreading analysis in K562 cells after MMC treatment. The experimental procedure and graphic presentation were the same as used in A, except that cells were MMC-treated during IdU labeling. (C) DNA fiber-spreading analysis as a function of endogenous p53 in U2OS cells. Cells transfected with p53 shRNA plasmid [sh(p53)] or empty vector [sh(ctrl)] were subjected to DNA fiber-spreading analysis. Mean values from ≥293 fibers (n = 3). Bars indicate SEM. (Center) Relative IdU track length frequency is shown, whereby the maximum value of the bin center of the dataset was set to 100%. (Right) p53 knockdown was verified by Western blot. (D, Left) DNA fiber-spreading analysis as a function of endogenous p53 in CD34+ cells. Cycling C34+ human hematopoietic stem and progenitor cells, nucleofected with p53 shRNA plasmid or empty vector were subjected to DNA fiber-spreading analysis. Mean values from ≥198 fibers obtained from three cord blood-derived samples. (Right) p53 knockdown was verified via immunofluorescence signal intensities per 50 nuclei each (i.e., mAb DO1-positivity in 50 DAPI-stained nuclei). Representative images are shown. (Scale bars: 5 μm.) ****P < 0.0001; **P < 0.01.
Fig. 7.
Fig. 7.
Model for p53-mediated resolution of replication barriers. When encountering replication barriers, the replication machinery stops, triggering PCNA monoubiquitination (U) and recruitment of p53, which is followed by POLι. The p53–POLι complexes favor continued idling, leading to polyubiquitination of PCNA (chain of U’s) via HLTF; subsequently, to error-free resolution/bypass via HLTF and ZRANB3; and, finally, to replication restart. Current models of the ZRANB3-mediated DNA damage tolerance pathway (63, 67) suggest that the structure-specific endonuclease of ZRANB3 introduces a nick into the unreplicated template strand ahead of the fork, which serves as a primer end for displacement DNA synthesis (green arrow). Concomitantly, ZRANB3, together with HLTF, promotes fork reversal. As a result, the replication-blocking lesion is replaced by a patch of newly synthesized DNA (green line), thus permitting unrestricted progression of the restarted fork. Persistent replication stress can alternatively lead to MRE11-dependent ssDNA formation, which is coated by RPA.

Similar articles

Cited by

References

    1. Lane DP. Cancer. p53, guardian of the genome. Nature. 1992;358(6381):15–16. - PubMed
    1. Mummenbrauer T, et al. p53 protein exhibits 3′-to-5′ exonuclease activity. Cell. 1996;85(7):1089–1099. - PubMed
    1. Skalski V, Lin ZY, Choi BY, Brown KR. Substrate specificity of the p53-associated 3′-5′ exonuclease. Oncogene. 2000;19(29):3321–3329. - PubMed
    1. Bakhanashvili M. Exonucleolytic proofreading by p53 protein. Eur J Biochem. 2001;268(7):2047–2054. - PubMed
    1. Khare V, Eckert KA. The proofreading 3′-->5′ exonuclease activity of DNA polymerases: A kinetic barrier to translesion DNA synthesis. Mutat Res. 2002;510(1-2):45–54. - PubMed

Publication types

MeSH terms