

Liver fat accumulation in response to overfeeding with a high-fat diet: a comparison between South Asian and Caucasian men
- PMID: 27408613
- PMCID: PMC4940726
- DOI: 10.1186/s12986-015-0015-4
Liver fat accumulation in response to overfeeding with a high-fat diet: a comparison between South Asian and Caucasian men
Abstract
Background: South Asians were reported to have a higher liver fat content as compared to BMI-matched Caucasians. This study compared the increase in liver fat content in response to overfeeding with a high fat diet in South Asian and Caucasian men when matched for body fat percentage.
Methods: Ten South Asian men (BMI 18-29 kg/m(2)) and 10 Caucasian men (BMI 22-33 kg/m(2)), aged 20-40 y, matched for body fat percentage, were included. A weight maintenance diet was given for 3 days based on the individual energy requirement. Individual energy requirement of the subjects was calculated based on their body composition (measured by hydro densitometry and deuterium dilution) and activity counts (accelerometer). Liver fat content was measured before and after 4 days of overfeeding (50 % excess energy need) with a high fat diet (60 % energy from fat). Fat distribution was measured by anthropometry and an MRI scan of the abdomen while liver fat content using 1H-MRS.
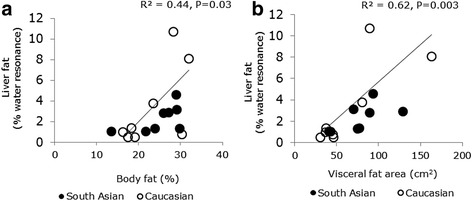
Results: While having a similar body fat % (P = 0.58), South Asians had a lower BMI (P = 0.04) than Caucasians. Liver fat content at baseline did not differ between ethnicities (P = 0.48) and was associated with visceral fat area (P = 0.002, R(2) = 0.56) but not with ethnicity (P = 0.13). Overfeeding with a high fat diet significantly increased liver fat (P = 0.01) but the increase did not differ between ethnicities (P = 0.47). There was no difference in the total abdominal fat area (P = 0.37), subcutaneous abdominal fat area (P = 0.18) and visceral fat area (VAT, P = 0.32). However as a percentage of the total abdominal fat area, VAT was higher in South Asians (P = 0.003).
Conclusion: Despite a relatively higher percentage of visceral fat area, liver fat increased similarly in South Asian and Caucasian men in response to overfeeding with a high fat diet.
Trial registration: The study was registered in the public trial registry www.ccmo.nl No. NL31217.068.10.
Keywords: Body fat distribution; Liver fat content; Overfeeding; South Asian men.
Figures

References
-
- Popkin BM. Global nutrition dynamics: the world is shifting rapidly toward a diet linked with noncommunicable diseases. Am J Clin Nutr. 2006;84:289–98. - PubMed
-
- Wulan SN, Westerterp KR, Plasqui G. Dietary and 24-h fat oxidation in Asians and whites who differ in body composition. Am J Clin Nutr. 2012;95:1335–41. - PubMed
LinkOut - more resources
Full Text Sources
Other Literature Sources
