. 2016 Apr 22;5(7):538-551.
doi: 10.1016/j.molmet.2016.04.006. eCollection 2016 Jul.

Branched-chain amino acid restriction in Zucker-fatty rats improves muscle insulin sensitivity by enhancing efficiency of fatty acid oxidation and acyl-glycine export

Affiliations

Branched-chain amino acid restriction in Zucker-fatty rats improves muscle insulin sensitivity by enhancing efficiency of fatty acid oxidation and acyl-glycine export

Phillip J White et al. Mol Metab. .

Abstract

Objective: A branched-chain amino acid (BCAA)-related metabolic signature is strongly associated with insulin resistance and predictive of incident diabetes and intervention outcomes. To better understand the role that this metabolite cluster plays in obesity-related metabolic dysfunction, we studied the impact of BCAA restriction in a rodent model of obesity in which BCAA metabolism is perturbed in ways that mirror the human condition.

Methods: Zucker-lean rats (ZLR) and Zucker-fatty rats (ZFR) were fed either a custom control, low fat (LF) diet, or an isonitrogenous, isocaloric LF diet in which all three BCAA (Leu, Ile, Val) were reduced by 45% (LF-RES). We performed comprehensive metabolic and physiologic profiling to characterize the effects of BCAA restriction on energy balance, insulin sensitivity, and glucose, lipid and amino acid metabolism.

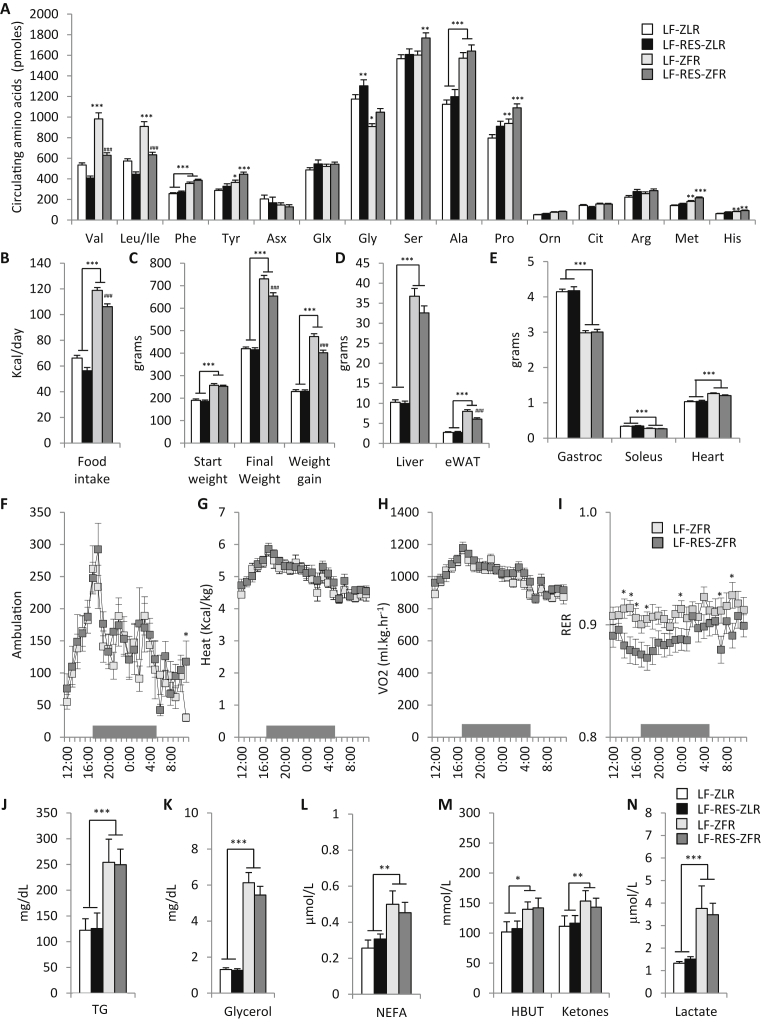
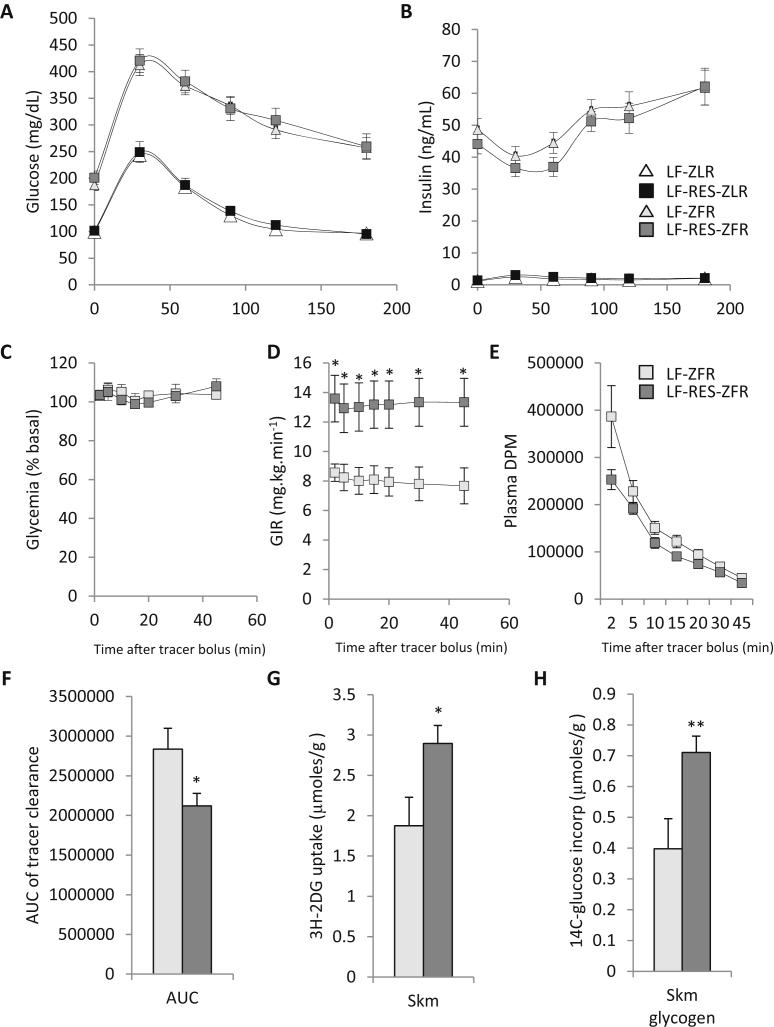
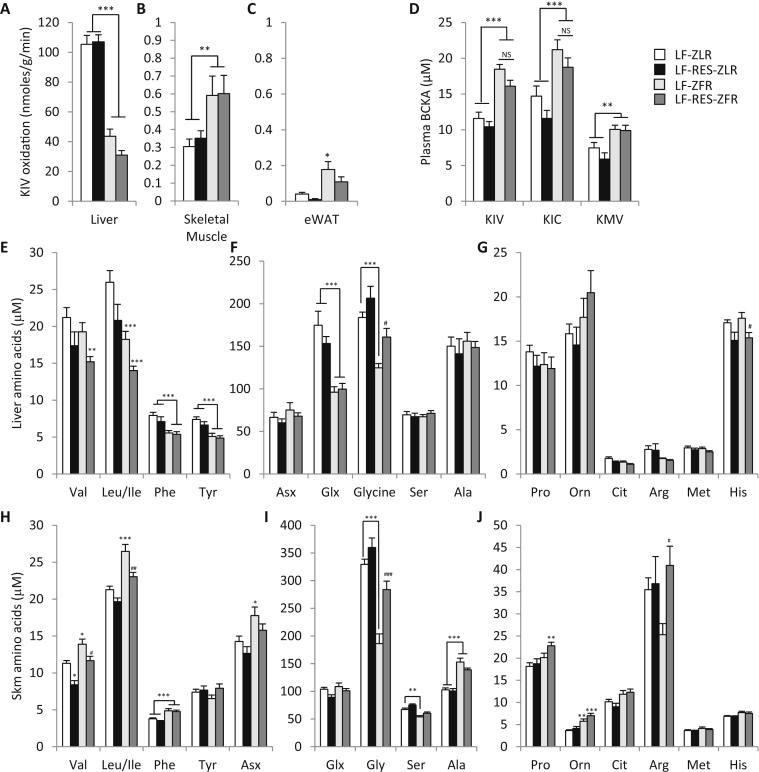
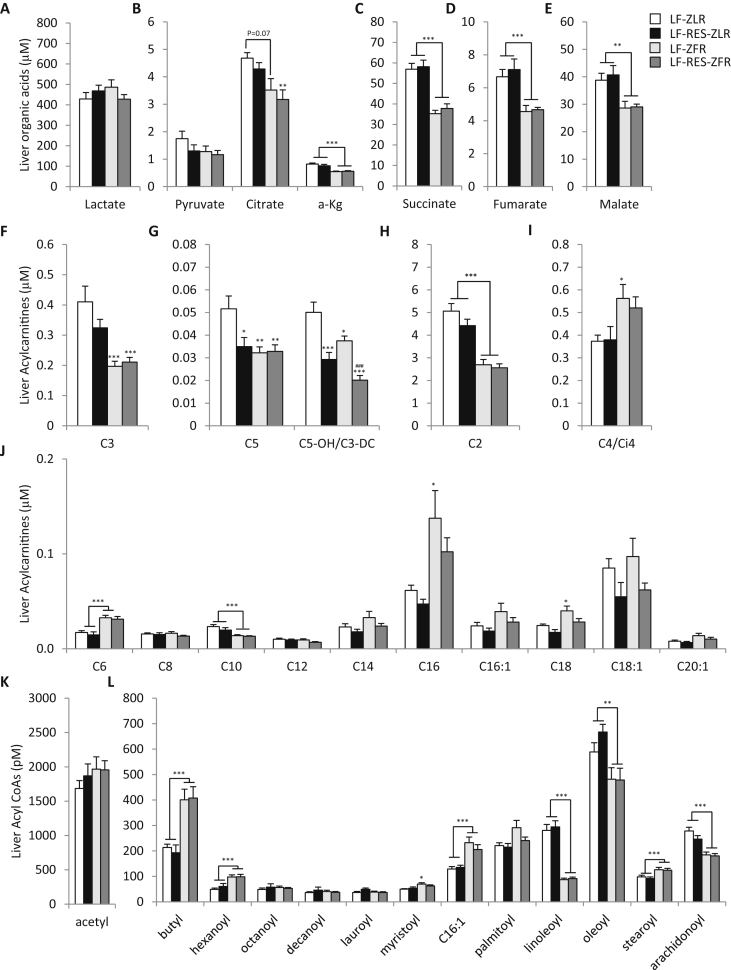
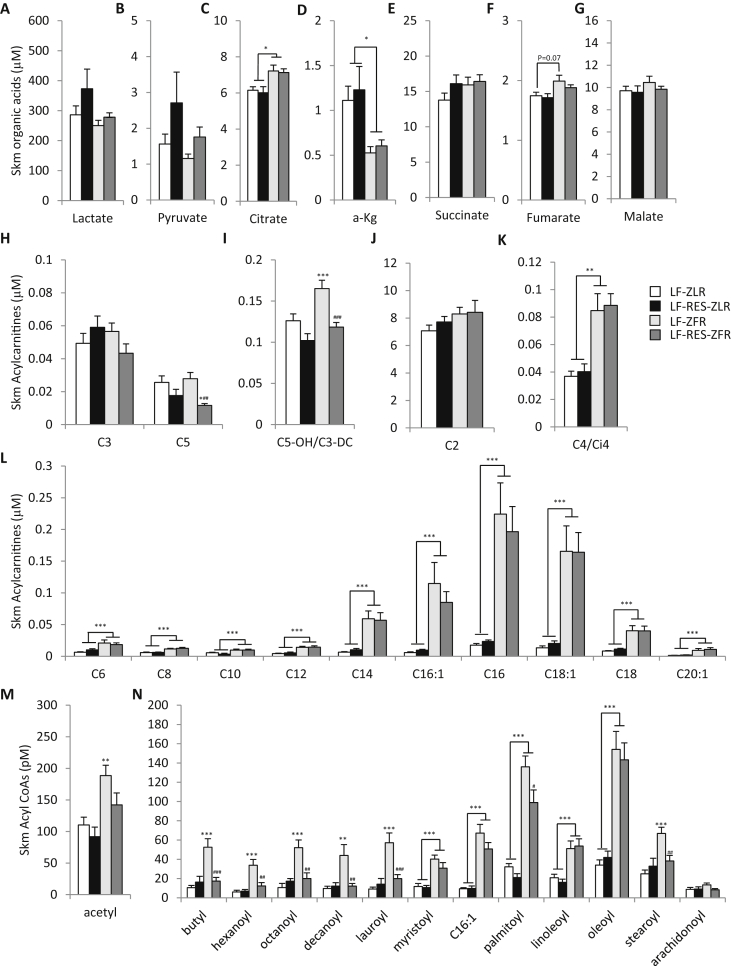
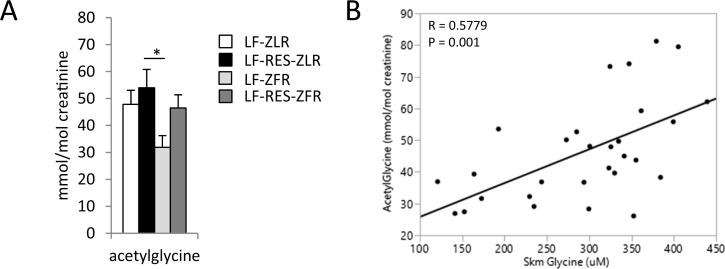
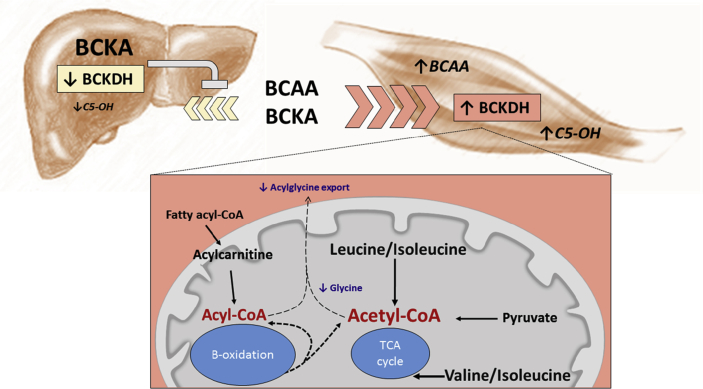
Results: LF-fed ZFR had higher levels of circulating BCAA and lower levels of glycine compared to LF-fed ZLR. Feeding ZFR with the LF-RES diet lowered circulating BCAA to levels found in LF-fed ZLR. Activity of the rate limiting enzyme in the BCAA catabolic pathway, branched chain keto acid dehydrogenase (BCKDH), was lower in liver but higher in skeletal muscle of ZFR compared to ZLR and was not responsive to diet in either tissue. BCAA restriction had very little impact on metabolites studied in liver of ZFR where BCAA content was low, and BCKDH activity was suppressed. However, in skeletal muscle of LF-fed ZFR compared to LF-fed ZLR, where BCAA content and BCKDH activity were increased, accumulation of fatty acyl CoAs was completely normalized by dietary BCAA restriction. BCAA restriction also normalized skeletal muscle glycine content and increased urinary acetyl glycine excretion in ZFR. These effects were accompanied by lower RER and improved skeletal muscle insulin sensitivity in LF-RES fed ZFR as measured by hyperinsulinemic-isoglycemic clamp.

Conclusions: Our data are consistent with a model wherein elevated circulating BCAA contribute to development of obesity-related insulin resistance by interfering with lipid oxidation in skeletal muscle. BCAA-dependent lowering of the skeletal muscle glycine pool appears to contribute to this effect by slowing acyl-glycine export to the urine.

Keywords: BCAA; Insulin sensitivity; Metabolism; Obesity.


Figures

Figure 1
Figure 1
Effect of Zucker-fatty genotype and BCAA restriction on circulating amino acids and energy balance. Male Zucker-lean rats (ZLR) or Zucker-fatty rats (ZFR) were fed a custom low fat (LF) diet or an isonitrogenous isocaloric LF diet in which BCAA were restricted by 45% (LF-RES). (A) Circulating amino acid profiles. (B) Daily food intake (kcal/day). (C) Starting weight, final weight, and total weight gain (grams). (D) Liver and epididymal adipose tissue (eWAT) weights (grams). (E) Gastrocnemius, soleus and heart tissue weights (grams). n = 12–28 per group (F) Ambulation (total x and y beam breaks), (G) Heat (kcal/kg), (H) VO2 (mL/kg/hr), and (I) Respiratory exchange ratio (RER) measured hourly during a 24 h cycle following a 24 h acclimation period in the metabolic cages, during which the dark period was from 5PM to 5AM as shown by the gray bar, n = 9–12 per group. (J) Plasma triglycerides (TG; mg/dL), (K) glycerol (mg/dL), (L) non-esterified fatty acids (NEFA; μM/L), (M) hydroxybutyrate and ketones (mmol/L), and (N) lactate (μM/L), n = 9–15 per group. Data represent mean ± SEM. Statistical differences indicated by: *: P < 0.05, **: P < 0.01, ***: P < 0.001 comparisons indicated by the connecting lines or in the absence of connecting lines vs LF-ZLR, and #: P < 0.05, ##: P < 0.01, ###: P < 0.001 vs LF-ZFR.
Figure 2
Figure 2
BCAA restriction improves skeletal muscle insulin sensitivity in Zucker-fatty rats. Male Zucker-lean rats (ZLR) and Zucker-fatty rats (ZFR) were studied on a custom low fat (LF) diet or an isonitrogenous, isocaloric LF diet in which BCAA were restricted by 45% (LF-RES). Panels A–B show results of a 1 g/kg intraperitoneal glucose tolerance test (IPGTT) performed in week 10 on the diets, whereas panels C–G show results of a hyperinsulinemic-isoglycemic clamp experiment, carried out in weeks 14 and 15, during which [U-14C] glucose and 3H 2-deoxyglucose were included as tracers (clamp data shown only for ZFR). (A) Glucose (mg/dL) and (B) insulin (ng/mL) excursions during the IPGTT, n = 10–27 per group. (C) Blood glucose during the clamp, expressed as percent of starting value; (D) glucose infusion rate (GIR; mg/kg/min), and (E) tracer disappearance (Plasma DPM) during the steady state period following tracer injection of the clamp; n = 5–6 per group. (F) Area under the tracer disappearance curve (from panel E). (G) 3H-2-deoxyglucose uptake in gastrocnemius muscle (μmoles/g). (H) [U-14C]-glucose conversion to glycogen in gastrocnemius muscle (μmoles/g). Data represent mean ± SEM, statistical differences indicated by: *: P < 0.05, **: P < 0.01 vs LF-ZFR.
Figure 3
Figure 3
Effect of Zucker-fatty genotype and BCAA restriction on tissue BCKDH activity and amino acid profiles and on plasma BCKA levels. Tissue branched chain keto acid dehydrogenase (BCKDH) activity, plasma branched chain keto acid content (BCKA) and liver and skeletal muscle amino acid profiles were evaluated in ZLR or ZFR fed the LF or LF-RES diets. (A) Liver, (B) skeletal muscle, and (C) adipose tissue BCKDH activity measured by 14CO2 produced by tissue extracts incubated with [1-14C] α-keto-isovalerate (KIV), n = 8–14 per group. (D) Plasma concentration of the branched chain keto acids (BCKA), α-keto-isovalerate (KIV), α-keto-isocaproate (KIC), and α-keto-methylvalerate (KMV), n = 9–15 per group. (E–G) Liver amino acid levels. (H–J) Skeletal muscle amino acid levels. n = 9–15 per group. Data represent mean ± SEM. Statistical differences indicated by: *: P < 0.05, **: P < 0.01, ***: P < 0.001 comparisons indicated by the connecting lines or in the absence of connecting lines vs LF-ZLR, and #: P < 0.05, ##: P < 0.01, ###: P < 0.001 vs LF-ZFR.
Figure 4
Figure 4
BCAA restriction has little impact on hepatic metabolites in Zucker-fatty rats. Hepatic metabolites were measured in male ZFR or ZLR fed the LF or LF-Res diets. (A–E) Hepatic organic acid levels; (F–I) Hepatic short chain acylcarnitine levels; (J) Hepatic medium-long chain acylcarnitines. (K–L) Hepatic fatty acyl CoA's. n = 9–15 per group. Data represent mean ± SEM. Statistical differences indicated by: *: P < 0.05, **: P < 0.01, ***: P < 0.001 comparisons indicated by the connecting lines or in the absence of connecting lines vs LF-ZLR, and ###: P < 0.001 vs LF-ZFR.
Figure 5
Figure 5
BCAA restriction abrogates even-chain acyl CoA accumulation in skeletal muscle of Zucker-fatty rats. Metabolites were measured in gastrocnemius muscle from male ZFR or ZLR fed LF or LF-Res diets. (A–G) Organic acid levels. (H–K) Short chain acylcarnitine levels. (L) Medium-long chain acylcarnitine levels. (M–N) Fatty acyl CoA levels. n = 9–15 per group. Data represent mean ± SEM. Statistical differences indicated by: *: P < 0.05, **: P < 0.01, ***: P < 0.001 comparisons indicated by the connecting lines or in the absence of connecting lines vs LF-ZLR, and #: P < 0.05, ##: P < 0.01, ###: P < 0.001 vs LF-ZFR.
Figure 6
Figure 6
Acyl-glycine levels in the urine correlate with skeletal muscle glycine content. We measured acetylglycine content in urine collected from male ZFR or ZLR fed LF or LF-RES diets. (A) Urinary acetylglycine (mmol/mol creatinine). (B) Scatterplot showing positive linear correlation between urinary acetylglycine and skeletal muscle glycine content. n = 8 per group. Data represent mean ± SEM. Statistical differences indicated by: *: P < 0.05, comparisons indicated by the connecting lines.
Figure 7
Figure 7
Working model of metabolic mechanism of BCAA-driven skeletal muscle insulin resistance. Obesity-driven inhibition of hepatic BCKDH activity lowers hepatic uptake of BCAA leading to lower tissue levels of BCAA and their metabolic byproducts, particularly C5-OH carnitine, causing BCAA and their α-keto acids (BCKAs) to rise in circulation and accumulate in skeletal muscle. The obesity-driven increase in skeletal muscle BCKDH activity combined with higher tissue BCAA supply results in higher BCAA oxidative flux, reflected by increased C5-OH. This “BCAA overload” in skeletal muscle interferes with the complete oxidation of fatty acids, leading to accumulation of even chain fatty acyl CoAs in skeletal muscle. This effect is compounded by BCAA-driven depletion of skeletal muscle glycine levels, which limits acyl CoA excretion as acyl-glycines in the urine. BCAA restriction improves muscle insulin sensitivity by relieving substrate pressure and raising glycine levels, leading to normalization of muscle acyl CoA content.

References

    1. Felig P., Marliss E., Cahill G.F. Plasma amino acid levels and insulin secretion in obesity. The New England Journal of Medicine. 1969;281(15):811–816. - PubMed
    1. Newgard C.B., An J., Bain J.R., Muehlbauer M.J., Stevens R.D., Lien L.F. A branched-chain amino acid-related metabolic signature that differentiates obese and lean humans and contributes to insulin resistance. Cell Metabolism. 2009;9(4):311–326. - PMC - PubMed
    1. Huffman K.M., Shah S.H., Stevens R.D., Bain J.R., Muehlbauer M., Slentz C.A. Relationships between circulating metabolic intermediates and insulin action in overweight to obese, inactive men and women. Diabetes Care. 2009;32(9):1678–1683. - PMC - PubMed
    1. Tai E.S., Tan M.L.S., Stevens R.D., Low Y.L., Muehlbauer M.J., Goh D.L.M. Insulin resistance is associated with a metabolic profile of altered protein metabolism in Chinese and Asian-Indian men. Diabetologia. 2010;53(4):757–767. - PMC - PubMed
    1. Wang T.J., Larson M.G., Vasan R.S., Cheng S., Rhee E.P., McCabe E. Metabolite profiles and the risk of developing diabetes. Nature Medicine. 2011;17(4):448–453. - PMC - PubMed