. 2016 Aug 2;7(31):50461-50476.
doi: 10.18632/oncotarget.10459.

Salinomycin co-treatment enhances tamoxifen cytotoxicity in luminal A breast tumor cells by facilitating lysosomal degradation of receptor tyrosine kinases

Affiliations

Salinomycin co-treatment enhances tamoxifen cytotoxicity in luminal A breast tumor cells by facilitating lysosomal degradation of receptor tyrosine kinases

Ann-Katrin Sommer et al. Oncotarget. .

Abstract

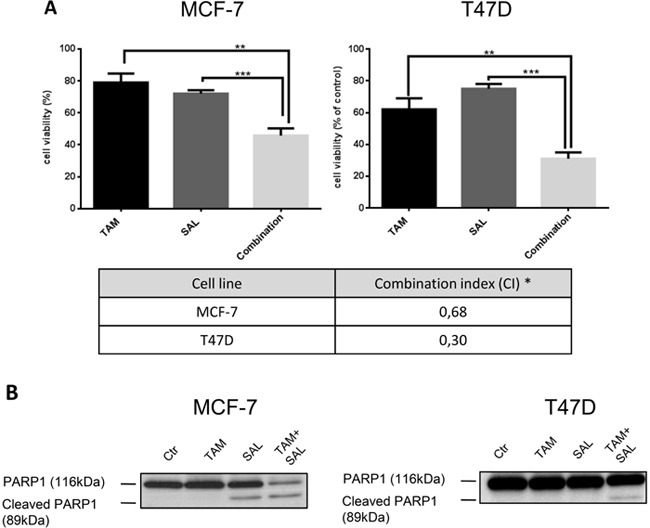
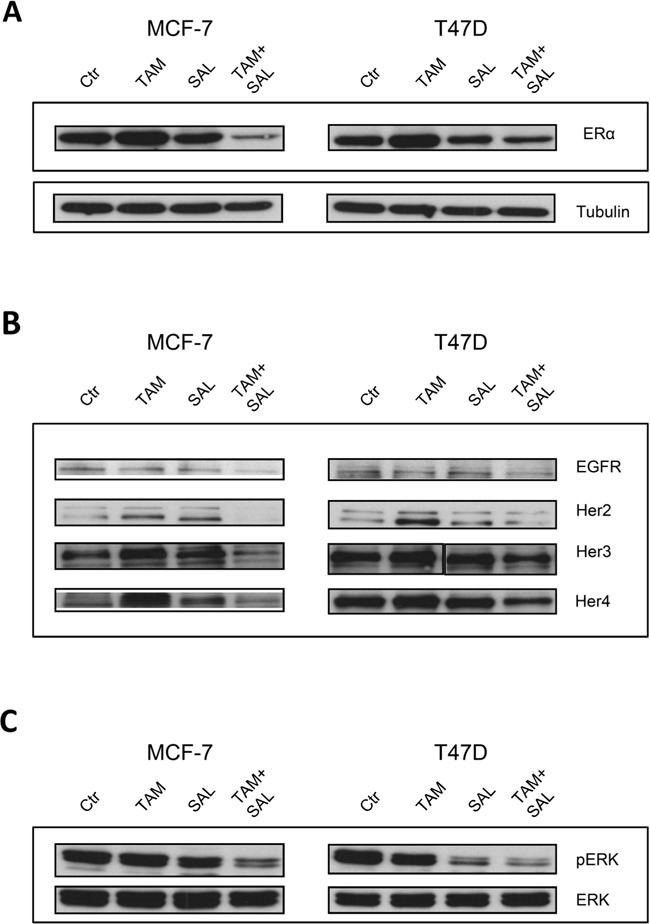
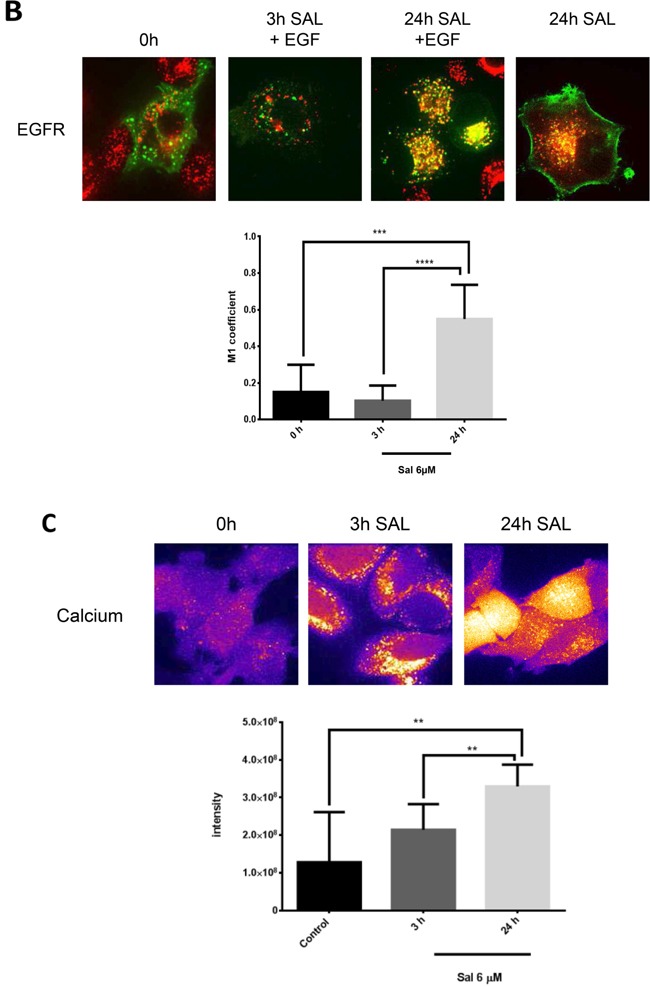
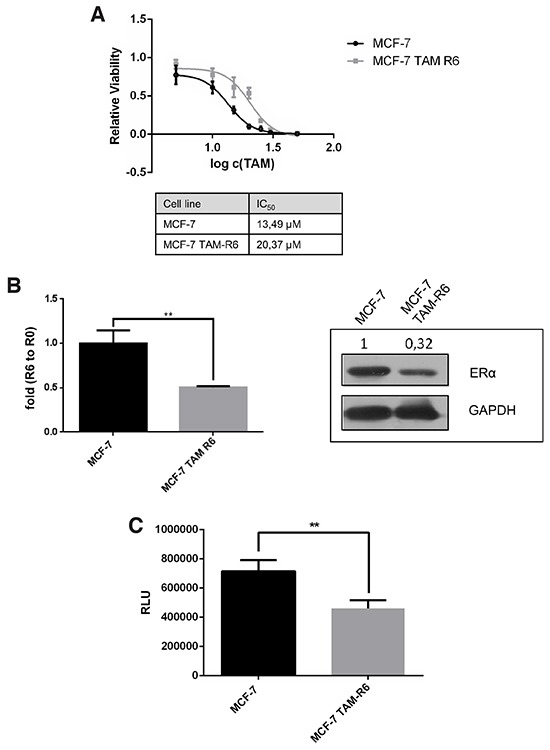
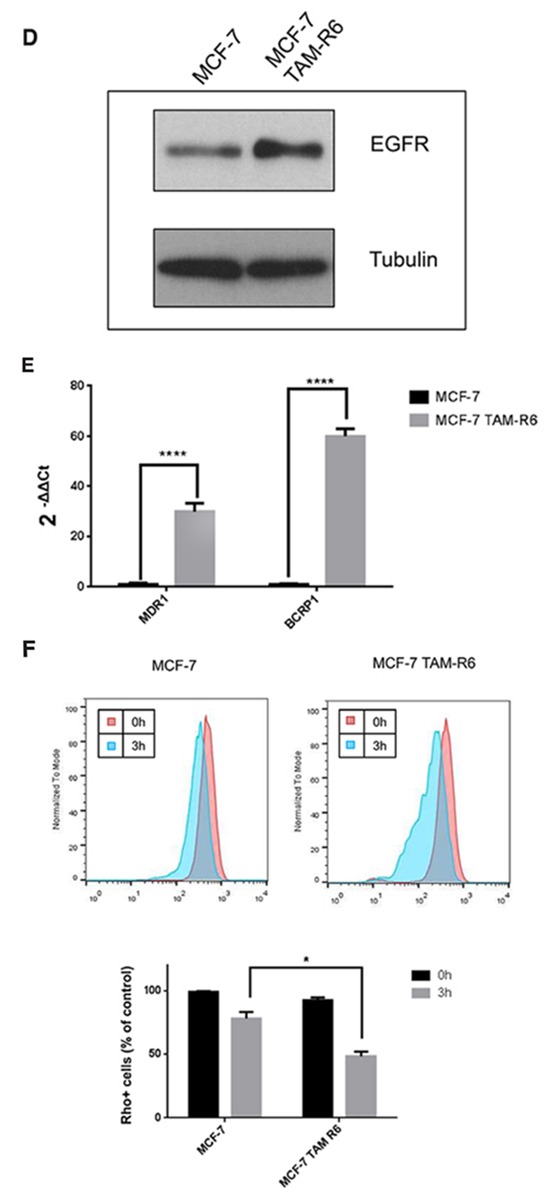
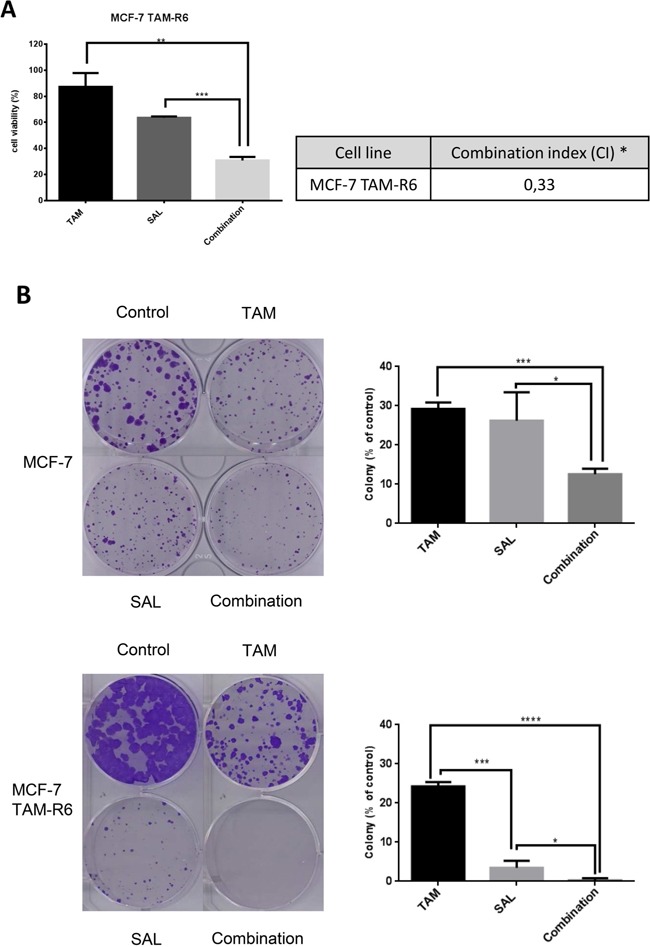
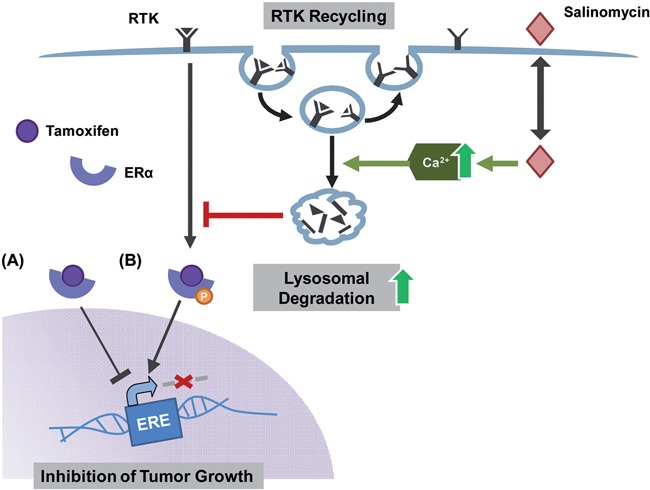
Luminal A breast cancer is the most common breast cancer subtype which is usually treated with selective estrogen receptor modulators (SERMS) like tamoxifen. Nevertheless, one third of estrogen receptor positive breast cancer patients initially do not respond to endocrine therapy and about 40% of luminal A breast tumors recur in five years. In this study, we investigated an alternative treatment approach by combining tamoxifen and salinomycin in luminal A breast cancer cell lines. We have found that salinomycin induces an additional cytotoxic effect by inhibiting the ligand independent activation of ERα. Thereby salinomycin increases the intracellular calcium level. This leads to a premature fusion of endosomes with lysosomes and thus to the degradation of Egfr family members. Since this process is essential for luminal A breast cancer cells to circumvent tamoxifen treatment, the combination of both drugs induces cytotoxicity in tamoxifen sensitive as well as resistant luminal A breast cancer cell lines.

Keywords: breast cancer; endosomal trafficking; resistance; salinomycin; tamoxifen.


Conflict of interest statement

The authors declare no conflict of interest.

Figures

Figure 1
Figure 1. Cytotoxicity of combined treatment with tamoxifen and salinomycin
A. Cytotoxicity assay of treated MCF-7 and T47D cells. Cell viability was assessed upon 72h treatment with 10μM tamoxifen, 0,5μM salinomycin or the combination using Cell Titer Glo® reagent. N=6; * CI<1: synergistic, CI=1: additive, CI>1 antagonistic. B. PARP1 cleavage. Western blot analysis of two luminal A breast cancer cell lines MCF-7 and T47D upon 72h treatment with 10μM tamoxifen, 0,5μM salinomycin or their combination. Total cell lysates were analyzed for PARP1 cleavage, an apoptosis marker. p-values: *0,05; **0,01; ***0,001; ****0,0001.
Figure 2
Figure 2. Characterization of cytotoxicity
Western blot analysis of two luminal A breast cancer cell lines MCF-7 and T47D upon 72h treatment with 10μM tamoxifen, 0,5μM salinomycin or the combination. Tubulin was used as loading control and is representative for all blots. A. Expression of ERα upon treatment. To investigate the protein expression of ERα total cell lysates were utilized. B. Ligand independent signaling of ERα. Total cell lysates were analyzed for protein expression levels of Egfr-family members. C. Ligand independent signaling of Erk1/2. To investigate the protein expression of Erk1/2 total cell lysates were utilized.
Figure 3
Figure 3. Endocytosis of Egfr-family members is altered upon salinomycin treatment
A. Egfr and Her2 accumulate in lysosomes MCF-7 cells were transfected with Egfr-eGFP or Her2-eGFP plasmid. Receptor-GFP expressing cells were imaged 48-72 hours after transfection by spinning disk microscopy. To detect the effect of salinomcyin on receptor trafficking, salinomycin was added at 6μM concentration 3h and 24h before imaging. For co-localization with lysosomes, 15nM lysotracker deep red was added. Co-localization was quantified by Image J JaCOP plug-in and displayed as Manders coefficient M1 (N=7-13 images per incubation time). Image size 62μm. B. Salinomycin inhibits receptor recycling upon EGF-stimulation MCF-7 cells were transfected with Egfr-eGFP plasmid. Receptor-GFP expressing cells were imaged 48-72 hours after transfection by spinning disk microscopy. To detect the effect of salinomcyin on receptor trafficking, salinomycin was added at 6μM concentration 3h and 24h before imaging. For co-localization with lysosomes, 15nM lysotracker deep red was added. To induce receptor endocytosis, 50 pmol/ml EGF was added to the cells. Co-localization was quantified by Image J JaCOP plug-in and displayed as Manders coefficient M1. (N=7-13 images per incubation time). Image size 62μm. C. Ca2+-levels are elevated MCF-7 cells were pretreated with 6μM salinomycin for 3h, 24h or kept without salinomycin treatment. 1 hour before imaging, 6μM Fluo-3-AM was added to the cells. To quantify the Fluo-3-AM fluorescence in the cells, digital image analysis was performed in ImageJ. Mean values of all evaluated cells are presented (N=8-10 images for each incubation time). D. Measurement of the intensity of lysosomes. MCF-7 cells were pretreated for 3h, 24h with 6μM salinomycin or kept without salinomycin treatment. 1 hour before imaging 15nM Lysotracker was added to the cells. Digital image analysis was utilized in ImageJ to quantify Lysotracker fluorescence in the cells. Mean values of all evaluated cells are presented (N=8-10 images for each incubation time) Image size 62μm. p-values: *0,05; **0,01; ***0,001; ****0,0001.
Figure 4
Figure 4. Tamoxifen resistance
MCF-7 cells were treated in several rounds with 10μM tamoxifen for 72h followed by recovery phase until a confluence of 80%. Cells that received either no treatment (MCF-7) or six treatment rounds (MCF-7 TAM-R6) were harvested for the following experiments. A. IC50 of tamoxifen in resistant cells is increased. Cytotoxicity assay of tamoxifen resistant MCF-7 cells. MCF-7 TAM-R6 cells were treated with indicated concentrations of tamoxifen for 72h. Subsequently cell viability was assessed by Cell Titer Glo® Assay (Promega). N=3. B. ERα expression in MCF-7 TAM-R6 is reduced. Quantitative RT-PCR analysis of ERα level in MCF-7 vs. MCF-7 TAM-R6 cells. Expression levels were normalized to parental MCF-7 cells. N=3 Protein expression of ERα in parental MCF-7 as well as MCF-7 TAM-R6 were analyzed by western blotting. C. Analysis of ERα signaling Parental MCF-7 and MCF-7 TAM-R6 cells were transfected with 3x-ERE-TATA-Luc plasmid (Addgene #11354) and serum-starved for 12h. Next, cells were stimulated with 1nM estradiol for 30 min and subsequently treated with 10μM tamoxifen for 12h. The luciferase signal was analyzed and normalized to control. p-values: * 0,05; ** 0,01; ***0,001; **** 0,0001. D. Egfr expression in MCF-7 TAM-R6 is increased. Western blot analysis of parental MCF-7 and MCF-7 TAM-R6 total cell lysates was performed to investigate the expression level of Egfr. Tubulin was used as loading control. E. Expression of ABC transporters is enhanced in tamoxifen resistant cells qPCR was utilized to examine the mRNA expression level of multiple-drug-resistance protein 1 (MDR1) and breast cancer resistance protein 1 (BCRP1), two ABC-transporters that are frequently causing drug resistance. F. Rhodamine123 efflux assay. The dye Rhodamine123 is a well-known target of ABC-transporters. Therefore, parental MCF-7 as well as MCF-7 TAM-R6 cells were treated for 30 minutes with 0,2 μg/ml Rhodamine123. Afterwards cells were washed to eliminate Rhodamine123, resuspended in the corresponding medium. Finally, flow cytometry was performed 1h, 2h and 3h later to determine the efflux activity. Data were normalized to untreated samples. G. Expression of cancer stem cell marker is enhanced in MCF-7 TAM-R6 compared to parental cells. To determine the occurrence of cancer stem cells in tamoxifen resistant cells three prominent CSC marker SOX-2, Oct-4 and Nanog were investigated by qPCR. H. Mammosphere formation is increased in tamoxifen resistant cells. Another possibility to analyze stem cell properties in cancer cell populations is the mammosphere forming assay. Therefore, 10 × 105 c/w parental MCF-7 as well as MCF-7 TAM-R6 were seeded in a non-adherent 96-well plate and formed spheroids were counted 7 days afterwards.
Figure 5
Figure 5. Salinomycin acts synergistic with tamoxifen to circumvent tamoxifen resistance
A. Combinatorial treatment of tamoxifen resistant cells. Cytotoxicity assay of repeatedly treated MCF-7 cells. MCF-7 TAM-R6 cells were treated with 10μM tamoxifen, 0,5μM salinomycin or their combination for 72h. Subsequently cell viability was assessed by Cell Titer Glo® Assay. N=3; * CI<1: synergistic, CI=1: additive, CI>1 antagonistic. B. Clonogenic assay – long-term resistance. To analyze long-term resistance, cells were seeded and incubated for 24h prior to 72h of treatment with 20μM tamoxifen, 10μM salinomycin or their combination. Cells were then grown for 14 days, fixed and stained. Surviving colonies were analyzed by ColonyArea (Image J plug-in), N=3 p-values: *0,05; **0,01; ***0,001; ****0,0001.
Figure 6
Figure 6. Hypothesis how salinomycin hampers the ligand independent activation of ERα
Tamoxifen binds the ERα and subsequently inhibits the transcription of estrogen responsive genes responsible for tumor growth (A) Luminal A tumors however are able to circumvent this blockage via the ligand independent phosphorylation of the ERα by enhanced RTK signaling (B) A combinatorial treatment of tamoxifen-sensitive as well as -resistant cells with tamoxifen and salinomycin hampers both ways of ERα activation as salinomycin enhances lysosomal degradation of RTK via an increase of Ca2+.

Similar articles

Cited by

References

    1. Society AC. Cancer Facts and Figures 2016. Atlanta: American Cancer Society; 2016.
    1. Society AC. Breast Cancer Facts and Figures 2015-2016. Atlanta: American Cancer Society, Inc; 2015.
    1. Blows FM, Driver KE, Schmidt MK, Broeks A, van Leeuwen FE, Wesseling J, Cheang MC, Gelmon K, Nielsen TO, Blomqvist C, Heikkila P, Heikkinen T, Nevanlinna H, Akslen LA, Begin LR, Foulkes WD, et al. Subtyping of breast cancer by immunohistochemistry to investigate a relationship between subtype and short and long term survival: a collaborative analysis of data for 10,159 cases from 12 studies. PLoS medicine. 2010;7:e1000279. - PMC - PubMed
    1. Eroles P, Bosch A, Perez-Fidalgo JA, Lluch A. Molecular biology in breast cancer: intrinsic subtypes and signaling pathways. Cancer treatment reviews. 2012;38:698–707. - PubMed
    1. Johnston SR, Dowsett M. Aromatase inhibitors for breast cancer: lessons from the laboratory. Nature reviews Cancer. 2003;3:821–831. - PubMed

MeSH terms