. 2016 Aug 9;7(32):51503-51514.
doi: 10.18632/oncotarget.10491.

Induction of HOXA9 expression in three-dimensional organotypic culture of the Claudin-low breast cancer cells

Affiliations

Induction of HOXA9 expression in three-dimensional organotypic culture of the Claudin-low breast cancer cells

Miao Li et al. Oncotarget. .

Abstract

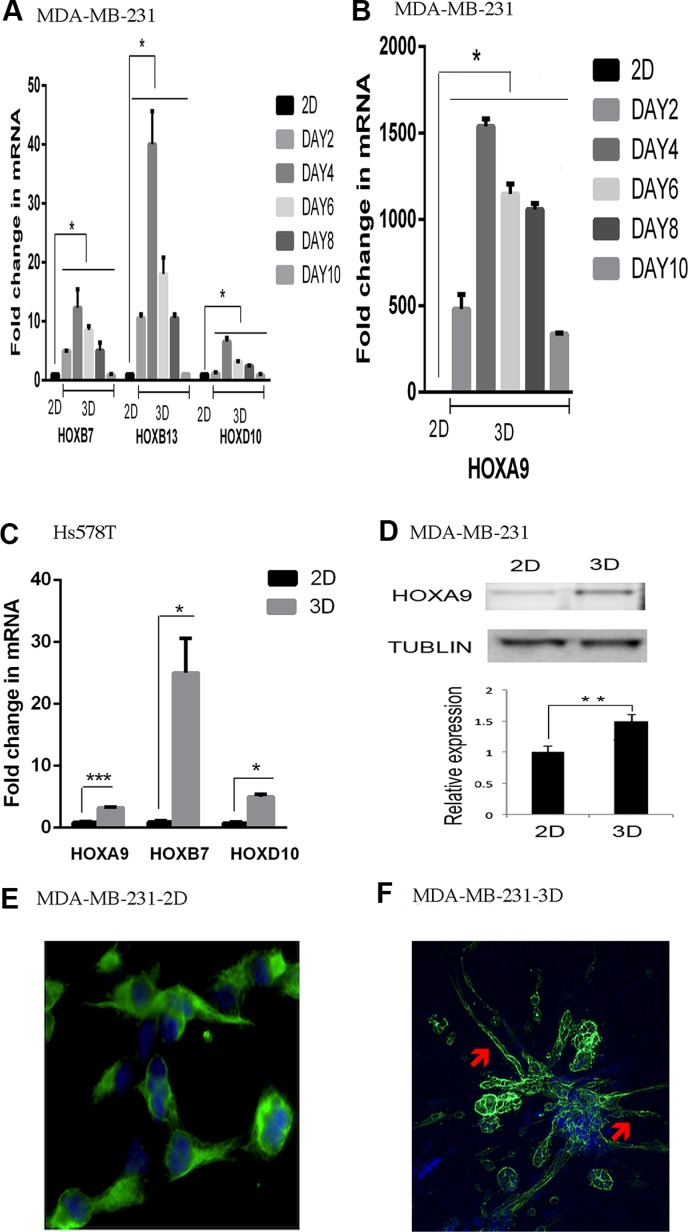
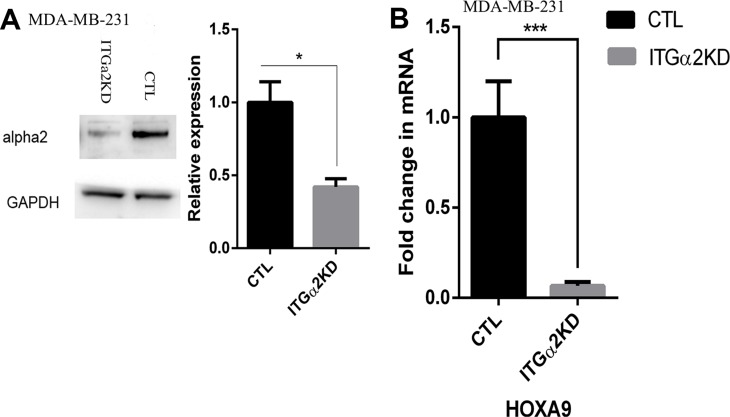
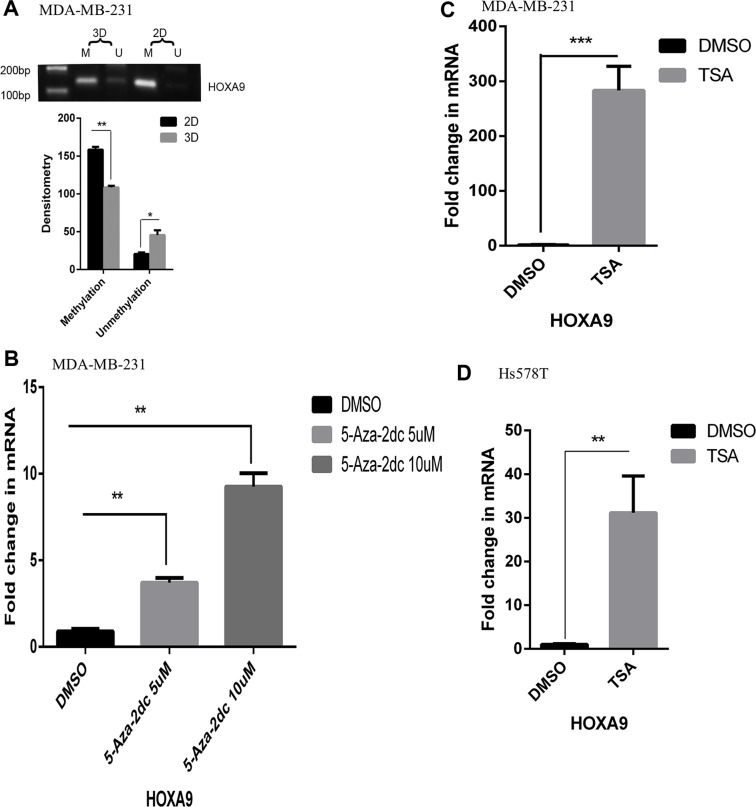
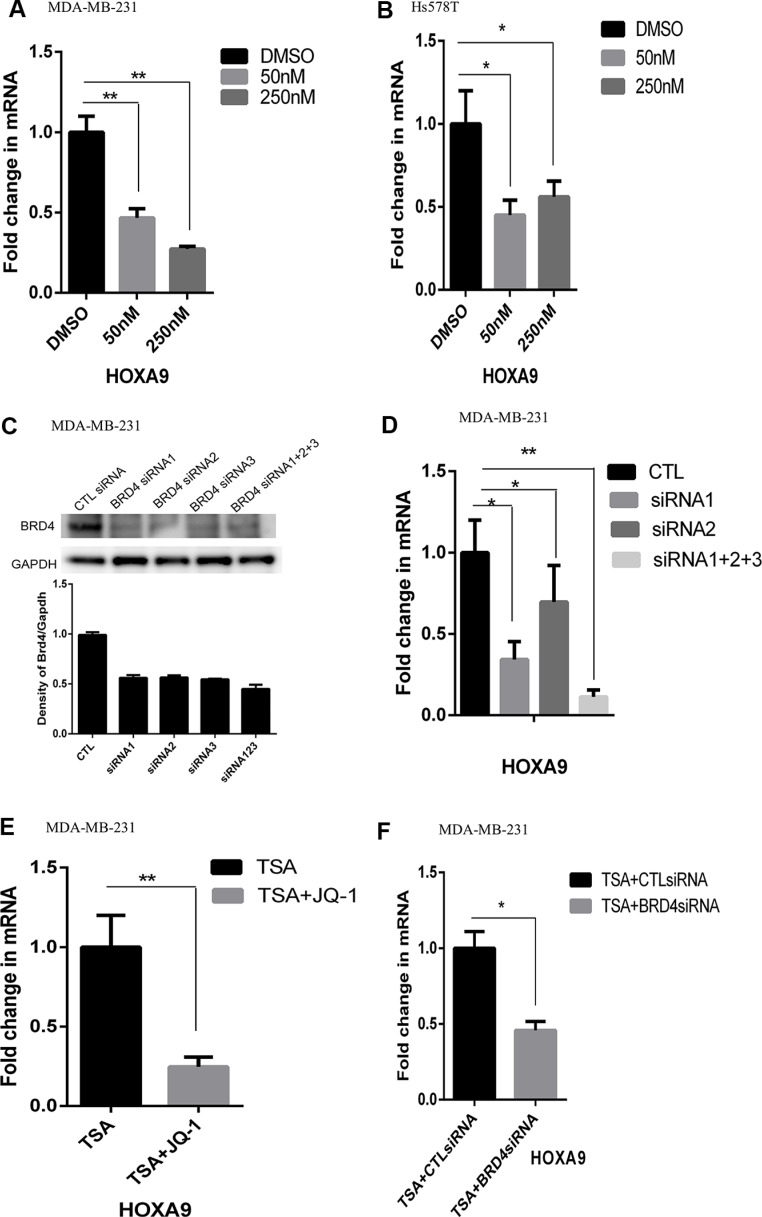
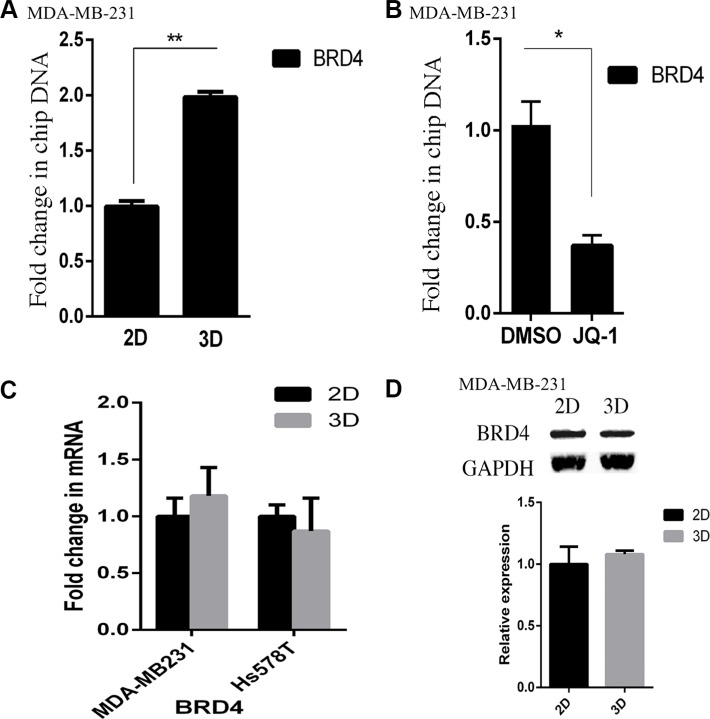
The gene expression signatures of the molecular intrinsic subtypes of breast cancer are regulated by epigenetic mechanisms such as methylation of CpG islands in gene promoters. Epigenetic codes can be regulated by the tumor microenvironment. The Claudin-low subtype is associated with triple-negative invasive ductal carcinomas in patients. Herein we explored epigenetic regulation of gene expression in the Claudin-low breast cancer cells by extracellular matrix (ECM), a key component of the tumor microenvironment. We modeled attachment to ECM using laminin rich ECM three-dimensional organotypic culture (lrECM 3D). In 2D and lrECM 3D cultures we examined expression of the homeobox (HOX) genes that epigenetically regulated in development and cancer. We demonstrated induction of the selected HOX genes in lrECM 3D culture of the Claudin-low breast cancer cells MDA-MB-231 and Hs578T. In particular activation of HOXA9 expression in lrECM 3D culture required binding of bromodomain containing 4 to the HOXA9 promoter and involved CpG hypomethylation. Our findings warrant further investigation of the ECM-regulated epigenetic coding of gene expression in the Claudin-low breast cancer.

Keywords: breast cancer; extracellular matrix; gene expression; homeobox gene; three-dimensional organotypic culture.


Conflict of interest statement

The authors declare that they have no conflicts of interest with the contents of this article.

Figures

Figure 1
Figure 1. Induction of the HOX genes in lrECM 3D culture
(A) Total cell RNA was extracted from MDA-MB-231 cells in 2D (day 3) and lrECM 3D cultures at the indicated time points. The mRNA levels of the selected HOX genes were compared between 2D and lrECM 3D cultures using qRT-PCR. A fold change of each transcript at each time point in lrECM 3D culture over 2D culture was obtained by normalizing to the housekeeping gene RPLP0 and setting the values from 2D culture to one. (B) Similar to part A except that the mRNA levels of HOXA9 were compared between two culture conditions. (C) Similar to part A except that the mRNA levels of the selected HOX genes were compared between 2D (day 3) and lrECM 3D cultures (day 4) of Hs578T cells. (D) Total cell lysates were extracted from 2D (day 3) and lrECM 3D (day 6) cultures of MDA-MB231 cells. The protein levels of HOXA9 were measured using immunoblots. (E) The morphology of MDA-MB-231 cells in 2D culture was visualized by immunofluorescence for the intermediate filament vimentin using a vimentin-specific antibody and an Alexa 488-conjugated secondary antibody (pseudocolored in green). The image was captured at 400× magnification. (F) The morphology of MDA-MB-231 cells in lrECM 3D culture (day 6) was visualized by staining for filamentous actin using Alexa 488 conjugated phalloidin (pseudocolored in green). The stellate projections were indicated by red arrowheads. In part E and F the nucleus was stained using DAPI (pseudocolored in blue). The image was captured at 200× magnification. When presented, means and standard deviations were obtained from three independent experiments. *, **, and *** indicate a P value < 0.05, 0.01, 0.001, respectively. In Figure 1A, P values range from < 0.05 to < 0.001. For the sake of presentation, we used the largest P value (*) to indicate the statistical difference between 2D culture and each indicated time point of lrECM 3D culture.
Figure 2
Figure 2. Reduced expression of HOXA9 by inhibition of integrin α2
(A) Total cell lysates were extracted from two MDA-MB-231 cells variants that were transduced with lentiviral particles expressing integrin α2-specific Mission shRNA (ITGα2KD) or a matching control shRNA (CTL). The protein levels of integrin α2 were measured using immunoblots. (B) Total cell RNA was extracted from the ITGα2KD and CTL variants on day 6 of lrECM 3D culture. The mRNA levels of HOXA9 were measured using qRT-PCR. A fold change of HOXA9 in ITGα2KD cells over CTL cells was obtained by normalizing to the housekeeping gene RPLP0 and setting the values from CTL cells to one. When presented, means and standard deviations were obtained from three independent experiments. * and *** indicate a P value < 0.05 and 0.001, respectively.
Figure 3
Figure 3. Hypomethylation of the HOXA9 promoter in lrECM 3D culture
(A) Total cell DNA was extracted from MDA-MB-231 cells in 2D and lrECM 3D cultures on day 6. CpG methylation of the HOXA9 promoter was compared between two culture conditions using bisulfite treatment coupled with methylation-specific PCR. The intensity of each PCR product was quantified by densitometry using NIH Image J. (B) Total cell RNA was extracted from 2D culture of MDA-MB-231 cells with exposure to either a DNMT inhibitor, 5-Aza-2dC (5 & 10 μM) or DMSO for 72 hrs. The mRNA levels of HOXA9 were measured using qRT-PCR. A fold change was obtained by normalizing to the housekeeping gene RPLP0 and setting thevalues from the DMSO group to one. (C) Similar to part B except that the mRNA levels of HOXA9 were compared between the TSA (500 nM, 72 hrs) treated group and the DMSO treated group. (D) Similar to part C except that the mRNA levels of HOXA9 were compared between the TSA (500 nM, 72 hrs) treated group and the DMSO treated group in Hs578T cells. When presented, means and standard deviations were obtained from three independent experiments. *, **, *** indicate a P value < 0.05, 0.01, 0.001, respectively.
Figure 4
Figure 4. Reduced expression of HOXA9 by inhibition of BRD4
(A) Total cell RNA was extracted from lrECM 3D cultures of MDA-MB-231 cells treated with either a BRD4-specific inhibitor JQ1 (50 and 250 nM) or DMSO for 4 days. The mRNA levels of HOXA9 were measured using qRT-PCR. A fold change of the HOXA9 mRNA was obtained by normalizing to the house keeping gene RPLP0 and setting the values from the DMSO treated group to one. (B) Similar to part A except that total RNA was extracted from Hs578T cells cultured under the same condition. (C) MDA-MB-231 cells were transfected with either BRD4-specific siRNAs (BRD4si, three distinct siRNA labeled as 1–3) or the matching control siRNAs (CTL siRNA). The protein levels of BRD4 were measured using immunoblots and quantified using densitometry. (D) MDA-MB-231 cells were transfected with either BRD4-specific siRNAs or the matching control siRNAs (CTL) and seeded in lrECM 3D culture. Total cell RNA was extracted on day 4 in lrECM 3D culture. The mRNA levels of HOXA9 were measured using qRT-PCR. A fold change of the HOXA9 mRNA in the BRD4-specific siRNA groups (siRNA1, siRNA2, siRNA1+2+3) over that in the CTL siRNA (CTL) group was obtained by normalizing to the housekeeping gene RPLP0 and setting the values from the CTL group to one. (E) Total cell RNA was extracted from 2D culture of MDA-MB-231 cells treated with either TSA (500 nM) alone or a combination of TSA and JQ1 (250 nM) for 72 hrs. The mRNA levels of HOXA9 were measured using qRT-PCR. A fold change of the HOXA9 mRNA in the TSA and JQ1 treated group over the TSA group was obtained by normalizing to the housekeeping gene RPLP0 and setting the values from the TSA group to one. (F) Similar to part E except that the mRNA levels of HOXA9 were measured in 2D culture of MDA-MB-231 cells exposed to TSA (500 nM) with transfection of control siRNA (CTLsiRNA) or the BRD4-specific siRNA (BRD4siRNA, a pool of siRNA1–3). When presented, means and standard deviations were obtained from three independent experiments. * and ** indicate a P value < 0.05 and 0.01, respectively.
Figure 5
Figure 5. Elevated binding of BRD4 to the HOXA9 promoter in lrECM 3D culture
(A) ChIP assays were carried out using a BRD4-specific antibody in 2D and lrECM 3D cultures of MDA-MB-231 cells on day 4. The BRD4 bound HOXA9 promoter was measured using qPCR and normalized to their corresponding input. A fold change of the BRD4-bound HOXA9 promoter in lrECM 3D culture over 2D culture was obtained by setting the values from 2D culture to one. (B) Similar to part A except that the BRD4-bound HOXA9 promoter was compared between lrECM 3D cultures treated with either JQ1 (250 nM) or DMSO. A fold change of the BRD4-bound HOXA9 promoter in the JQ1 group over the DMSO group was obtained by setting the values from the DMSO group to one. (C) Total cell RNA was extracted from MDA-MB-231 and Hs578T cells in 2D and lrECM 3D cultures on day 4. The mRNA levels of BRD4 were compared between 2D and lrECM 3D cultures using qRT-PCR. A fold change of BRD4 mRNA was obtained by normalizing to the housekeeping gene RPLP0 and setting the values from 2D culture to one. (D) Similar to part C except that the protein levels of BRD4 were measured using immunoblots. When presented, means and standard deviations were obtained from three independent experiments. * and ** indicate a P value < 0.05 and 0.01, respectively.

Similar articles

Cited by

References

    1. Prat A, Perou CM. Deconstructing the molecular portraits of breast cancer. Mol Oncol. 2011;5:5–23. - PMC - PubMed
    1. Perou CM, Sorlie T, Eisen MB, van de Rijn M, Jeffrey SS, Rees CA, Pollack JR, Ross DT, Johnsen H, Akslen LA, Fluge O, Pergamenschikov A, Williams C, et al. Molecular portraits of human breast tumours. Nature. 2000;406:747–752. - PubMed
    1. Sorlie T, Perou CM, Tibshirani R, Aas T, Geisler S, Johnsen H, Hastie T, Eisen MB, van de Rijn M, Jeffrey SS, Thorsen T, Quist H, Matese JC, et al. Gene expression patterns of breast carcinomas distinguish tumor subclasses with clinical implications. Proc Natl Acad Sci U S A. 2001;98:10869–10874. - PMC - PubMed
    1. Parker JS, Mullins M, Cheang MC, Leung S, Voduc D, Vickery T, Davies S, Fauron C, He X, Hu Z, Quackenbush JF, Stijleman IJ, Palazzo J, et al. Supervised risk predictor of breast cancer based on intrinsic subtypes. J Clin Oncol. 2009;27:1160–1167. - PMC - PubMed
    1. Holliday DL, Speirs V. Choosing the right cell line for breast cancer research. Breast Cancer Res. 2011;13:215. - PMC - PubMed