Optimal channels for channelized quadratic estimators
- PMID: 27409452
- PMCID: PMC8123080
- DOI: 10.1364/JOSAA.33.001214
Optimal channels for channelized quadratic estimators
Abstract
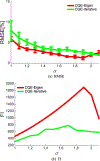
We present a new method for computing optimized channels for estimation tasks that is feasible for high-dimensional image data. Maximum-likelihood (ML) parameter estimates are challenging to compute from high-dimensional likelihoods. The dimensionality reduction from M measurements to L channels is a critical advantage of channelized quadratic estimators (CQEs), since estimating likelihood moments from channelized data requires smaller sample sizes and inverting a smaller covariance matrix is easier. The channelized likelihood is then used to form ML estimates of the parameter(s). In this work we choose an imaging example in which the second-order statistics of the image data depend upon the parameter of interest: the correlation length. Correlation lengths are used to approximate background textures in many imaging applications, and in these cases an estimate of the correlation length is useful for pre-whitening. In a simulation study we compare the estimation performance, as measured by the root-mean-squared error (RMSE), of correlation length estimates from CQE and power spectral density (PSD) distribution fitting. To abide by the assumptions of the PSD method we simulate an ergodic, isotropic, stationary, and zero-mean random process. These assumptions are not part of the CQE formalism. The CQE method assumes a Gaussian channelized likelihood that can be a valid for non-Gaussian image data, since the channel outputs are formed from weighted sums of the image elements. We have shown that, for three or more channels, the RMSE of CQE estimates of correlation length is lower than conventional PSD estimates. We also show that computing CQE by using a standard nonlinear optimization method produces channels that yield RMSE within 2% of the analytic optimum. CQE estimates of anisotropic correlation length estimation are reported to demonstrate this technique on a two-parameter estimation problem.
Figures

Similar articles
-
Method for optimizing channelized quadratic observers for binary classification of large-dimensional image datasets.J Opt Soc Am A Opt Image Sci Vis. 2015 Apr 1;32(4):549-65. doi: 10.1364/JOSAA.32.000549. J Opt Soc Am A Opt Image Sci Vis. 2015. PMID: 26366764 Free PMC article.
-
Parametric and nonparametric population methods: their comparative performance in analysing a clinical dataset and two Monte Carlo simulation studies.Clin Pharmacokinet. 2006;45(4):365-83. doi: 10.2165/00003088-200645040-00003. Clin Pharmacokinet. 2006. PMID: 16584284
-
Comparison of supervised-learning approaches for designing a channelized observer for image quality assessment in CT.Med Phys. 2023 Jul;50(7):4282-4295. doi: 10.1002/mp.16227. Epub 2023 Jan 31. Med Phys. 2023. PMID: 36647620
-
A Comparison of Penalized Maximum Likelihood Estimation and Markov Chain Monte Carlo Techniques for Estimating Confirmatory Factor Analysis Models With Small Sample Sizes.Front Psychol. 2021 Apr 29;12:615162. doi: 10.3389/fpsyg.2021.615162. eCollection 2021. Front Psychol. 2021. PMID: 33995176 Free PMC article.
-
Overall mean estimation of trace evidence in a two-level normal-normal model.Forensic Sci Int. 2019 Apr;297:342-349. doi: 10.1016/j.forsciint.2019.01.047. Epub 2019 Feb 10. Forensic Sci Int. 2019. PMID: 30903935 Review.
References
-
- Barrett HH, Denny J, Wagner RF, and Myers KJ, “Objective assessment of image quality. II. Fisher information, Fourier crosstalk, and figures of merit for task performance,” J. Opt. Soc. Am. A 12, 834–852 (1995). - PubMed
-
- O’Sullivan J, Blahut RE, and Snyder DL, “Information-theoretic image formation,” IEEE Trans. Inf. Theory 44, 2094–2123 (1998).
-
- Kupinski MA, Clarkson E, Gross K, and Hoppin JW, “Optimizing imaging hardware for estimation tasks,” Proc. SPIE 5034, 309–313 (2003).
Grants and funding
LinkOut - more resources
Full Text Sources
Other Literature Sources

